 Open Access Article
Creative Commons Attribution 3.0 Unported Licence
A highly selective and sensitive fluorescent chemosensor for Zn2+ based on a diarylethene derivative†
Erting Feng,
Yayi Tu,
Congbin Fan *,
Gang Liu and
Shouzhi Pu*
Jiangxi Key Laboratory of Organic Chemistry, Jiangxi Science and Technology Normal University, Nanchang 330013, P. R. China. E-mail: congbinfan@163.com; pushouzhi@vip.163.com; Fax: +86 791 83805212; Fax: +86 791 83831996; Tel: +86 791 83805212 Tel: +86 791 83831996
First published on 27th October 2017
Abstract
A promising photochromic fluorescent chemosensor 1o linked with Schiff base unit was synthesized. It displayed outstanding photochromism and a superb fluorescence turn-on response toward Zn2+. Upon the addition of Zn2+ to 1o, the fluorescent color of the solution obviously changed from blue to bright green with a 27-fold fluorescent intensity increase. The combination of 1o–Zn2+ with 1![[thin space (1/6-em)]](https://www.rsc.org/images/entities/char_2009.gif) :
:![[thin space (1/6-em)]](https://www.rsc.org/images/entities/char_2009.gif) 1 stoichiometry was verified by Job's plot and MS analysis. The detection limit for 1o toward Zn2+ was measured to be 8.10 × 10⁻⁸ M. Furthermore, logic gate research was established with Zn2+, UV and visible light as input signals and the emission intensity as the output signal.
1 stoichiometry was verified by Job's plot and MS analysis. The detection limit for 1o toward Zn2+ was measured to be 8.10 × 10⁻⁸ M. Furthermore, logic gate research was established with Zn2+, UV and visible light as input signals and the emission intensity as the output signal.
1. Introduction
It is well known that zinc is the second most plentiful transition metal in cells as well as the requisite ingredient to maintain life.1 Many research studies reveal that Zn2+ plays a crucial role in a number of biological metabolic processes, such as enzyme regulation, neural signal modulation and apoptosis.2–4 Free Zn2+ exist in some tissues, acting as signal transporters for nerve transmission and necrocytosis.5,6 Micro quantities of zinc are essential with about 2–4 g distributed over the human body,7,8 but its excess may damage the organism,9,10 for instance, overmuch Zn2+ in the body will suppress the ingestion of other essential trace metal ions such as Fe3+ and Cu2+.11,12 The inconsistency of Zn2+ concentration with the normal levels in the human body will cause diverse diseases, e.g., diabetes, Alzheimer's disease, epilepsy and so forth.13,14 Hence, studies focused on Zn2+ detection are of great significance. Up to now, conventional ways used for identifying Zn2+, such as atomic absorption spectrometry15 and inductively coupled plasma mass spectrometry,16 generally require precision instruments, high cost and inconvenient operation. Therefore, it is worthwhile to develop new methods with low cost, easy operability and high selectivity for Zn2+ detection.In recent decades, fluorescent chemosensors have developed rapidly to monitor special species in numerous fields such as environmental analysis and clinical diagnosis17,18 due to its high selectivity, efficient sensitivity, real-time detection and easy sample preparation.19,20 Up to now, a considerable amount of fluorescent sensors targeting transition and heavy metal ions with transient response and splendid selectivity have been reported.21–24 As known to all, quinoline as an important fine chemical raw material, mainly used for the synthesis of pharmaceutical, dyes and a variety of chemical catalysts.25–29 On the other hand, an increasing number of photochromic molecular systems have been used as fluorescent probes to detect metal ions in recent years.30–32 Among these photochromic materials, diarylethenes have attracted increasing attention due to its excellent anti-fatigue for switching the intensity of fluorescent emission as well as its potential applications in molecular switching devices.33,34 Heretofore, a variety of Zn2+ fluorescence chemosensors decorated with diarylethenes have been reported.35,36 However, these sensors either have poor detection limits or disturbances of other metal ions, such as Cd2+ exhibiting similar chemical properties.37,38
Herein, we designed a novel fluorescent turn-on chemosensor (1o) based on a diarylethene derivative for detecting Zn2+ with high selectivity and sensitivity. Besides, the recognition of Zn2+ did not have any disturbance from Cd2+. The synthetic route and photochromism of target sensor 1o were shown in Scheme 1. Related substances in this paper are characterized by 1H NMR, 13C NMR and mass spectrum as seen in the ESI (Fig. S9–S17†).
2. Experimental
2.1 General methods
All reagents were analytical grade without further purification and all other solvents used in properties testing were spectroscopic grade. The solutions of the metal ions were prepared from the nitrates (0.1 M) of Cu2+, Zn2+, Cd2+, Fe3+, Pb2+, Ca2+, Co2+, Cr3+, Ni2+, Mg2+, Sr2+ and Al3+, except for K+, Ba2+, Mn2+, Hg2+ (their counter ions were chloride ions), in distilled water (2 mL). 1H NMR and 13C NMR spectra were recorded on a Bruker AV400 (400 MHz) spectrometer with tetramethylsilane (TMS) as its internal standard. Melting points were obtained on a WRS-1B melting point apparatus. Mass spectra were measured on an AB SCIEX Triple TOF 4600 instrument. Elemental analysis was performed with a PE CHN 2400 analyzer. The fluorescence quantum yield was recorded with an Absolute PL Quantum Yield Spectrometer QY C11347-11. UV-Vis absorption spectra were measured on an Agilent 8453 UV-Vis spectrometer. Fluorescence spectra were recorded with a Hitachi F-4600 fluorescence spectrophotometer. Photo-irradiation was performed with an SHG-200 UV lamp, Cx-21 ultraviolet fluorescence analysis cabinet and a BMH-250 visible lamp.2.2 Synthesis of compound 3
The synthetic route was shown in Scheme 1. Compound 2 (ref. 39) (0.54 g, 1 mmol) and a catalytic amount of acetic acid were dissolved in anhydrous ethanol (10 mL). The solution was heated to reflux for 6 h until no compound 2 was detected by TLC silica gel plate detection. Then the solvent was removed under reduced pressure, and the mixture was extracted with dichloromethane. The organic layer was washed with brine and water, dried over anhydrous Na2SO4 and evaporated to dryness under reduced pressure to obtain the crude product 3, which was purified by separating on a silica gel chromatography column with petroleum ether/ethyl acetate (10/1) as the eluent to obtain the compound 3 (0.51 g, yield: 90%). 1H NMR (400 MHz, CDCl3, TMS), δ (ppm): 1.39 (t, 3H, –CH3), 1.97 (s, 3H, –CH3), 2.31 (s, 3H, –CH3), 4.35–4.40 (m, 2H, –CH2–), 7.25 (s, 1H, Ar-H), 7.29–7.37 (m, 2H, Ar-H), 7.45 (d, 2H, Ar-H), 7.57 (d, 1H, Ar-H), 7.73 (d, 1H, Ar-H), 7.99 (d, 2H, Ar-H). 13C NMR (100 MHz, CDCl3, TMS), δ (ppm): 14.42, 14.91, 61.14, 120.37, 122.17, 122.21, 124.14, 124.69, 125.10, 125.26, 125.64, 129.75, 130.38, 137.43, 138.41, 140.69, 142.59, 143.09, 166.17. Anal. calcd for C28H20F6O2S2 (%): C, 59.36; H, 3.56. Found: C, 59.31; H, 3.59. ESI-MS: m/z = 565.0721 [M − H]− (calcd 565.0731).2.3 Synthesis of compound 4
Compound 3 (0.57 g, 1 mmol) was suspended in anhydrous ethanol (10 mL) and then hydrazine hydrate (99%, 2 mL) was added dropwise. The mixture was heated at 353 K and stirred for 12 h. After removing the solvent by evaporation under reduced pressure, the crude product 4 was purified by column chromatography using petroleum ether/ethyl acetate (3/1, 1% Et3N) as the eluent to acquire the compound 4 (0.25 g, yield: 45%). 1H NMR (400 MHz, CDCl3, TMS), δ (ppm): 1.96 (s, 3H, –CH3), 2.31 (s, 3H, –CH3), 3.49 (s, 2H, –NH2), 7.25 (s, 1H, Ar-H), 7.30–7.38 (m, 3H, Ar-H), 7.48 (d, 2H, Ar-H), 7.57 (d, 1H, Ar-H), 7.71–7.76 (m, 3H, Ar-H). 13C NMR (100 MHz, CDCl3, TMS), δ (ppm): 14.76, 14.84, 120.24, 122.05, 122.09, 122.15, 123.77, 124.62, 125.02, 125.42, 125.49, 127.78, 136.46, 138.24, 138.32, 140.49, 142.56, 142.90, 167.86. Anal. calcd for C26H18F6N2OS2 (%): C, 56.52; H, 3.28; N, 5.07. Found: C, 56.44; H, 3.31; N, 5.09. ESI-MS: m/z = 551.0684 [M − H]− (calcd 551.0686).2.4 Synthesis of compound 1o
Compound 4 (0.11 g, 0.2 mmol) was suspended in absolute ethanol (10 mL), followed by the addition of 1-butyl-2-oxo-1,2-dihydroquinoline-3-carbaldehyde (0.045 g, 0.2 mmol) and a catalytic amount of acetic acid. The mixture was stirred at 353 K for 12 h to complete the reaction. Then the solution was cooled to room temperature and put in a refrigerator overnight. A yellow solid precipitation was observed and then washed with absolute methanol (10 mL × 3) to afford the compound 1o (0.091 g, yield: 60%). Mp: 342–343 K. 1H NMR (400 MHz, CD2Cl2, TMS), δ (ppm): 0.88 (t, 3H, –CH3), 1.34 (m, 2H, –CH2–), 1.59 (m, 2H, –CH2–), 1.90 (s, 3H, –CH3), 2.26 (s, 3H, –CH3), 4.16 (t, 2H, –CH2–), 7.16–7.30 (m, 5H, Ar-H), 7.43–7.53 (m, 4H, Ar-H), 7.64 (d, 1H, Ar-H), 7.69 (d, 1H, Ar-H), 7.78 (d, 2H, Ar-H), 8.47 (s, 1H, –CH![[double bond, length as m-dash]](https://www.rsc.org/images/entities/char_e001.gif) N–), 8.61 (s, 1H, Ar-H), 9.89 (s, 1H, –NH–). 13C NMR (100 MHz, CD2Cl2, TMS), δ (ppm): 14.19, 15.24, 20.84, 30.13, 43.05, 44.16, 114.95, 115.46, 120.62, 121.17, 122.58, 122.76, 123.07, 124.04, 124.57, 125.20, 125.58, 126.02, 130.90, 132.10, 132.80, 133.45, 138.79, 139.01, 140.29, 161.57. Anal. calcd for C40H31F6N3O2S2 (%): C, 62.90; H, 4.09; N, 5.50. Found: C, 62.83; H, 4.12; N, 5.56. ESI-MS: m/z = 762.1666 [M − H]− (calcd 762.1684).
N–), 8.61 (s, 1H, Ar-H), 9.89 (s, 1H, –NH–). 13C NMR (100 MHz, CD2Cl2, TMS), δ (ppm): 14.19, 15.24, 20.84, 30.13, 43.05, 44.16, 114.95, 115.46, 120.62, 121.17, 122.58, 122.76, 123.07, 124.04, 124.57, 125.20, 125.58, 126.02, 130.90, 132.10, 132.80, 133.45, 138.79, 139.01, 140.29, 161.57. Anal. calcd for C40H31F6N3O2S2 (%): C, 62.90; H, 4.09; N, 5.50. Found: C, 62.83; H, 4.12; N, 5.56. ESI-MS: m/z = 762.1666 [M − H]− (calcd 762.1684).
3. Results and discussion
3.1 Photochromic and fluorescent properties of compound 1o
The photochromism of compound 1o (20 μM in THF) at room temperature was shown in Fig. 1a. In the initial state of 1o, two split absorption peaks were observed at 341 nm and 382 nm, which can be ascribed to π → π* transition,40,41 and the solution was colorless. Upon irradiation with 297 nm light, two sharp bands at 341 nm and 382 nm gradually decreased and a new broad band at 555 nm was observed, indicating the formation of closed ring isomer 1c. When the photostationary state (PSS) was reached, a clear isosbestic spot at 410 nm was observed, and the solution changed from colorless to purple. Relatively, when irradiated with appropriate visible light (λ > 500 nm), the absorption spectrum intensity at 555 nm recovered to the original state due to the ring cleavage reaction. While in ultraviolet region, a new status different from 1o was reached which may because of C![[double bond, length as m-dash]](https://www.rsc.org/images/entities/char_e001.gif) N isomerization (Fig. S1†). A dissimilar open loop isomer (1o′) was generated as shown in Scheme 2. Anti-fatigue tests (λ = 555 nm) were carried out through 15 cycles of coloration–decoloration (Fig. S2†), and the result indicated that 1o had prominent fatigue resistance. Fig. 1b shows the fluorescence spectra changes of 1o (20 μM in THF) upon irradiation with UV-Vis light. The original state of 1o displayed weak fluorescence at 464 nm when excited at 380 nm with a low quantum yield (Φ = 0.008). Upon irradiation with 297 nm light, the fluorescence emission peak gradually decreased due to the generation of non-fluorescent isomer 1c.42 When the PSS was reached, the fluorescent color changed from blue to darkness. Unfortunately, when irradiated with visible light (λ > 500 nm), the fluorescence intensity hardly changed which may be ascribed to the isomerization of C
N isomerization (Fig. S1†). A dissimilar open loop isomer (1o′) was generated as shown in Scheme 2. Anti-fatigue tests (λ = 555 nm) were carried out through 15 cycles of coloration–decoloration (Fig. S2†), and the result indicated that 1o had prominent fatigue resistance. Fig. 1b shows the fluorescence spectra changes of 1o (20 μM in THF) upon irradiation with UV-Vis light. The original state of 1o displayed weak fluorescence at 464 nm when excited at 380 nm with a low quantum yield (Φ = 0.008). Upon irradiation with 297 nm light, the fluorescence emission peak gradually decreased due to the generation of non-fluorescent isomer 1c.42 When the PSS was reached, the fluorescent color changed from blue to darkness. Unfortunately, when irradiated with visible light (λ > 500 nm), the fluorescence intensity hardly changed which may be ascribed to the isomerization of C![[double bond, length as m-dash]](https://www.rsc.org/images/entities/char_e001.gif) N bond in excited state.
N bond in excited state.
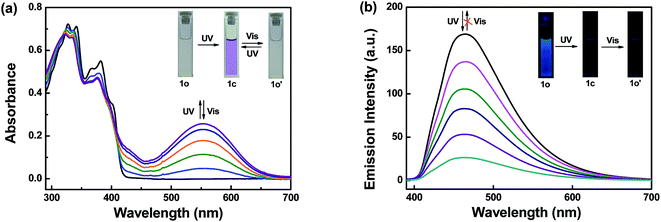 | ||
| Fig. 1 Upon irradiation with UV-Vis light: (a) absorption spectra changes of 1o (20 μM in THF), (b) fluorescence spectra changes of 1o (20 μM in THF). | ||
3.2 Absorption and fluorescence spectra responses of 1o toward Zn2+
The detection of Zn2+ by sensor 1o was initially assessed by the UV-Vis spectra. The absorption spectra changes of 1o (20 μM in THF) in the presence of different equivalents of Zn2+ (0–1.2 equiv.) were exhibited in Fig. 2a. With addition of increased amount of Zn2+, the first band around 341 nm gradually reduced and a new absorption band at 411 nm obviously increased. A plot of absorbance intensity depending on the equivalents of Zn2+ showed that the absorption intensity at 411 nm gradually increased until the amount of Zn2+ reached 1.2 equivalents (Fig. S3†). Meanwhile, a clear isosbestic point at 369 nm was observed, demonstrating the formation of 1o–Zn2+ complex. The solution color changed from colorless to yellow, which was consistent well with the absorption spectra changes. Upon irradiation with 297 nm light, the photochromic properties of 1o–Zn2+ were performed in Fig. 2b, a new absorption broad band emerged at 557 nm. At the PSS, the solution color became brown from yellow. Reversely, upon irradiation with visible light (λ > 500 nm), the absorption spectrum of 1c–Zn2+ was restored to its incipient state of 1o–Zn2+ and the solution color returned from brown to yellow.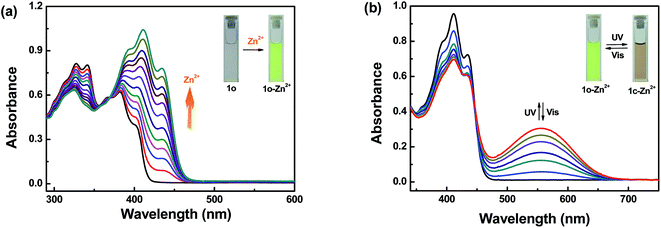 | ||
| Fig. 2 (a) Absorption spectra changes of 1o (20 μM in THF) induced by Zn2+ ions (0–1.2 equiv.). (b) Absorption spectra changes of 1o–Zn2+ (20 μM in THF) upon irradiation with UV-Vis light. | ||
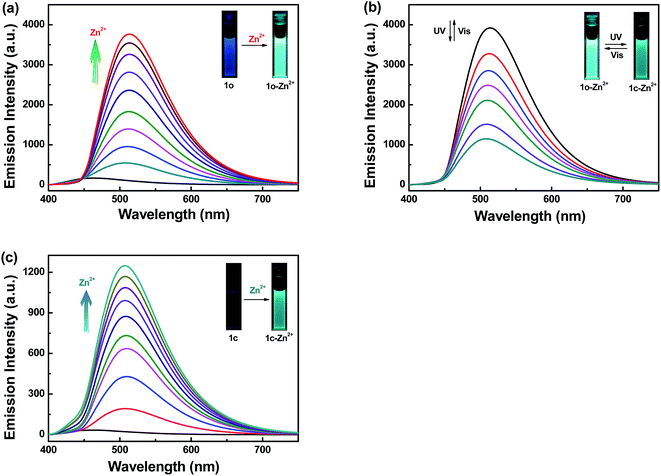
The fluorescence response experiments were ulteriorly carried out to investigate the interaction between 1o (20 μM in THF) and Zn2+ by adding various equivalents of Zn2+ (0–1 equiv.) to 1o (Fig. 3a). The fluorescence titration experiments showed that the maximum emission intensity was achieved when 1 equivalent of Zn2+ was added to the solution, excited by 380 nm light (Fig. S4†). As can be seen from above that the emission intensity of 1c can not recover to that of 1o due to the free rotation around C![[double bond, length as m-dash]](https://www.rsc.org/images/entities/char_e001.gif) N bond. The isomerization of C
N bond. The isomerization of C![[double bond, length as m-dash]](https://www.rsc.org/images/entities/char_e001.gif) N bond was always considered to be the predominant decay process in excited state.24,43 With the addition of Zn2+, the emission intensity dramatically increased associated with a red shift from 464 nm to 513 nm. When the amount of Zn2+ reached 1 equivalent, the fluorescence intensity achieved its maximum with a high quantum yield (Φ = 0.220) which is 27-fold larger than that of 1o. At the same time, the fluorescent color apparently changed from blue to bright green, which was coincident with the changes in the fluorescence spectra. The formation of complex 1o–Zn2+ should be responsible for these phenomena. By combining with Zn2+, the C
N bond was always considered to be the predominant decay process in excited state.24,43 With the addition of Zn2+, the emission intensity dramatically increased associated with a red shift from 464 nm to 513 nm. When the amount of Zn2+ reached 1 equivalent, the fluorescence intensity achieved its maximum with a high quantum yield (Φ = 0.220) which is 27-fold larger than that of 1o. At the same time, the fluorescent color apparently changed from blue to bright green, which was coincident with the changes in the fluorescence spectra. The formation of complex 1o–Zn2+ should be responsible for these phenomena. By combining with Zn2+, the C![[double bond, length as m-dash]](https://www.rsc.org/images/entities/char_e001.gif) N isomerization was suppressed, and the increased rigidity of the molecule leaded to chelation enhanced fluorescence (CHEF), thereby realizing the fluorescence enhancement of complex 1o–Zn2+.44–47
N isomerization was suppressed, and the increased rigidity of the molecule leaded to chelation enhanced fluorescence (CHEF), thereby realizing the fluorescence enhancement of complex 1o–Zn2+.44–47
Noteworthily, because of the inhibition of C![[double bond, length as m-dash]](https://www.rsc.org/images/entities/char_e001.gif) N isomerization, the chelate 1o–Zn2+ showed prominent fluorescence switch performance by UV-Vis light irradiation (Fig. 3b) as compared with the probe 1o (Fig. 1b). Upon irradiation with 297 nm light, the emission peak gradually decreased due to the formation of closed-ring isomer 1c–Zn2+.42 The fluorescent color changed from bright green to dark green in the wake of the fluorescence intensity reached the minimum. Relatively, the fluorescence spectrum of 1c–Zn2+ recovered to its initial state of 1o–Zn2+ upon irradiation with visible light (λ > 500 nm). The fluorescence spectral responses among closed-ring isomer 1c and Zn2+ were further studied as shown in Fig. 3c. With the addition of Zn2+ (0–1 equiv.), the emission intensity was obviously enhanced accompanied by a red shift from 464 nm to 513 nm. The C
N isomerization, the chelate 1o–Zn2+ showed prominent fluorescence switch performance by UV-Vis light irradiation (Fig. 3b) as compared with the probe 1o (Fig. 1b). Upon irradiation with 297 nm light, the emission peak gradually decreased due to the formation of closed-ring isomer 1c–Zn2+.42 The fluorescent color changed from bright green to dark green in the wake of the fluorescence intensity reached the minimum. Relatively, the fluorescence spectrum of 1c–Zn2+ recovered to its initial state of 1o–Zn2+ upon irradiation with visible light (λ > 500 nm). The fluorescence spectral responses among closed-ring isomer 1c and Zn2+ were further studied as shown in Fig. 3c. With the addition of Zn2+ (0–1 equiv.), the emission intensity was obviously enhanced accompanied by a red shift from 464 nm to 513 nm. The C![[double bond, length as m-dash]](https://www.rsc.org/images/entities/char_e001.gif) N isomerization was prohibited through the interaction between 1c and Zn2+, indicating that Zn2+ induced fluorescence turn-on behavior. When the amount of Zn2+ reached 1 equivalent, the fluorescence intensity reached its maximum (Φ = 0.030), and meanwhile, the fluorescent color changed from darkness to dark green.
N isomerization was prohibited through the interaction between 1c and Zn2+, indicating that Zn2+ induced fluorescence turn-on behavior. When the amount of Zn2+ reached 1 equivalent, the fluorescence intensity reached its maximum (Φ = 0.030), and meanwhile, the fluorescent color changed from darkness to dark green.
To get a further insight into the binding mode of complex 1o–Zn2+, the Job's plot analysis experiment was implemented by the fluorescence titration in THF solution, which distinctly shows a 1![[thin space (1/6-em)]](https://www.rsc.org/images/entities/char_2009.gif) :
:![[thin space (1/6-em)]](https://www.rsc.org/images/entities/char_2009.gif) 1 stoichiometry between Zn2+ and 1o (Fig. S5†). The association constant (Ka) for the complex 1o–Zn2+ was determined by the corresponding fluorescence titration data in 1
1 stoichiometry between Zn2+ and 1o (Fig. S5†). The association constant (Ka) for the complex 1o–Zn2+ was determined by the corresponding fluorescence titration data in 1![[thin space (1/6-em)]](https://www.rsc.org/images/entities/char_2009.gif) :
:![[thin space (1/6-em)]](https://www.rsc.org/images/entities/char_2009.gif) 1 binding equation as 2.27 × 10⁴ M−1 (Fig. S6†). Besides, the detection limit (LOD) of 1o to Zn2+ was evaluated to be 8.10 × 10⁻⁸ M based on LOD = 3σ/s, where “σ” is the standard deviation of blank sample, and “s” is the slope between the fluorescence intensity versus Zn2+ concentration (Fig. S7†).48 Mass spectrum and 1H NMR spectra were utilized to further verify the binding fashion of receptor 1o toward Zn2+. The peak located at m/z = 950.4967 was coincided well with the ensemble [1o + Zn2+ + 2NO3− − H+]−, proving the existence of complex 1o–Zn2+ with a 1
1 binding equation as 2.27 × 10⁴ M−1 (Fig. S6†). Besides, the detection limit (LOD) of 1o to Zn2+ was evaluated to be 8.10 × 10⁻⁸ M based on LOD = 3σ/s, where “σ” is the standard deviation of blank sample, and “s” is the slope between the fluorescence intensity versus Zn2+ concentration (Fig. S7†).48 Mass spectrum and 1H NMR spectra were utilized to further verify the binding fashion of receptor 1o toward Zn2+. The peak located at m/z = 950.4967 was coincided well with the ensemble [1o + Zn2+ + 2NO3− − H+]−, proving the existence of complex 1o–Zn2+ with a 1![[thin space (1/6-em)]](https://www.rsc.org/images/entities/char_2009.gif) :
:![[thin space (1/6-em)]](https://www.rsc.org/images/entities/char_2009.gif) 1 stoichiometry (Fig. S8†). Fig. 4 shows the 1H NMR spectra changes upon the addition of Zn2+ to the DMSO-d6 solution of 1o. As can be seen that the signal of the –NH proton at 12.087 ppm became broad and moved slightly toward the low field region in the presence of 1 equivalent of Zn2+. Besides, the signal intensity at 8.490 ppm belonging to –N
1 stoichiometry (Fig. S8†). Fig. 4 shows the 1H NMR spectra changes upon the addition of Zn2+ to the DMSO-d6 solution of 1o. As can be seen that the signal of the –NH proton at 12.087 ppm became broad and moved slightly toward the low field region in the presence of 1 equivalent of Zn2+. Besides, the signal intensity at 8.490 ppm belonging to –N![[double bond, length as m-dash]](https://www.rsc.org/images/entities/char_e001.gif) CH proton was slightly weaker. In view of above mentioned changes, we proposed the complexation between receptor 1o and Zn2+ was achieved through two oxygen atoms of the carbonyl groups (C
CH proton was slightly weaker. In view of above mentioned changes, we proposed the complexation between receptor 1o and Zn2+ was achieved through two oxygen atoms of the carbonyl groups (C![[double bond, length as m-dash]](https://www.rsc.org/images/entities/char_e001.gif) O) as well as one nitrogen of the imine nitrogen group (–CH
O) as well as one nitrogen of the imine nitrogen group (–CH![[double bond, length as m-dash]](https://www.rsc.org/images/entities/char_e001.gif) N) as demonstrated in Fig. 4.
N) as demonstrated in Fig. 4.
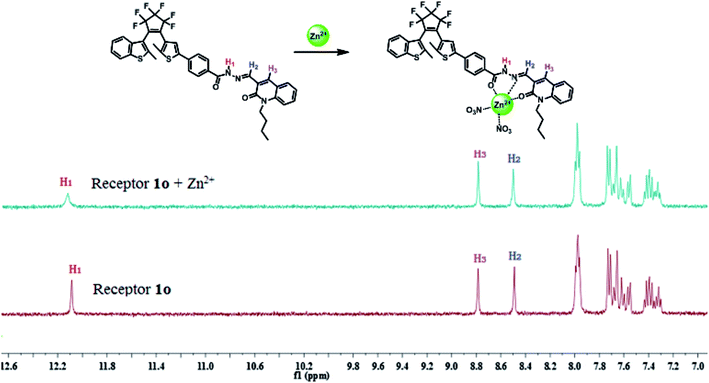 | ||
| Fig. 4 1H NMR (DMSO-d6, 400 MHz) spectra changes of receptor 1o in the presence of 1 equivalent of Zn2+. | ||
The fluorescence selectivity of 1o (20 μM in THF) toward different metal ions was investigated as shown in Fig. 5. Receptor 1o showed very weak fluorescence intensity upon excitation at 380 nm. After adding a variety of metal ions (Cu2+, Zn2+, Cd2+, Fe3+, Pb2+, Ca2+, Co2+, Cr3+, Ni2+, Mg2+, Sr2+, Al3+, K+, Ba2+, Mn2+ and Hg2+, 1 equiv. each), only Zn2+ caused a prominent fluorescence enhancement centered at 513 nm, indicating an efficient fluorescence turn-on behavior. Besides, it is imperative to note that the recognition of 1o toward Zn2+ was not subject to any interference from Cd2+. Fig. 5b shows the fluorescent photos of 1o upon addition of various metal ions in THF solution. The fluorescent color of 1o–Zn2+ was obviously bright green, indicating that sensor 1o could be used for detecting Zn2+ with high selectivity.
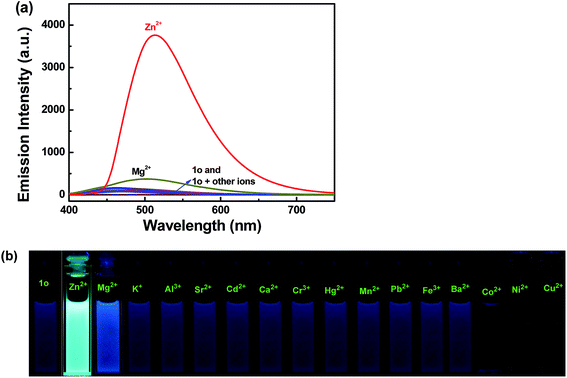 | ||
| Fig. 5 Upon addition various metal ions to 1o (20 μM in THF): (a) fluorescence emission spectra, (b) fluorescent photos. | ||
4. Logic gate research
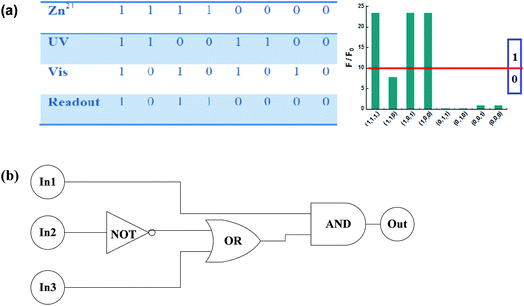
As mentioned above, sensor 1o (20 μM in THF) exhibited significant fluorescence turn-on response upon the addition of Zn2+, and then can be further adjusted by UV-Vis light irradiation. The selective fluorescence “on–off” conversion of receptor 1o stimulated by Zn2+ and UV-Vis light inspired us to investigate its feasible application in the field of logic gate (Fig. 6). In this research, the fluorescence intensity of 1o was regarded as the initial value, and only if the emission intensity was 10-fold larger than the initial value, the output signal was considered “on” (readout “1”). Thus, the signal turn-on behavior occurred only when Zn2+ was chelated with the open ring isomer 1o. In all other input combinations, the output signal remained in “off” state (readout “0”).5. Conclusion
In summary, a new photochromic fluorescent probe 1o was synthesized for the first time. As a diarylethene derivative, probe 1o not only revealed splendid photochromic properties, but also exhibited superb fluorescence selectivity and high sensitivity toward Zn2+. Upon excitation at 380 nm, only Zn2+ induced significant fluorescence enhancement with 27-fold fluorescent intensity increase, and simultaneously, the fluorescent color of 1o obviously changed from blue to bright green. Noteworthily, the selective fluorescence turn-on behavior caused by Zn2+ had no interference from Cd2+. The detection limit was as low as 8.10 × 10⁻⁸ M. This fluorescence enhancement was ascribed to the inhibition of C![[double bond, length as m-dash]](https://www.rsc.org/images/entities/char_e001.gif) N isomerization and CHEF between receptor 1o and Zn2+. In addition, the logic gate study was established based on the fluorescence intensity of 1o could be modulated by Zn2+, UV and visible light.
N isomerization and CHEF between receptor 1o and Zn2+. In addition, the logic gate study was established based on the fluorescence intensity of 1o could be modulated by Zn2+, UV and visible light.
Conflicts of interest
There are no conflicts to declare.Acknowledgements
The authors are grateful for the financial support from the National Natural Science Foundation of China (51373072, 21363009), the Project of Jiangxi Advantage Sci-Tech Innovative Team (20142BCB24012), the Young scientist training program of Jiangxi (20153BCB23008), the Science Funds of Natural Science Foundation of Jiangxi Province (20171BAB203014, 20171BAB203011), the JXSTNU Sci-Tech innovation team (2015CXTD002) and the Jiangxi Province graduate students innovative special funds (YC2016-S411).References
- J. M. Berg and Y. G. Shi, Science, 1996, 271, 1081–1085 CAS.
- X. Y. Zhou, B. R. Yu, Y. L. Guo, X. L. Tang, H. H. Zhang and W. S. Liu, Inorg. Chem., 2010, 49, 4002–4007 CrossRef CAS PubMed.
- C. F. Walker and R. E. Black, Annu. Rev. Nutr., 2004, 24, 255–275 CrossRef CAS PubMed.
- A. Takeda and H. Tamano, BioMetals, 2016, 29, 177–185 CrossRef CAS PubMed.
- C. J. Frederickson, J. Y. Koh and A. I. Bush, Nat. Rev. Neurosci., 2005, 6, 449–462 CrossRef CAS PubMed.
- R. A. Colvin, A. I. Bush, I. Volitakis, C. P. Fontaine, D. Thomas, K. Kikuchi and W. R. Holmes, Am. J. Physiol.: Cell Physiol., 2008, 294, 726–742 CrossRef PubMed.
- X. X. Chien, S. Zafra-Stone, M. Bagchi and D. Bagchi, BioFactors, 2006, 27, 231–244 CrossRef CAS PubMed.
- M. Shyamal, P. Mazumdar, S. Maity, S. Samanta, G. P. Sahoo and A. Misra, ACS Sens., 2016, 1, 739–747 CrossRef CAS.
- M. L. Zastrow, R. J. Radford, W. Chyan, C. T. Anderson, D. Y. Zhang, A. Loas and S. J. Lippard, ACS Sens., 2016, 1, 32–39 CrossRef CAS PubMed.
- X. Zhou, P. Li, Z. Shi, X. Tang, C. Chen and W. Liu, Inorg. Chem., 2012, 51, 9226–9231 CrossRef CAS PubMed.
- B. Sandström, Analyst, 1995, 120, 913–915 RSC.
- G. J. Fosmire, Am. J. Clin. Nutr., 1990, 51, 225–227 CAS.
- L. C. Costello, Y. Y. Liu, J. Zou and R. B. Franklin, J. Biol. Chem., 1999, 274, 17499–17504 CrossRef CAS PubMed.
- D. Noy, I. Solomonov, O. Sinkevich, T. Arad, K. Kjaer and I. Sagi, J. Am. Chem. Soc., 2008, 130, 1376–1383 CrossRef CAS PubMed.
- J. Chen and K. C. Teo, Anal. Chim. Acta, 2001, 450, 215–222 CrossRef CAS.
- J. S. Becker, A. Matusch, C. Depboylu, J. Dobrowolska and M. Zoriy, Anal. Chem., 2007, 79, 6074–6080 CrossRef CAS PubMed.
- K. T. Kim, W. Heo, T. Joo and B. H. Kim, Org. Biomol. Chem., 2015, 13, 8470–8478 CAS.
- J. Wu, W. Liu, J. Ge, H. Zhang and P. Wang, Chem. Soc. Rev., 2011, 40, 3483–3495 RSC.
- Z. Guo, S. Park, J. Yoon and I. Shin, Chem. Soc. Rev., 2014, 43, 16–29 RSC.
- H. Liu, X. Wan, T. Liu, Y. Li and Y. Yao, Sens. Actuators, B, 2014, 200, 191–197 CrossRef CAS.
- Y. H. Lau, P. J. Rutledge, M. Watkinson and M. H. Todd, Chem. Soc. Rev., 2011, 40, 2848–2866 RSC.
- W. K. Dong, X. L. Li, L. Wang, Y. Zhang and Y. J. Ding, Sens. Actuators, B, 2016, 229, 370–378 CrossRef CAS.
- J. S. Wu, W. M. Liu, X. Q. Zhuang, F. Wang, P. F. Wang, S. L. Tao, X. H. Zhang, S. K. Wu and S. T. Lee, Org. Lett., 2007, 9, 33–36 CrossRef CAS PubMed.
- M. Kumar, A. Kumar, M. K. Singh, S. K. Sahu and R. P. John, Sens. Actuators, B, 2017, 241, 1218–1223 CrossRef CAS.
- K. Gopaul, S. A. Shintre and N. A. Koorbanally, Anti-Cancer Agents Med. Chem., 2015, 15, 631–646 CrossRef CAS PubMed.
- S. Bawa, S. Kumar, S. Drabu and R. Kumar, J. Pharm. BioAllied Sci., 2010, 2, 64–71 CrossRef CAS PubMed.
- W. F. Lo, Y. W. Chou, C. H. Tseng, Y. H. Shiu, Y. W. Chen, S. C. Yang, Y. L. Chen, M. F. Lin and C. C. Tzeng, Anti-Cancer Agents Med. Chem., 2015, 15, 493–500 CrossRef CAS PubMed.
- J. J. Du, J. L. Fan, X. J. Peng, H. L. Li and S. G. Sun, Sens. Actuators, B, 2010, 144, 337–341 CrossRef CAS.
- H. C. Ding, G. Liu, S. Z. Pu and C. H. Zheng, Dyes Pigm., 2014, 103, 82–88 CrossRef CAS.
- S. Heng, C. A. McDevitt, D. B. Stubing, J. J. Whittall, J. G. Thompson, T. K. Engler, A. D. Abell and T. M. Monro, Biomacromolecules, 2013, 14, 3376–3379 CrossRef CAS PubMed.
- X. X. Zhang, R. J. Wang, C. B. Fan, G. Liu and S. Z. Pu, Dyes Pigm., 2017, 139, 208–217 CrossRef CAS.
- Y. L. Fu, C. B. Fan, G. Liu and S. Z. Pu, Sens. Actuators, B, 2017, 239, 295–303 CrossRef CAS.
- S. Z. Pu, Q. Sun, C. B. Fan, R. J. Wang and G. Liu, J. Mater. Chem. C, 2016, 4, 3075–3093 RSC.
- S. Z. Pu, H. C. Ding, G. Liu, C. H. Zheng and H. Y. Xu, J. Phys. Chem. C, 2014, 118, 7010–7017 CAS.
- G. Li, D. B. Zhang, G. Liu and S. Z. Pu, Tetrahedron Lett., 2016, 57, 5205–5210 CrossRef CAS.
- Z. Y. Tian, S. Q. Cui, G. Liu, R. J. Wang and S. Z. Pu, J. Phys. Org. Chem., 2016, 29, 421–429 CrossRef CAS.
- E. M. Nolan, J. W. Ryu, J. Jaworski, R. P. Feazell, M. Sheng and S. J. Lippard, J. Am. Chem. Soc., 2006, 128, 15517–15528 CrossRef CAS PubMed.
- J. Mao, L. Wang, W. Dou, X. Tang, Y. Yan and W. Liu, Org. Lett., 2007, 9, 4567–4570 CrossRef CAS PubMed.
- X. Li, G. Liu and S. Z. Pu, J. Phys. Org. Chem., 2014, 27, 764–769 CrossRef CAS.
- E. J. Song, H. Kim, I. H. Hwang, K. B. Kim, A. R. Kim, I. Noh and C. Kim, Sens. Actuators, B, 2014, 195, 36–43 CrossRef CAS.
- C. B. Fan, S. Z. Pu and G. Liu, Dyes Pigm., 2015, 113, 61–69 CrossRef CAS.
- T. Fukaminato, T. Doi, N. Tamaoki, K. Okuno, Y. Ishibashi, H. Miyasaka and M. Irie, J. Am. Chem. Soc., 2011, 133, 4984–4990 CrossRef CAS PubMed.
- K. K. Upadhyay and A. Kumar, Org. Biomol. Chem., 2010, 8, 4892–4897 CAS.
- Z. Liu, C. N. Peng, Y. Wang, M. S. Pei and G. Y. Zhang, Org. Biomol. Chem., 2016, 14, 4260–4266 CAS.
- Y. L. Fu, Y. Y. Tu, C. B. Fan, C. H. Zheng, G. Liu and S. Z. Pu, New J. Chem., 2016, 40, 8579–8586 RSC.
- S. Q. Cui, Y. J. Tang, R. M. Lu and S. Z. Pu, RSC Adv., 2016, 6, 107475–107482 RSC.
- G. J. Park, Y. J. Na, H. Y. Jo, S. A. Lee, A. R. Kim, I. Noh and C. Kim, New J. Chem., 2014, 38, 2587–2594 RSC.
- L. Zhou, Y. Lin, Z. Huang, J. Ren and X. Qu, Chem. Commun., 2012, 48, 1147–1149 RSC.
Footnote |
| † Electronic supplementary information (ESI) available. See DOI: 10.1039/c7ra09966e |
| This journal is © The Royal Society of Chemistry 2017 |


