 Open Access Article
para-Aramid fiber modified by melamine polyphosphate and its flame retardancy on thermoplastic polyurethane elastomer
Xilei Chen ,
Wenduo Wang and
Chuanmei Jiao*
College of Environment and Safety Engineering, Qingdao University of Science and Technology, Qingdao, Shandong 266042, P. R. China. E-mail: jiaochm@qust.edu.cn; Fax: +86-532-84022703; Tel: +86-532-84022703
First published on 17th November 2017
Abstract
With the increasing applications of thermoplastic polyurethane elastomer (TPU), the fire risk and smoke hazard caused by TPU have aroused wide attention. At the same time, with the promotion of aramid fiber in industry, the waste and pollution caused by aramid fiber is becoming worse. Herein, para-aramid fiber (AF) is recycled and modified by melamine polyphosphate (MP), and then applied as a flame retardant for TPU. The flame retardant and smoke suppression properties of the TPU composites are determined using the limiting oxygen index (LOI), cone calorimeter test (CCT), smoke density test (SDT) and thermogravimetric/Fourier transform infrared spectroscopy (TG-IR). The LOI test shows that the thermal stability of TPU is further improved by AF-MP. The CCT test shows that AF-MP has a better flame retardant and smoke suppression effect on TPU than pure AF. Remarkably, the pHRR and THR value for the sample with 1.00 wt% content of AF-MP decreased by 38.1% and 24.5% compared with that of the pure AF sample, where the residual mass of AF-MP was more than that of the AF sample. The SDT test shows that AF-MP has a better smoke suppression property in TPU than pure AF, particularly in the absence of a flame. The TG-IR test reveals that AF-MP further promotes the char forming process during combustion. Thus, this investigation presents great insight into the study of reusing fibers and efficient flame retardant polymers.
1. Introduction
TPU is widely used in many fields due to its excellent high tension, high tensile strength, toughness, resistance to aging properties, etc.1,2 However, similar to many other thermoplastics, due to its high flammability and the large amount of high-temperature toxic smoke released during its combustion, TPU has caused great pollution and harm to the environment.3–5 As a result, its applications in many fields are greatly limited. Therefore, the applications of effective flame retardants in TPU are quite important and urgent.6,7Aramid fiber is a new type of high-tech synthetic fiber with excellent mechanical properties (ultra-high strength, high modulus, high temperature resistance, acid and alkali resistance, light weight, insulation, aging resistance, long life cycle, etc.), and with the gradual understanding of aramid fiber, it has been widely applied in many fields.8–10 At the same time, the waste and pollution caused by aramid fiber is becoming worse. Thus, the rational utilization and recycling of aramid fiber are necessary and significant.11
Aramid fiber is divided into meta-aramid fiber and para-aramid fiber. The main difference between these two types of aramid fibers is the position where the amide bonds with the C atom on the benzene ring.12,13 para-Aramid fiber has better resistance to high temperature and other superior properties than that of meta-aramid fiber. Zhang Chong-geng et al. prepared a flame retardant using a halogen antimony flame retardant and aramid fiber to make an insulting layer in NBR, and the best formula ratio was obtained by testing different contents of halogen antimony flame retardant and aramid fiber.14 Zeng Cui-xia et al. made a blended flame retardant fabric by mixing aramid fiber and other natural fibers (cotton, wool, etc.) in a certain proportion.15 Their research showed that the LOI increased and the mass loss of the blended flame retardant fabric decreased with an increase in the content of aramid fiber. In the field of polymer flame retardants, Chen Xi-lei et al. studied the fire safety of para-aramid fiber in TPU, and their results showed that para-aramid fiber could improve the flame retardancy and smoke suppression property of TPU considerably.16 This has opened a new field for the application of aramid fiber. However, there are some disadvantages with the use of aramid fiber. Aramid fiber is a material that is composed of highly oriented crystalline microregions with some defects and voids. Due to the steric effect of the large benzene ring in its molecular chain, it is difficult for the amide group to react with other atoms or groups. Thus, aramid fiber has poor adhesion with matrices because of its chemical inertia.17,18 In this case, some measures must be taken to reduce the surface orientation or increase the number of active groups on its surface. Only in this way can the bonding strength of the composite can be improved by forming reactive covalent bonds between its groups and the matrix. The methods for the modification of aramid fiber can be divided into groups: physical modification and chemical modification. Both methods achieve the same goal by forming some active center on the fiber surface and then enhancing the interaction between the fiber and matrix.19–21 In previous work, aramid fiber was modified by phosphoric acid and applied as a flame retardant in TPU, and the results showed that the modified aramid fiber had better flame retardancy that pure aramid fiber in TPU.11
As an intumescent flame retardant (IFR), MP not only can be used alone as a flame retardant, but also be used in combination with other flame retardants.22–24 Particularly, MP shows better flame retardancy in the coating field than ammonium polyphosphate (APP).25,26 Mo Xian-zhong et al. studied the preparation of MP and its application in intumescent fire retardant coatings, and their results showed that MP could significantly improve the thermal insulation performance of fire retardant coatings.27 It was also reported that MP had been used as a reinforcing agent with glass fiber to investigate the flame retardancy in PA66, and the results showed that MP could apparently improve the flame retardancy of glass fiber in PA66.25,28,29 Li Hong-xia et al. studied the synergistic flame retardant effect between diethyl phosphate aluminium, MP and zinc borate in TPU, and their results showed that it could promote the char forming process and improve the flame retardancy of TPU.30 In a previous work, AF was modified by phosphoric acid and then added in TPU. Serious tests were carried out and the TPU composites containing modified AF showed better flame retardancy than the TPU with pure AF.11 In this case, another idea can be proposed that there should be better flame retardancy in TPU when AF is modified by MP.
Herein, recycled para-aramid fiber (AF) is modified by MP, and TPU composites are prepared by mixing AF-MP into TPU via a melt blending method. A series of tests are conducted to study the flame retardant and smoke suppression effect of AF-MP on TPU. Subsequently, the flame retardant performance, smoke suppression effect and thermal stability of the samples are characterized via CCT, SDT and TG-IR respectively.
2. Experimental
2.1. Materials
TPU (9380A) was produced by Bayer, German. The basic properties of TPU are as follows: density: 1.11 g cm−3 (ISO1183); hardness: 82A (ISO868); tensile strength: 40 MPa (ISO527-1, -3) and elongation at break: 500% (ISO527-1, -3). para-Aramid fiber (XGPF1203) was supplied by Xiangu High-Tech. Co., Ltd. (Shenzhen, China). The basic properties of AF are as follows: density: 1.470 g cm−3 (ISO1183); short cut fiber length: 3 mm; filament diameter: 12 μm; elastic modulus: 80–120 GPa (ISO527-2) and fracture strength: 19.4–21 cN per dtex (ISO6383-1). Analytical reagent grade MP was obtained commercially.2.2. Sample preparation
AF was added to washing liquid at a temperature of 95 °C for 2 h to remove grease, dirt and other impurities from the fiber surface. The washing liquid contained a mass concentration of 2 g L−1 sodium carbonate and 1 g L−1 twelve sodium alkyl sulfonate, and the liquor ratio was 1![[thin space (1/6-em)]](https://www.rsc.org/images/entities/char_2009.gif) :
:![[thin space (1/6-em)]](https://www.rsc.org/images/entities/char_2009.gif) 50. Finally, AF was washed with distilled water at a temperature of 50–60 °C to neutral and then dried in a drying oven.
50. Finally, AF was washed with distilled water at a temperature of 50–60 °C to neutral and then dried in a drying oven.
The pre-treated AF was soaked in a saturated solution of MP with a 1![[thin space (1/6-em)]](https://www.rsc.org/images/entities/char_2009.gif) :
:![[thin space (1/6-em)]](https://www.rsc.org/images/entities/char_2009.gif) 20 liquor ratio at 80 °C, and kept stirring until the solution cooled to room temperature. Then, AF was filtered and dried in a drying oven at a temperature of 130 °C for 10 min. The above processes were repeated 2 times. Finally, AF was washed with distilled water at a temperature of 50–60 °C to neutral, and AF-MP was obtained after drying in a drying oven.
20 liquor ratio at 80 °C, and kept stirring until the solution cooled to room temperature. Then, AF was filtered and dried in a drying oven at a temperature of 130 °C for 10 min. The above processes were repeated 2 times. Finally, AF was washed with distilled water at a temperature of 50–60 °C to neutral, and AF-MP was obtained after drying in a drying oven.
The TPU composites were prepared via a melt blending method. TPU was dried in a vacuum oven at 80 °C for 12 h and then placed into a mixer and mixed at a rotation speed of 30 rpm for 3 min at a temperature of 175 ± 5 °C. Then, AF-MP was added to the mixer and mixed for about 10 min to blend the polymer composites homogenously. Finally, the TPU composites were moulded with dimensions of 100 × 100 × 3 mm3 using a plate vulcanizer at a temperature of 175 ± 5 °C. The formulations of TPU composites are presented in Table 1.
| Sample code | TPU/% | AF/% | AF-P/% |
|---|---|---|---|
| TPU | 100 | 0 | 0 |
| AF | 99.000 | 1.000 | 0 |
| AF-MP-1 | 99.750 | 0 | 0.250 |
| AF-MP-2 | 99.500 | 0 | 0.500 |
| AF-MP-3 | 99.000 | 0 | 1.000 |
2.3. Measurements
Analysis of the components of the pyrolysis gas from the TG analyzer was performed using an FTIR spectrometer (170SX) (Shimadzu, Japan) in the wavenumber range of 4000–400 cm−1.
3. Results and discussion
3.1. Scanning electron microscopy (SEM) and energy dispersive spectrometry (EDS)
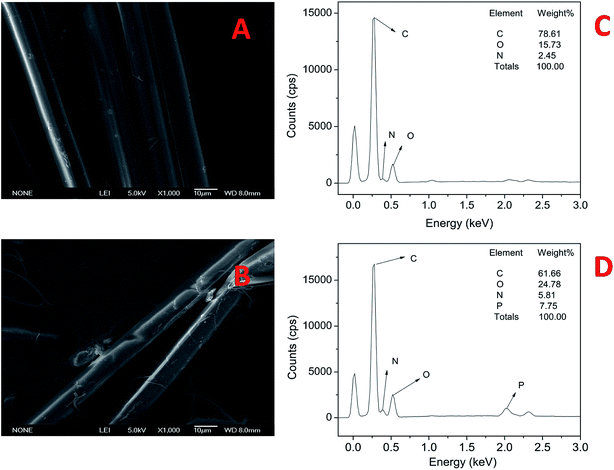
The SEM-EDS pictures of AF and AF-MP are shown in Fig. 1, which display the surface characteristics at the 10 μm scale. Fig. 1(A) and (B) show the surface characteristics of AF and AF-MP, and Fig. 1(C) and (D) show the elemental distribution in AF and AF-MP. It could be seen from Fig. 1(A) that there is no obvious twining between these fibers, and they are smooth and highly oriented and distributed regularly. In contrast, it could be seen in Fig. 1(B) that the fibers are rougher than pure AF, and they are curved and disorganized. This is because the physical characteristics of AF were changed by MP.Moreover, it could be seen from Fig. 1(C) that C and O are the main elements in AF, and there is a little amount of N element. Compared with Fig. 1(C), it could be seen from Fig. 1(D) that P element and more N element exist in AF-MP. The weight ratio of P was 7.75 wt% and that of N was up to 5.81%, which indicates that MP changed the chemical composition of AF, and the group containing P element and N element was coupled to the surface of AF successfully.
3.2. Limiting oxygen index (LOI)
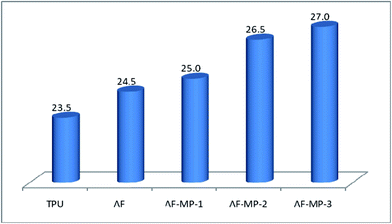
LOI is defined as the minimum percentage of oxygen in an oxygen–nitrogen mixture that is just sufficient to sustain combustion of the sample after ignition. Higher LOI values make polymers more difficult to burn. The LOI test is widely used to evaluate the thermal stability properties of polymer materials, particularly for screening flame retardant formulations of polymers.2 The LOI results obtained from the TPU composites are presented in Fig. 2. It could be seen obviously that the LOI of TPU is 23.5, and that of AF is 24.5, which is slightly higher than that of pure TPU. However, the LOIs of AF-MP-1, AF-MP-2 and AF-MP-3 are 25.0, 26.5 and 27, respectively, which are much higher than those of TPU.Thus, it could be concluded that AF modified by MP has better flame retardancy in TPU than AF. This is mainly because TPU and AF have the same amide bond and hydrogen bond, and AF can form a large conjugated aromatic structure with TPU.16 It is known that aramid fiber has strong resistance to heat. Thus, the addition of AF increased the viscosity and strength of TPU.31 In this case, when the TPU/AF composites were heated in CCT, the thermal stability of TPU increased, and as a result its LOI increased. Furthermore, as an important intumescent flame retardant (IFR), MP could hydrolyse at low temperature to release some polyphosphoric acid compounds and non-flammable gases, which could reduce the temperature of the polymer and dilute the oxygen concentration. In this way, the LOIs of the AF-MP samples were further improved.
3.3. Cone calorimeter test (CCT)
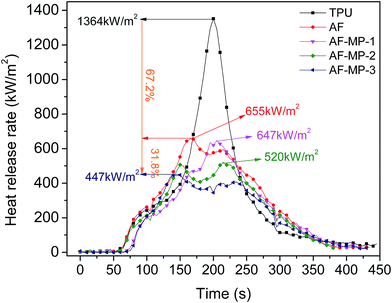
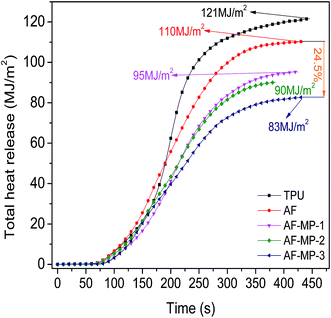
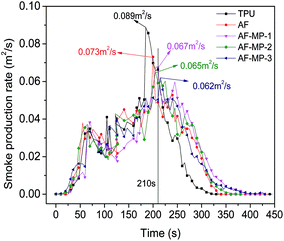
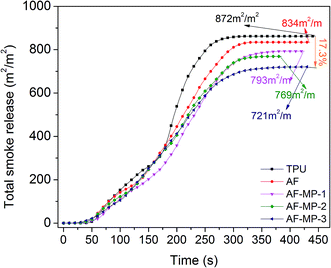
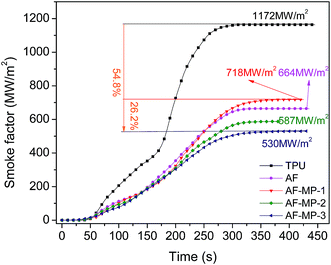
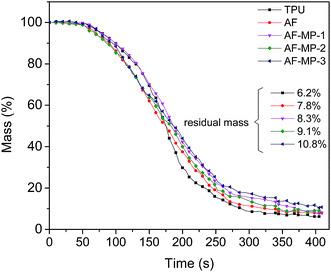
The cone calorimeter test (CCT) is based on the principle of oxygen consumption. It truly simulates the combustion of polymers in a real fire situation, and thus has great significance in the field of flame retardant materials. Some characteristic CCT data are shown in Table 2.| Sample code | pHRR (kW m−2) | Mass (%) | THR (MJ m−2) | TSR (m2 m−2) | pSPR (m2 s−1) | SF (MW m−2) |
|---|---|---|---|---|---|---|
| TPU | 1364 | 6.2 | 121 | 872 | 0.089 | 1172 |
| AF | 655 | 7.8 | 110 | 834 | 0.073 | 718 |
| AF-MP-1 | 647 | 8.3 | 95 | 793 | 0.067 | 664 |
| AF-MP-2 | 520 | 9.1 | 90 | 769 | 0.065 | 587 |
| AF-MP-3 | 447 | 10.8 | 83 | 721 | 0.062 | 530 |
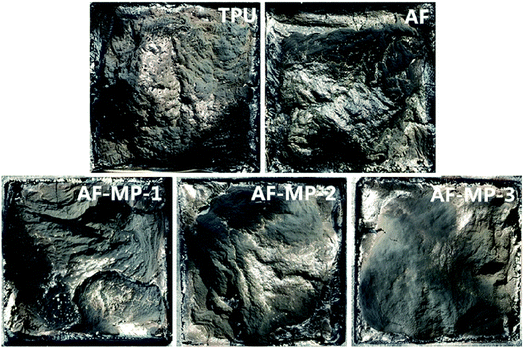
Thus, it could be concluded that AF improves the thermal stability of TPU and promotes the char forming process due to its large conjugated aromatic structure with TPU. When the samples were heated, the heat resistance of TPU was improved due to the addition of AF. Furthermore, in the process of the formation of the carbon layer, the char became more compact because of the uniform distribution of AF. As a widely applied IFR, MP further promoted the char forming process and improved the structure of the carbon layer. The P element formed some polyphosphoric acid compounds, which catalyzed the carbonization of TPU to generate a condensed carbon layer on the surface of TPU. The carbon layer acted as a barrier from heat, thus reducing the decomposition rate of the underlying materials to form flammable gases, resulting in a decrease in HRR. The N element formed some non-flammable gases, which could dilute the concentration of flammable gases and prevent the polymer from contacting air. Thus, the HRR of the AF-MP samples further decreased compared with that of AF sample, and the flame retardancy of TPU was further improved.
Therefore, it is not difficult to draw the conclusion that AF-MP plays a more important role in the char forming process than AF because AF-MP improves the structure of the carbon layer from TPU composites. As a result, the carbon layer is more compact to act as a barrier from heat and air, thus reducing the decomposition rate of the underlying materials to form flammable gases and smoke particulates, and enhancing the weight. The above results are in accordance with the HRR (Fig. 3) and TSR (Fig. 6) results.
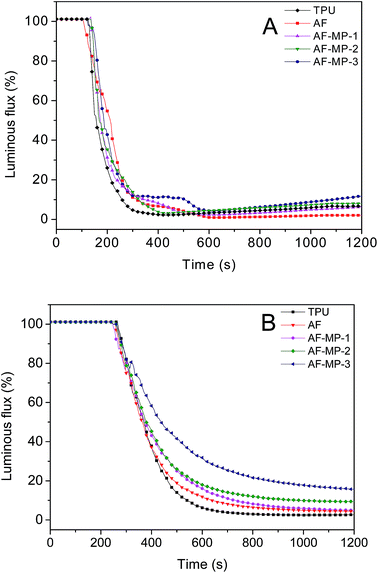
3.4. Smoke density test (SDT)
A smoke density test was carried out and the results are shown in Fig. 10. Fig. 10(A) presents the luminous flux curves of the TPU composites with flame in the SDT. It can be seen that the luminous flux of pure TPU rapidly decreased in the first 300 s and the lowest luminous flux value was obtained and it slightly increased later. However, the luminous flux of the AF sample decreased slightly slower than that of pure TPU in the first 300 s. The difference between AF and the AF-MP samples was not obvious. When AF-MP was added to TPU, the luminous flux increased after reaching the lowest luminous flux value. This is mainly because MP had changed the composition of the smoke particulates, and when the combustion finished, the particulates sank and remained stable at the bottom.Fig. 10(B) presents the luminous flux curves of the TPU composites without flame in the SDT. It can be seen that the luminous flux of TPU rapidly decreased in the first 500 s and the lowest luminous flux value (2.7%) was obtained at the end of the combustion. The luminous flux of the AF sample was close to that of pure TPU in the initial 400 s, and then decreased slowly and reached the lowest luminous flux value (4.5%) at the end of the combustion, which was a little higher than that of pure TPU. This is mainly because AF promotes the char forming process due to its large conjugated aromatic structure with TPU. However, after AF-MP was added to TPU, the luminous flux values decreased more slowly, and with an increase in the content of AF-MP, the luminous flux value increased at the end of the combustion. Remarkably, in the case of AF-MP-3, the lowest luminous flux of 15.7% was achieved, which was much higher than that of the pure TPU and AF samples. This could be explained by the fact that as an IFR, MP further improves the structure of the carbon layer. Furthermore, the carbon layer acted as a barrier from heat, which reduced the decomposition rate of the underlying materials to form smoke particulates, thus resulting in an increase in luminous flux. Thus, the luminous flux values were much higher than those of the AF sample. Therefore, it can be concluded that the smoke suppression property of TPU was further improved by AF-MP.
3.5. Thermogravimetric analysis/infrared spectrometry (TG-IR)
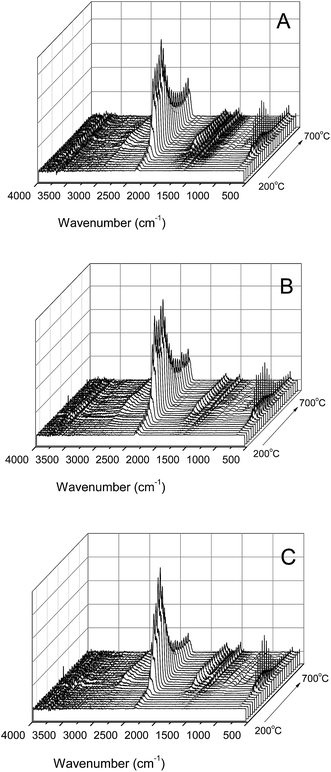
The infrared spectra from the pyrolysis of the TPU composites are presented in Fig. 11. The heating temperature range of the samples was 240–700 °C and the heating rate was 20 K min−1. It can be seen from the infrared spectra of pure TPU in Fig. 11(A) that there is a strong and broad absorption peak located at 2350 cm−1, which was formed by the cleavage of CO2. With an increase in temperature, the intensity of the absorption peak of CO2 increased gradually, reached the maximum at about 450 °C, and then began to decline gradually. When the temperature increased to 520 °C, the absorption peak of CO2 increased and remained stable, which indicates that CO2 was still being released. When the temperature increased to 340 °C, a peak located at 1750 cm−1 appeared, which was attributed to the carbonyl group (C![[double bond, length as m-dash]](https://www.rsc.org/images/entities/char_e001.gif) O) in the TPU soft segment.
O) in the TPU soft segment.
It can be seen from the infrared spectrum from the pyrolysis of the AF sample in Fig. 11(B) that the characteristic absorption peak of CO2 located at about 2350 cm−1 is much lower than that of TPU in the initial stage before 360 °C. In addition, the characteristic absorption peak of CO2 for the AF sample was close to that of TPU between 360 °C and 520 °C, but lower than that of pure TPU when the temperature increased from 520 °C to 700 °C. In addition, the C![[double bond, length as m-dash]](https://www.rsc.org/images/entities/char_e001.gif) O absorption peaks located at 1750 cm−1 for the AF sample were slightly higher than those of pure TPU.
O absorption peaks located at 1750 cm−1 for the AF sample were slightly higher than those of pure TPU.
It can be seen from the infrared spectrum from the pyrolysis of the AF-MP-3 sample in Fig. 11(C) that the characteristic absorption peak of CO2 located at about 2350 cm−1 was much lower than that of pure TPU before 360 °C, which then increased and became close to that of pure TPU. When the temperature reached about 420 °C the peak started to decrease rapidly and then remained stable, which was much lower than that of the pure TPU and AF samples. Moreover, the C![[double bond, length as m-dash]](https://www.rsc.org/images/entities/char_e001.gif) O absorption peaks located at 1750 cm−1 for the AF-P-3 sample were slightly higher than that of pure TPU and AF.
O absorption peaks located at 1750 cm−1 for the AF-P-3 sample were slightly higher than that of pure TPU and AF.
Therefore, it could be easily concluded that the thermal stability of TPU increased by the addition of AF, and thus the characteristic absorption peak of CO2 in AF was much lower than that of pure TPU at a lower temperature. In addition, with time, the CO2 absorption peak in AF was lower than that of pure TPU at about 520 °C, which is because AF promoted the char forming process due to its large conjugated aromatic structure with TPU. However, in AF-MP-3, as an IFR, MP further promoted the char forming process and improved the structure of the carbon layer. Furthermore, MP could form polyphosphoric acid compounds, which catalyze the carbonization of TPU to generate a condensed carbon layer on the surface of TPU. The formed carbon layer acted as a barrier from heat and air, reducing the decomposition rate of the underlying materials to form flammable gases and smoke particulates, and as a result less CO2 was released. This is consistent with the results obtained by CCT.
4. Conclusion
Since the fire hazard caused by TPU and the pollution caused by aramid fiber are becoming more serious, some measures must be taken to alleviate this situation. Herein, research on the flame retardancy of aramid fiber modified by MP in TPU was carried out. The results show that AF-MP has better flame retardancy and smoke suppression property on TPU than pure AF. Therefore, we provide a new strategy and method to reduce the fire hazard of TPU and the pollution of aramid fiber. This is very significant for the reuse of abandoned resources and the development of green flame retardant polymers.Conflicts of interest
There are no conflicts to declare.Acknowledgements
The authors gratefully acknowledge the National Natural Science Foundation of China (No. 51776101, 51206084), the Major Special Projects of Science and Technology from Shandong Province (2015ZDZX11011), the Natural Science Foundation of Shandong Province (ZR2017MB016), and the Project of the State Administration of Work Safety (shandong-0039-2017AQ).References
- G. Wypych, Handbook of Polymers, 2nd edn, 2016, pp. 686–689 Search PubMed.
- C. Jiao, H. Wang, S. Li and X. Chen, J. Hazard. Mater., 2017, 332, 176–184 CrossRef CAS PubMed.
- D. Tabuani, F. Bellucci, A. Terenzi and G. Camino, Polym. Degrad. Stab., 2012, 97, 2594–2601 CrossRef CAS.
- A. Toldy, G. Harakály, B. Szolnoki, E. Zimonyi and G. Marosi, Polym. Degrad. Stab., 2012, 97, 2524–2530 CrossRef CAS.
- X. Chen, W. Wang and C. Jiao, RSC Adv., 2016, 6, 92276–92284 RSC.
- U. Almeida Pinto, L. L. Y. Visconte, J. Gallo and R. C. R. Nunes, Polym. Degrad. Stab., 2000, 69, 257–260 CrossRef.
- H. Li, N. Ning, L. Zhang, Y. Wang, W. Liang and M. Tian, Polym. Degrad. Stab., 2014, 105, 86–95 CrossRef CAS.
- K. Akato, and G. Bhat, Structure and Properties of High-Performance Fibers, 2017, pp. 245–266 Search PubMed.
- J. K. Fink, High Performance Polymers, 2nd edn, 2014, pp. 301–320 Search PubMed.
- Z. Li, X. Cheng, S. He, X. Shi, L. Gong and H. Zhang, Composites, Part A, 2016, 84, 316–325 CrossRef CAS.
- X. Chen, W. Wang and C. Jiao, J. Hazard. Mater., 2017, 331, 257–264 CrossRef CAS PubMed.
- Z. Sun, S. Shi, X. Hu, X. Guo, J. Chen and H. Chen, Composites, Part B, 2015, 77, 38–45 CrossRef CAS.
- B. L. Deopura and N. V. Padaki, in Textiles and Fashion, 2015, pp. 7–114 Search PubMed.
- C. g. Zhang, H. l. Wang, Q. LI, L. Cong and X. h. Zhang, J. Solid Rocket Technol., 2008, 31, 635–637 CAS.
- C. Zeng, Shanghai Textile Science & Technology, 2008, 37, 47–48 Search PubMed.
- X. Chen, W. Wang, S. Li and C. Jiao, J. Hazard. Mater., 2017, 324, 789–796 CrossRef CAS PubMed.
- J. Chen, Y. Zhu, Q. Ni, Y. Fu and X. Fu, Appl. Surf. Sci., 2014, 321, 103–108 CrossRef CAS.
- R. Gu, J. Yu, C. Hu, L. Chen, J. Zhu and Z. Hu, Appl. Surf. Sci., 2012, 258, 10168–10174 CrossRef CAS.
- R. Sa, Y. Yan, Z. Wei, L. Zhang, W. Wang and M. Tian, ACS Appl. Mater. Interfaces, 2014, 6, 21730–21738 CAS.
- C. X. Wang, M. Du, J. C. Lv, Q. Q. Zhou, Y. Ren, G. L. Liu, D. W. Gao and L. M. Jin, Appl. Surf. Sci., 2015, 349, 333–342 CrossRef CAS.
- M. Xi, Y.-L. Li, S.-y. Shang, D.-H. Li, Y.-X. Yin and X.-Y. Dai, Surf. Coat. Technol., 2008, 202, 6029–6033 CrossRef CAS.
- X. Bai, G. Geng, S. Hu and A. Zhang, Paint Coat. Ind., 2012, 42(6), 64–66 CAS.
- C. Wang, J. Li and P. Ding, J. Anal. Appl. Pyrolysis, 2016, 119, 139–146 CrossRef CAS.
- S. Zhou, Z. Wang, Z. Gui and Y. Hu, Fire Mater., 2008, 32, 307–319 CrossRef CAS.
- U. Braun, B. Schartel, M. A. Fichera and C. Jäger, Polym. Degrad. Stab., 2007, 92, 1528–1545 CrossRef CAS.
- Y. Chen and Q. Wang, Polym. Adv. Technol., 2007, 18, 587–600 CrossRef CAS.
- X. Mo, Z. Liao and C. Gan, J. Funct. Mater., 2004, 35, 1725–1727 Search PubMed.
- Z. Wang, Y. Liu and Q. Wang, Eng. Plast. Appl., 2007, 35(3), 4–7 CAS.
- S. V. Levchik, A. I. Balabanovich, G. F. Levchik and L. Costa, Fire Mater., 1997, 21, 75–83 CrossRef CAS.
- H. Li, L. Zhang, Y. Wang, W. Liang and M. Tian, China Plast. Ind., 2014, 42(4), 76–80 CAS.
- L. Loureiro, V. Henrique Carvalho and S. H. Prado Bettini, Polym. Test., 2016, 56, 124–130 CrossRef CAS.
| This journal is © The Royal Society of Chemistry 2017 |

