 Open Access Article
Creative Commons Attribution 3.0 Unported Licence
BiOBr/BiOCl/carbon quantum dot microspheres with superior visible light-driven photocatalysis†
Chenhui Zhao *ab,
Ying Liangab,
Wei Lic,
Yi Tianab,
Xin Chenab,
Dezhong Yinab and
Qiuyu Zhang
 *ab
*ab
aDepartment of Applied Chemistry, College of Science, Northwestern Polytechnical University, Xi'an 710072, China. E-mail: zhaoch@nwpu.edu.cn; qyzhang@nwpu.edu.cn; Fax: +86-29-88431675; Tel: +86-29-88431675
bKey Laboratory of Space Physics and Chemistry, Ministry of Education, Northwestern Polytechnical University, P. O. Box 624, Xi'an 710072, China
cDepartment of Applied Chemistry, College of Chemistry and Chemical Engineering, Shaanxi University of Science & Technology, Xi'an 710021, China
First published on 14th November 2017
Abstract
In this paper, BiOBr/BiOCl/CQDs heterostructure microspheres were successfully synthesized via a facile solvothermal method. Then, the structures, morphologies, optical properties and photocatalytic performances were investigated. This research showed that the BiOBr/BiOCl/CQDs microspheres exhibited significantly enhanced photocatalytic performance compared with BiOBr/BiOCl. In the photocatalysis process of rhodamine B (RhB) under visible light irradiation, the highest photodegradation rate (0.0609 min−1) would be obtained when the weight percentage of CQDs was appropriate, which was about 2.8 times higher than that of BiOBr/BiOCl (0.0217 min−1). In this photocatalytic system, the enhanced photoactivity was mainly attributed to the heterojunction interface among CQDs, BiOBr and BiOCl, and enhanced light harvesting for the appropriate CQD introduction. The radical trapping experiments revealed that O2˙−, e− and h+ were the main active species during the photocatalysis process.
1. Introduction
Photocatalytic techniques are effective ways to solve energy and pollution problems.1 Among the emerging photocatalysts, bismuth oxyhalides BiOX (X = Cl, Br, and I) have attracted great interest due to their excellent photocatalytic activity, suitable band gaps, unique layered structure, high activity, and good electrical and optical properties.2,3 However, the photocatalytic activity of pure BiOX has been limited by the high recombination of the photogenerated electron–hole pairs, which makes it necessary to develop effective ways to change this situation.4,5 Generally, there are several ways to change this situation, which could be classified into microstructure modulation, heterologous hybridization and structural design.6 Examples of structures are BiOCl single-crystalline nanosheets,7 Bi4Ti3O12/BiOI,8 C3N4/BiOI,9 BiOCl/CuPc,10 BiOCl/TiO2,11 Fe-doped BiOBr,12 etc. Among them, BiOX/BiOY(X, Y = Cl, Br, I) composites may offer advantages compared to other BiOX-based composites. For example, a stable heterojunction structure can be formed between BiOX and BiOY. In addition, the optical properties of BiOX/BiOY can easily be modulated by changing the composition of BiOX and BiOY.13,14Carbon quantum dots (CQDs), a group of newly emerged carbonic nanomaterials, are typically quasi-spherical nanoparticles comprising amorphous to nanocrystalline cores with predominantly graphitic carbon (sp2 carbon) or graphene and graphene oxide sheets fused by diamond-like sp3 hybridized carbon insertions.15,16 The conjugated π structure of CQDs give it excellent electron transfer/reservoir properties.3,4,16 Besides, the photoluminescence (PL) up-conversion effect of CQDs can convert the long wavelength light into shorter wavelength light,17 which could expand the light utilization range of nanomaterials and enhance photo-induced electron transfer.15 Therefore, CQDs exhibit excellent photo-induced electron transfer, electron reservoir properties and good up-converted PL behavior, which could be utilized for modifying photocatalysts efficiently.18,19 Very recently, a series of CQDs-based photocatalysts have been synthesized and the enhanced activity was obtained, such as CQDs/Cu2O,20 CQDs/TiO2,8 CQDs/Bi2WO6,16 CQDs/Fe2O3,21 CQDs/Bi2MoO6,22 CQDs/Fe3O4,23 CQDs/BiOCl,24 CQDs/BiOBr.4,5,25
Herein, considering the superiorities of BiOX/BiOY and CQDs mentioned before, we report the fabrication of a novel BiOBr/BiOCl/CQDs nanocomposite photocatalyst via a facile method for the first time. The structure–activity relationships were studied in details. The photocatalysis of BiOBr/BiOCl/CQDs materials were evaluated by the photodegradation of rhodamine (RhB). Furthermore, a reasonable mechanism of pollutant photodegradation was proposed based on free radicals trapping experiments.
2. Experimental section
2.1 Photocatalyst synthesis
All chemicals were purchased from J&K Chemical and were used as received. The CQDs solid was synthetized according to the literature followed by the freeze-drying.26 The BiOBr/BiOCl/CQDs microspheres were synthesized by a facile solvothermal method. In a typical procedure, 10 mmol Bi(NO3)3·5H2O, 4 mmol KBr and 6 mmol KCl was dissolved in 80 mL of ethylene glycol by ultrasonic. Then, a certain amount of CQDs were added into above solution. After being stirred for 30 min, the solution was transferred into a 100 mL Teflon-lined stainless-steel autoclave and kept at 180 °C for 2 h. After the reaction finished, the resulting samples were collected and separated by centrifugation and washed with deionized water and absolute ethanol followed by drying via the vacuum freeze-drying technology.5,27,28 The added contents of CQDs in the BiOBr/BiOCl/CQDs materials were 1, 2, 3, 4, and 5 wt%, respectively. The as-synthesized samples were labeled as BiOBr/BiOCl/CQDs-1%, BiOBr/BiOCl/CQDs-2%, BiOBr/BiOCl/CQDs-3%, BiOBr/BiOCl/CQDs-4% and BiOBr/BiOCl/CQDs-5% corresponding to the weight percentage of CQDs.2.2 Photocatalyst characterization
X-ray power diffraction (XRD) analysis was performed on a Bruker AXS D8-advance X-ray diffractometer with Cu-Kα radiation. X-ray photoelectron spectroscopy (XPS) data was collected on an Axis Ultra instrument (Kratos Analytical, Manchester, U.K.) under ultrahigh vacuum condition (<10−6 Pa) with a monochromatic Al Kα X-ray source (1486.6 eV). Fourier transform-infrared (FT-IR) spectra were measured on a Perkin-Elmer 580BIR spectrophotometer using KBr pellet technique. Scanning electron microscopy (SEM) micrographs were observed on a JEOL-JSM-6700 F. Transmission electron microscopy (TEM) micrographs were observed on a JEOL JEM-2100F. N2 adsorption/desorption isotherms were obtained on a TriStar II 20 apparatus. UV-vis diffuse reflectance spectra (DRS) were performed on a Shimadzu UV-3600 spectrometer (BaSO4 powder as substrate). The photoluminescence (PL) spectra of BiOBr/BiOCl/CQDs materials were detected on a Varian Cary Eclipse spectrometer.2.3 Photocatalytic activity test
The photocatalytic activity of the as-prepared BiOBr/BiOCl/CQDs materials with different weight percentage of CQDs was investigated by the photodegradation of 20 mg L−1 RhB under visible light (a 300 W Xe arc lamp with a UV cutoff filter (400 nm)). In a typical process, 100 mg BiOBr/BiOCl/CQDs samples were added into 100 mL RhB. Prior to irradiation, the suspension was stirred in the dark for 30 min to ensure adsorption–desorption equilibrium. During the photodegradation process, 3 mL suspension was sampled at certain time intervals and centrifuged at 13![[thin space (1/6-em)]](https://www.rsc.org/images/entities/char_2009.gif) 000 rpm for 3 min to remove the BiOBr/BiOCl/CQDs microspheres for analysis. The concentration of RhB samples were analyzed on an UV-vis spectrophotometer (UV-2450, Shimadzu) at wavelength of 553 nm, respectively.
000 rpm for 3 min to remove the BiOBr/BiOCl/CQDs microspheres for analysis. The concentration of RhB samples were analyzed on an UV-vis spectrophotometer (UV-2450, Shimadzu) at wavelength of 553 nm, respectively.
2.4 Free radical trapping experiments
For detecting the active species during photocatalytic reactivity, hydroxyl radicals (˙OH), superoxide radicals (O2˙−), holes (h+) and electrons (e−) were investigated by adding 1.0 mM isopropyl alcohol (IPA, a quencher of ˙OH),19 1 mM p-benzoquinone (BQ, a quencher of O2˙−),16 1 mM KI (a quencher of h+)27 and 1 mM AgNO3 for e−,29 respectively. The method was similar to the former photocatalytic activity test.3. Results and discussion
3.1 Compositional and structural information
X-ray diffraction (XRD) (Fig. S1†) was performed to show the purity and crystallinity of as-prepared BiOBr/BiOCl/CQDs with different CQDs contents. The positions of all peaks can be indexed to the tetragonal BiOBr (JCPDS no. 73-2061)30 or tetragonal BiOCl (JCPDS no. 06-0249).31 The characteristic peak for CQDs at 26° is too weak to be observed.19 No extra characteristic peaks are observed, indicating that there are no impurities in as-prepared hybrid microspheres. Energy dispersed spectroscopy (EDS) (Fig. S2†) of the BiOBr/BiOCl/CQDs microspheres indicate they contain C, O, Bi, Br and Cl element. The elements of Bi, O, Br and Cl come from the BiOBr/BiOCl, and the C could be from the CQDs or adventitious carbon. Moreover, no typical diffraction peaks of CQDs were detected, which may due to the low CQDs content in the samples. Similar results had been found in other systems.24,32Furthermore, XPS spectra of BiOBr/BiOCl and BiOBr/BiOCl/CQDs microspheres were used to confirm the elements and chemical states. The XPS survey spectra (Fig. S3a†) clearly show that both of them contain Bi, O, Br, Cl and C elements. High-resolution spectra for Bi 4f are shown in Fig. S3b.† Two peaks located at 157.9 and 163.2 eV can be assigned to the Bi 4f7/2 and Bi 4f5/2 of Bi3+ in BiOBr/BiOCl, respectively. However, the Bi 4f7/2 and Bi 4f5/2 of Bi3+ in BiOBr/BiOCl/CQDs occurred red-shift compared with that in BiOBr/BiOCl, respectively, which dues to the interaction between BiOBr/BiOCl and CQDs. The Br 3d spectrum in BiOBr/BiOCl (Fig. S3c†) can be fitted into two peaks located at 67.1 and 68.3 eV, while the Br 3d peaks in BiOBr/BiOCl/CQDs material shift to 67.0 and 68.1 eV, respectively. Similarly, The Cl 2p spectrum in BiOBr/BiOCl (Fig. S3d†) can be fitted into two peaks located at 196.6 and 198.2 eV, while the Cl 2p peaks in BiOBr/BiOCl/CQDs material shift to 196.5 and 198.1 eV, respectively. The O 1s spectrum in BiOBr/BiOCl (Fig. S3e†) can be fitted into three peaks located at 528.8, 530.2 and 531.3 eV (which are attributed to O in the BiOBr and other components, such as –OH and H2O).33 However, the O 1s spectrum in BiOBr/BiOCl/CQDs shifted to 528.6, 530.1 and 531.2 eV, respectively. The C 1s spectrum in BiOBr/BiOCl (Fig. S3f†) can be assigned to adventitious carbon species from XPS measurements,34 while the C 1s spectrum in BiOBr/BiOCl/CQDs can be attributed to C–C/C![[double bond, length as m-dash]](https://www.rsc.org/images/entities/char_e001.gif) C, oxygenated carbon and nitrous carbon, respectively.26 The XPS analysis indicates that the intimate integration of CQDs and BiOBr/BiOCl has been constructed in BiOBr/BiOCl/CQDs materials.
C, oxygenated carbon and nitrous carbon, respectively.26 The XPS analysis indicates that the intimate integration of CQDs and BiOBr/BiOCl has been constructed in BiOBr/BiOCl/CQDs materials.
Fig. S4† shows the FI-IR spectra of BiOBr/BiOCl and BiOBr/BiOCl/CQDs materials with different CQDs loading amounts. The absorption peaks located at 3433 cm−1 and 2917 cm−1 can be assigned to the stretching vibrations of O–H and C–H.16 The peak at 1605 cm−1 is associated with the C![[double bond, length as m-dash]](https://www.rsc.org/images/entities/char_e001.gif) O stretching vibration32 whereas the peak at 1465 cm−1 is attributed to the absorption peaks of –COO−.35 These reveal the existence of CQDs.16,35 The peak at 514 cm−1 is associated with the Bi–O stretching mode in the BiOBr materials.3 The FT-IR result shows that CQDs and BiOBr had been successfully coupled together which is consistent with the XPS analysis.
O stretching vibration32 whereas the peak at 1465 cm−1 is attributed to the absorption peaks of –COO−.35 These reveal the existence of CQDs.16,35 The peak at 514 cm−1 is associated with the Bi–O stretching mode in the BiOBr materials.3 The FT-IR result shows that CQDs and BiOBr had been successfully coupled together which is consistent with the XPS analysis.
3.2 Morphology and microstructure analysis
To investigate the morphology and microstructure of the as-synthesized BiOBr/BiOCl and BiOBr/BiOCl/CQDs materials, the SEM characterization was carried out. Fig. 1a and b shows the SEM images of BiOBr/BiOCl. The sample exhibits the representative microsphere-like structure assembled by numerous BiOBr/BiOCl nanosheets, and the microspheres average size is about 1.5–3 μm (Fig. 1a and b). Fig. 1c and d display the SEM images of BiOBr/BiOCl/CQDs materials. Compared with BiOBr/BiOCl, a similar microsphere-like morphology with the average diameter of about 2–3 μm can be observed, which is also consists of ultrathin BiOBr/BiOCl nanosheets (Fig. 1c and d). These results imply that the introduction of CQDs does not change the main morphology of BiOBr. The EDS elemental maps (Fig. 1e–i) show that the elements including Bi, O, Br, Cl and C, which are uniformly distributed over the hybrid, demonstrating the nanoscale heterojunction was obtained between BiOBr and BiOCl architectures.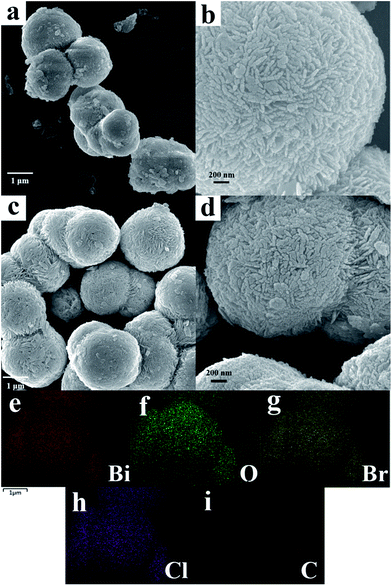 | ||
| Fig. 1 SEM images of (a, b) BiOBr/BiOCl, (c, d) BiOBr/BiOCl/CQDs-4%, and corresponding EDS elemental mapping images of Bi, O, Br, Cl, C (e–i), respectively. | ||
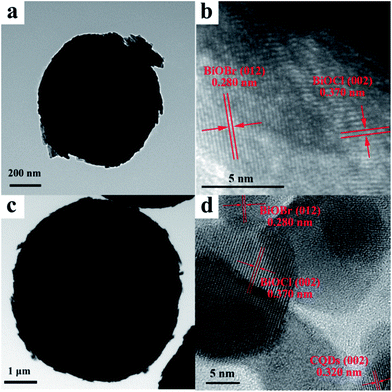
The morphologies were further investigated by TEM and HRTEM. The TEM images of pure BiOBr/BiOCl (Fig. 2a) shows that some nanosheets can be found from the edge of sphere-like structure, which also demonstrates that BiOBr/BiOCl microsphere is composed of nanosheets. High-resolution TEM (HRTEM) image of BiOBr/BiOCl (Fig. 2b) shows that the lattice fringe spacing of 0.280 nm and 0.370 nm corresponding to the (012) crystal plane of tetragonal BiOBr (JCPDS 73-2061)36 and (002) crystal plane of tetragonal BiOCl (JCPDS 06-0249) can be observed, respectively.37 Similarly, the TEM image of BiOBr/BiOCl/CQDs materials shows that some nanosheets can be found from the edge of the sphere-like structure (Fig. 2c). At the same time, the HRTEM image of the BiOBr/BiOCl/CQDs material (Fig. S5†) shows that there are a lot of dark dots with the diameter of about 5 nm evenly attached to the surface of BiOBr/BiOCl nanosheets, which implies that the CQDs have been successfully anchored on the BiOBr nanosheets and intimate integration has been constructed. Fig. 2d also shows that the lattice spacing of 0.280 nm and 0.370 nm can be observed, which can be attributed to the (012) tetragonal BiOBr and (002) crystal plane of tetragonal BiOCl. The lattice spacing of CQDs is determined to be 0.320 nm, which corresponding to the (002) crystal plane.16,38 The above results further demonstrate that the CQDs are successfully loaded on the BiOBr to construct BiOBr/BiOCl/CQDs materials.
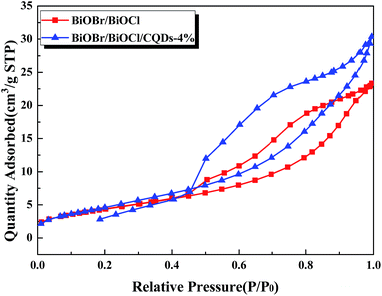
The N2 adsorption–desorption isotherms of the BiOBr/BiOCl and BiOBr/BiOCl/CQDs-4% materials were used to further study their microstructures. Fig. 3 and S6† show that the materials display type IV isotherms implying the existence of mesopores in the BiOBr/BiOCl/CQDs materials,31 which were presumably attributed to the interspaces between the nanosheets.39 In addition, the Barret–Joyner–Halenda (BJH) method was used to determine the porosity of the samples (Fig. S7†). The BET surface area and pore volumes of the microspheres are summarized in Table S1.† It has been widely recognized that materials with larger specific surface areas can absorb more active species and enable adequate photocatalyst-pollutants contact, resulting in a higher photocatalytic activity.40 According to Table S1,† the BET surface area of the BiOBr/BiOCl/CQDs-4% (17.4 m2 g−1) is nearly equal with that of BiOBr/BiOCl (17.9 m2 g−1), revealing the specific surface area was not the main factor to responsible for the enhanced photocatalytic activity of BiOBr/BiOCl/CQDs materials.
3.3 Optical and electronic properties
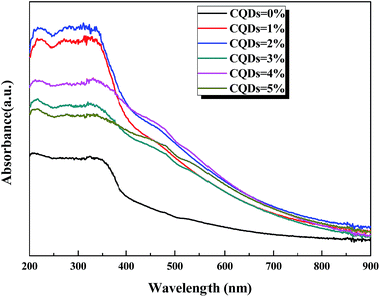
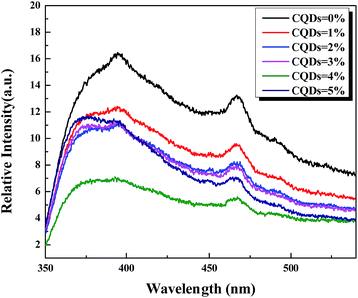
Photoabsorption capability is very important for the photocatalytic performance of photocatalysts,5,41 which is usually evaluated by UV-vis diffuse reflectance spectra (DRS). As shown in Fig. 4, the absorption edges of BiOBr/BiOCl/CQDs materials show red shifts compared with BiOBr/BiOCl, which means that the optical absorption in visible light is enhanced. The DRS results suggest that CQDs may play an important role in utilizing visible light and such produce more photoexcited e−–h+ pairs.19,42 The band gap of BiOBr/BiOCl/CQDs materials were estimated via the classical Tauc approach.40,43,44 As shown in Fig. S8,† the band gap of BiOBr/BiOCl/CQDs materials become smaller than that of BiOBr/BiOCl. A narrower band gap means a higher photocatalytic performance in visible light.16Photoluminescence (PL) intensity is capable of revealing the recombination efficiency of photogenerated e− and h+.33,45,46 As is known, weaker intensity represents lower recombination efficiency of e− and h+.40,47 Fig. 5 shows that all the materials have strong emission peak centered between 370 and 400 nm with an excitation wavelength at 275 nm. And the PL intensities of BiOBr/BiOCl/CQDs materials are lower than that of BiOBr/BiOCl, indicating lower recombination efficiency of e− and h+. This phenomenon can be ascribed to the highly efficient photoexcited carrier transfer from BiOBr/BiOCl to CQDs with conjugated π structure, leading to effective separation of e− and h+.3
3.4 Photocatalytic tests
CQDs content has important influence on photocatalyst performance, and too much CQDs may prevent the photocatalyst from light absorbing.5,19 Hence, the photocatalytic activity of the as-prepared BiOBr/BiOCl/CQDs materials with different CQDs contents was evaluated for the degradation of RhB under visible light irradiation (Fig. 6a). The absorption–desorption balances were achieved between the catalyst and dye in 30 min before photocatalysis. It can be seen that the direct photolysis of RhB is negligible without adding photocatalyst. In the presence of photocatalyst, the BiOBr/BiOCl/CQDs materials show much higher photocatalytic activity than that of BiOBr/BiOCl. The BiOBr/BiOCl/CQDs-4% material displays the highest photocatalytic activity. Nearly all of the RhB was photodegraded by BiOBr/BiOCl/CQDs-4% after 60 min irradiation, while only 77% of RhB was removed by BiOBr/BiOCl. Then, the corresponding fitted Langmuir–Hinshelwood models were obtained (Fig. 6b), and it is easy to see that the photodegradation of RhB obeys pseudo-first-order kinetics well. It can be seen that the BiOBr/BiOCl/CQDs-4% material has the maximum rate constant of 0.0609 min−1, which is about 2.8 times higher than BiOBr/BiOCl (0.0217 min−1). When the CQDs content is higher than 4%, BiOBr/BiOCl/CQDs materials show a decreased photocatalytic activity for the RhB degradation. The results indicate that the proper introduction of the CQDs is beneficial for the improvement of the photocatalytic performance of BiOBr/BiOCl/CQDs materials. Meanwhile, compared to our previous work on BiOBr/CQDs system with the maximum rate constant of 0.0296 min−1,5 the rate constant of BiOBr/BiOCl/CQDs-4% improves about 2.1 times, demonstrating the superiorities of BiOX/BiOY. Similar results on CQDs-based photocatalysts can also be found in the literatures.16,19,24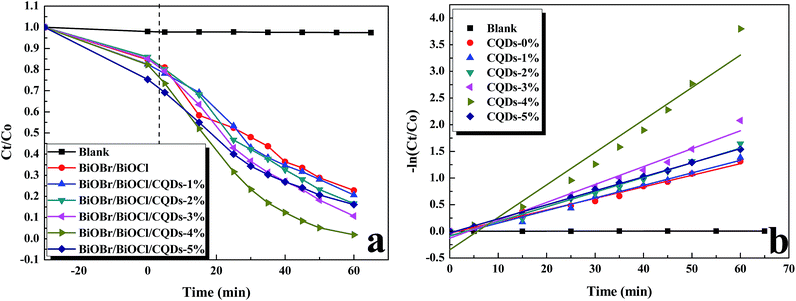 | ||
| Fig. 6 (a) Photodegradation kinetic curves and (b) fitted Langmuir–Hinshelwood models for the degradation of RhB with pure BiOBr/BiOCl and BiOBr/BiOCl/CQDs materials under visible light irradiation. | ||
The stability of the photocatalyst is important for the practical application.16 Recycling reactions were carried out for the photodegradation of RhB to evaluate the stability of BiOBr/BiOCl/CQDs-4% materials (collected after every 60 min photocatalytic reaction) under visible light irradiation. Fig. S9† shows that after five cycles, the degradation efficiency declined by 1.7%. Meanwhile, XRD spectra (Fig. S10†) indicate that the regenerated photocatalyst exhibits excellent physical stability. Thus, the BiOBr/BiOCl/CQDs material has high photostability.
3.5 Mechanism of pollutant photodegradation
In an attempt to elucidate the photocatalytic mechanism involved in the photodegradation of RhB by BiOBr/BiOCl/CQDs materials, a series of photodegradation experiments with the addition of different scavengers were carried out. The absorption peak value of RhB at 553 nm analyzed by UV-vis spectrophotometer could indirectly reflect the degradation efficiency after being illuminated for 60 min (Fig. 7). It can be seen that the photodegradation was inhibited to a variable extent. Fig. 7 shows that photodegradation activity decreases by 54.7% when BQ (O2˙− scavenger) rate is added into the degradation system, which indicates that O2˙− radicals play an important role in the photodegradation process. Simultaneously, photodegradation activity decreases by 48% and 26.6% when AgNO3 (e− acceptor) and KI (h+ scavenger) is added into the degradation system, respectively. It can be seen that the photodegradation was completed at 60 min illumination when IPA (˙OH scavenger) is added into the degradation system, demonstrating that ˙OH does not have direct effect to the photocatalytic process. Therefore, it can be assumed that O2˙− radicals are main active species during the photocatalysis process, while e− and h+ plays a secondary and a third role in the photodegradation process, respectively.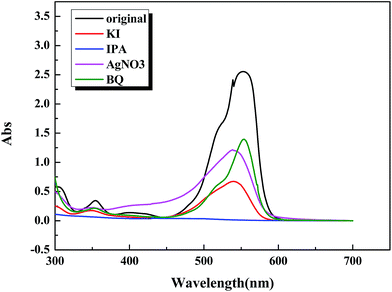 | ||
| Fig. 7 UV-vis absorption spectra of RhB solution in trapping experiments by BiOBr/BiOCl/CQDs materials at 60 min illumination. | ||
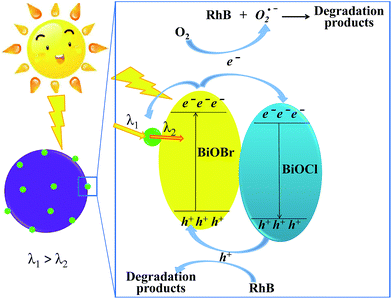
Based on the above experimental results, the photocatalytic mechanism diagram of BiOBr/BiOCl/CQDs hybrid materials is proposed in Fig. 8. The enhanced photocatalytic activity of BiOBr/BiOCl/CQDs can be ascribed to the synergistic effects of several factors. Firstly, for the formation of the heterojunction interface among CQDs, BiOBr and BiOCl, the photoexcited e− can transfer from BiOBr to CQDs and BiOCl. Moreover, the delocalized conjugated structure of CQDs made it easier to transfer the photogenerated carriers, resulting in efficient e−–h+ pair separation.4 Secondly, the up-converted PL property of CQDs can convert longer wavelength light to shorter wavelength light, which can in turn excite BiOBr to form photoexcited e−–h+pairs.15 Thus, more e−–h+ pairs are excited, result in an enhanced photocatalytic activity. The photoexcited e− can be captured by O2 molecules in the system to generate the O2˙− radicals.16,19 The generated O2˙− and the h+ would play important role in the photodegradation process, leading to dramatic photocatalytic performance. Thirdly, RhB has photosensitivity, it could absorb the visible light to transform into the activated intermediates (denoted as RhB*) and releases e− during photocatalysis process. Then, the e− could inject into the photocatalyst system.19,47 Finally, the intermediate product RhB* can be oxidized by the O2˙− radicals and photogenerated h+ to transform into the ultimate degradation products.
4. Conclusion
In summary, a novel BiOBr/BiOCl/CQDs hybrid material with enhanced photocatalytic activity was successfully prepared through a facile solvothermal method. The CQDs were dispersed in BiOBr/BiOCl and interface connection was established. BiOBr/BiOCl/CQDs demonstrated significant improvement over BiOBr/BiOCl in degradation of RhB under visible light irradiation. The BiOBr/BiOCl/CQDs-4% exhibited the optimal photocatalytic performance for the degradation of RhB. Furthermore, the BiOBr/BiOCl/CQDs materials showed excellent stability. The enhanced photocatalytic performance of BiOBr/BiOCl/CQDs material was attributed to excellent electron transferability of BiOCl and CQDs, and the increased light harvesting capacity of CQDs. The radicals trapping experiments revealed that O2˙−, e− and h+ were the main active species during the photocatalysis process. Our work was expectedly to provide appropriate theoretical reference and encourage new design of CQDs-based hybrid materials with visible light sensitive performance.Conflicts of interest
There are no conflicts to declare.Acknowledgements
The authors are grateful for the financial support provided by the National Natural Science Foundation of China (No. 51173146), the National Key Research and Development Program of China (No. 2016YFC0301302) and College Student Innovation Fund Project of NPU (201510699250).References
- L. Chen, R. Huang, M. Xiong, Q. Yuan, J. He, J. Jia, M. Y. Yao, S. L. Luo, C. T. Au and S. F. Yin, Inorg. Chem., 2013, 52, 11118–11125 CrossRef CAS PubMed.
- C. Zheng, C. Cao and Z. Ali, Phys. Chem. Chem. Phys., 2015, 17, 13347–13354 RSC.
- J. Di, J. Xia, M. Ji, B. Wang, X. Li, Q. Zhang, Z. Chen and H. Li, ACS Sustainable Chem. Eng., 2016, 4, 136–146 CrossRef CAS.
- Q. Q. Du, W. Wang, Y. Z. Wu, G. Zhao, F. Ma and X. Hao, RSC Adv., 2015, 5, 31057–31063 RSC.
- C. Zhao, W. Li, Y. Liang, Y. Tian and Q. Zhang, Appl. Catal., A, 2016, 527, 127–136 CrossRef CAS.
- H. Cheng, B. Huang and Y. Dai, Nanoscale, 2014, 6, 2009–2026 RSC.
- J. Jiang, K. Zhao, X. Xiao and L. Zhang, J. Am. Chem. Soc., 2012, 43, 4473–4476 CrossRef PubMed.
- D. Hou, X. Hu, P. Hu, W. Zhang, M. Zhang and Y. Huang, Nanoscale, 2013, 5, 9764–9772 RSC.
- D. Jiang, L. Chen, J. Zhu, M. Chen, W. Shi and J. Xie, Dalton Trans., 2013, 42, 15726–15734 RSC.
- L. Zhang, W. Wang, S. Sun, Y. Sun, E. Gao and J. Xu, Appl. Catal., B, 2013, 132–133, 315–320 CrossRef CAS.
- W. Li, Y. Tian, H. Li, C. Zhao, B. Zhang, H. Zhang, W. Geng and Q. Zhang, Appl. Catal., A, 2016, 516, 81–89 CrossRef CAS.
- G. Jiang, X. Wang, Z. Wei, X. Li, X. Xi, R. Hu, B. Tang, R. Wang, S. Wang and T. Wang, J. Mater. Chem. A, 2013, 1, 2406–2410 CAS.
- S. Zhang and J. Yang, Ind. Eng. Chem. Res., 2015, 54, 9913–9919 CrossRef CAS.
- X. Xiao, J. Hazard. Mater., 2012, 233–234, 122–130 CrossRef CAS PubMed.
- S. Y. Lim, W. Shen and Z. Gao, Chem. Soc. Rev., 2015, 44, 362–381 RSC.
- J. Di, J. Xia, Y. Ge, H. Li, H. Ji, H. Xu, Q. Zhang, H. Li and M. Li, Appl. Catal., B, 2015, 168, 51–61 CrossRef.
- H. Li, Angew. Chem., Int. Ed., 2010, 49, 4430–4434 CrossRef CAS PubMed.
- J. Liu, Y. Liu, N. Liu, Y. Han, X. Zhang, H. Huang, Y. Lifshitz, S. T. Lee, J. Zhong and Z. Kang, Science, 2015, 347, 970–974 CrossRef CAS PubMed.
- J. Xia, J. Di, H. Li, X. Hui, H. Li and S. Guo, Appl. Catal., B, 2015, 181, 260–269 CrossRef.
- H. Li, R. Liu, Y. Liu, H. Huang, H. Yu, H. Ming, S. Lian, S.-T. Lee and Z. Kang, J. Mater. Chem., 2012, 22, 17470–17475 RSC.
- H. Zhang, H. Ming, S. Lian, H. Huang, H. Li, L. Zhang, Y. Liu, Z. Kang and S. T. Lee, Dalton Trans., 2011, 40, 10822–10825 RSC.
- J. Di, J. Xia, M. Ji, H. Li, H. Xu, H. Li and R. Chen, Nanoscale, 2015, 7, 11433–11443 RSC.
- H. Wang, Z. Wei, H. Matsui and S. Zhou, J. Mater. Chem. A, 2014, 2, 15740–15745 CAS.
- J. Di, J. Xia, M. Ji, B. Wang, S. Yin, Q. Zhang, Z. Chen and H. Li, ACS Appl. Mater. Interfaces, 2015, 7, 20111–20123 CAS.
- F. Duo, Y. Wang, C. Fan, X. Zhang and Y. Wang, J. Alloys Compd., 2016, 685, 34–41 CrossRef CAS.
- S. Zhu, Q. Meng, L. Wang, J. Zhang, Y. Song, H. Jin, K. Zhang, H. Sun, H. Wang and B. Yang, Angew. Chem., Int. Ed., 2013, 52, 3953–3957 CrossRef CAS PubMed.
- W. Li, X. Jia, P. Li, B. Zhang, H. Zhang, W. Geng and Q. Zhang, ACS Sustainable Chem. Eng., 2015, 3, 1101–1110 CrossRef CAS.
- Y. I. Choi, K. H. Jeon, H. S. Kim, J. H. Lee, S. J. Park, J. E. Roh, M. M. Khan and Y. Sohn, Sep. Purif. Technol., 2016, 160, 28–42 CrossRef CAS.
- G. Dai, J. Yu and G. Liu, J. Phys. Chem. C, 2012, 116, 15519–15524 CAS.
- J. Zhang, J. Xia, S. Yin, H. Li, H. Xu, M. He, L. Huang and Q. Zhang, Colloids Surf., A, 2013, 420, 89–95 CrossRef CAS.
- T. B. Li, G. Chen, C. Zhou, Z. Y. Shen, R. C. Jin and J. X. Sun, Dalton Trans., 2011, 40, 6751–6758 RSC.
- H. Zhang, H. Huang, H. Ming, H. Li, L. Zhang, Y. Liu and Z. Kang, J. Mater. Chem., 2012, 22, 10501–10506 RSC.
- H. Li, T. Hu, J. Liu, S. Song, N. Du, R. Zhang and W. Hou, Appl. Catal., B, 2016, 182, 431–438 CrossRef CAS.
- Z. Zhao, Y. Zhou, F. Wang, K. Zhang, S. Yu and K. Cao, ACS Appl. Mater. Interfaces, 2015, 7, 730–737 CAS.
- J. Li, N. Wang, T. T. Tran, C. Huang, L. Chen, L. Yuan, L. Zhou, R. Shen and Q. Cai, Analyst, 2013, 138, 2038–2043 RSC.
- Z. Q. Liu, P. Y. Kuang, R. B. Wei, N. Li, Y. B. Chen and Y. Z. Su, RSC Adv., 2016, 6, 16122–16130 RSC.
- L. Sun, L. Xiang, X. Zhao, C. J. Jia, J. Yang, Z. Jin, X. Cheng and W. Fan, ACS Catal., 2015, 5, 3540–3551 CrossRef CAS.
- D. Tang, H. Zhang, H. Huang, R. Liu, Y. Han, Y. Liu, C. Tong and Z. Kang, Dalton Trans., 2013, 42, 6285–6289 RSC.
- X. J. Guo, M. Zhen, H. Liu and L. Liu, RSC Adv., 2015, 5, 24777–24782 RSC.
- J. Di, J. Xia, M. Ji, B. Wang, Y. Sheng, Z. Qi, Z. Chen and H. Li, Appl. Catal., B, 2016, 183, 254–262 CrossRef CAS.
- H. Li, W. Hou, X. Tao and N. Du, Appl. Catal., B, 2015, 172, 27–36 CrossRef.
- J. Di, J. Xia, Y. Ge, L. Xu, H. Xu, J. Chen, M. He and H. Li, Dalton Trans., 2014, 43, 15429–15438 RSC.
- H. P. Jiao, X. Yu, Z. Q. Liu, P. Y. Kuang and Y. M. Zhang, RSC Adv., 2015, 5, 16239–16249 RSC.
- C. Lang, H. Rui, X. Miao, Q. Yuan, H. Jie, J. Jing, M. Y. Yao, S. L. Luo, C. T. Au and S. F. Yin, Inorg. Chem., 2013, 52, 11118–11125 CrossRef PubMed.
- X. Wang, C. Liow, A. Bisht, X. Liu, T. C. Sum, X. Chen and S. Li, Adv. Mater., 2015, 27, 2207–2214 CrossRef CAS PubMed.
- L. Chen, D. Jiang, T. He, Z. Wu and M. Chen, CrystEngComm, 2013, 15, 7556–7563 RSC.
- K. Li, Y. Tang, Y. Xu, Y. Wang, Y. Huo, H. Li and J. Jia, Appl. Catal., B, 2013, 140–141, 179–188 CrossRef CAS.
Footnote |
| † Electronic supplementary information (ESI) available. See DOI: 10.1039/c7ra10344a |
| This journal is © The Royal Society of Chemistry 2017 |

