 Open Access Article
Creative Commons Attribution 3.0 Unported Licence
Trichodermamides D–F, heterocyclic dipeptides with a highly functionalized 1,2-oxazadecaline core isolated from the endophytic fungus Penicillium janthinellum HDN13-309†
Meilin Zhua,
Zhen Yangcd,
Huimin Fenga,
Qi Gana,
Qian Chea,
Tianjiao Zhua,
Qianqun Gua,
Bingnan Han*c and
Dehai Li *ab
*ab
aKey Laboratory of Marine Drugs, Chinese Ministry of Education, School of Medicine and Pharmacy, Ocean University of China, Qingdao 266003, People's Republic of China. E-mail: dehaili@ouc.edu.cn; Fax: +86-532-82033054; Tel: +86-532-82031632
bLaboratory for Marine Drugs, Bioproducts of Qingdao National Laboratory for Marine Science and Technology, Qingdao, 266237, People's Republic of China
cDepartment of Development Technology of Marine Resources, College of Life Sciences, Zhejiang Sci-Tech University, Hangzhou 310018, People's Republic of China. E-mail: hanbingnan@zstu.edu.cn
dResearch Center for Marine Drugs, Department of Pharmacy, State Key Laboratory of Oncogenes and Related Genes, Renji Hospital, School of Medicine, Shanghai Jiao Tong University, Shanghai 200127, China
First published on 12th October 2017
Abstract
Three new heterocyclic dipeptides with a highly functionalized 1,2-oxazadecaline core, named trichodermamides D–F (1–3), together with the known trichodermamides A–C (4–6), were isolated from the broth of the mangrove-derived endophytic fungus Penicillium janthinellum HDN13-309. The structures were elucidated through extensive NMR spectroscopic and physical data. The absolute configurations of compounds 1–3 were determined by ECD calculations and single-crystal X-ray diffraction experiments. The cytoprotective activities were evaluated on different phase II detoxifying enzymes (SOD2, AKR1C1, HO-1 and NQO1), and compounds 4 and 6 showed potent inducing effects at the concentration of 10 μM.
Introduction
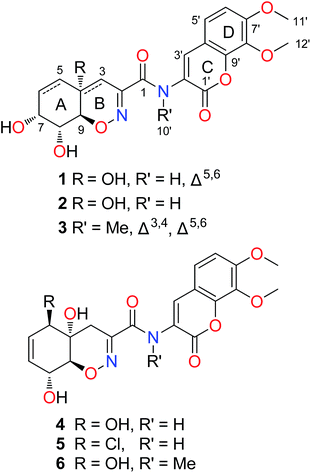
The trichodermamides are a family of heterocyclic dipeptides featuring the 1,2-oxazadecaline moiety which is connected to a 4H-chroman-4-one unit via an amide group. As rarely discovered fungal secondary metabolites, only a few analogues, namely, trichodermamides A–C, aspergillazines A–E and dithioaspergillazine A have been reported from Trichoderma sp.,1,2 Eupenicillium sp.3 and Aspergillus sp.4 The structural diversity of reported trichodermamides is mainly represented by the variety of substitutions on the cyclohexane ring of the 1,2-oxazadecaline moiety (rings A and B). Although only very limited bioassays have been evaluated, trichodermamide B and dithioaspergillazine A have been reported to show cytotoxicity against the HCT-116 cell line with IC50 values of 0.7 and 1.3 μM, respectively.1,2 Further studies by Jans et al. suggested that trichodermamide B could cause DNA double-strand breaks leading to accumulation of cells in the S phase of the cell cycle and subsequent initiation of apoptosis in HeLa cells.5 Driven by the structural novelty and potent bioactivity, total synthesis of trichodermamides A–C have been achieved.6–8In our previous research, a serious of cytotoxic gliovirins (penicisulfuranols A–F) have been isolated from an active endophytic fungus Penicillium janthinellum HDN13-309.9,10 To obtain enough amounts of these compounds for further bioactive study, P. janthinellum HDN13-309 was re-cultured in a larger scale under the same condition and a series of compounds with UV absorptions different from gliovirins were observed as minor components (Fig. S1 in ESI†). Continuous exploration led to the isolation of three new dipeptides named trichodermamides D–F (1–3) together with the known trichodermamides A–C (4–6) (Fig. 1). Among them, compounds 1–3 are the first trichodermamides with the double bond at C-5/C-6 or two double bonds at both C-3/C-4 and C-5/C-6. Herein, we report the isolation, structure elucidation and bioactivity evaluation of compounds 1–6.
Results and discussion
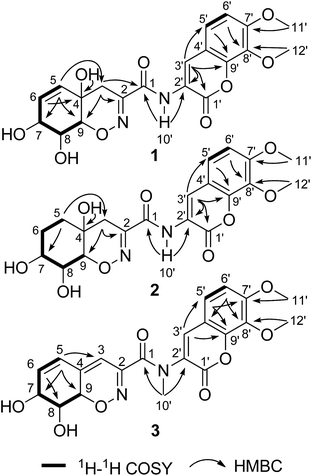
The fungus P. janthinellum HDN13-309 was re-cultured (100 L) under static conditions at 28 °C.9 The EtOAc extract (47 g) was fractionated by column chromatography and semi-preparative HPLC guided by the UV absorptions, which led to the isolation of compounds 1–6.Compound 1 was obtained as pale yellow powder with molecular formula C20H20N2O9, established by HRESIMS ion at m/z 433.1245 [M + H]+, indicating 12 degrees of unsaturation. The 1H and 13C NMR spectroscopic data showed the presence of two oxygenated methyls, one sp3 methylene, eight methines (with five sp2 and three sp3 ones) and nine nonprotonated carbons including eight sp2 and one sp3 ones. Similarity of the 1D NMR data with those of trichodermamide A (4) indicated that they share the same skeleton.1 Detailed analysis of the 2D NMR correlations (Fig. 2) indicated that the major differences between 1 and 4 were the positions of double bond and a hydroxyl group in ring A. The COSY correlations (H-5/H-6/H-7/H-8/H-9) and the HMBC correlations from H-5 to C-3/C-7/C-9, from H-6 to C-4, from H-3 to C-1/C-2/C-9 and from 4-OH to C-4 confirmed the structure of ring A with the double bond at C-5 and C-6. In addition, the chemical shift of C-7 (δC 67.0) also indicated that the hydroxyl group was located at C-7. Thus the planar structure of compound 1 was established and the Δ5,6 and 7-OH distinguished 1 from other known trichodermamides such as compounds 4–6 (Δ6,7 and 5-OH).
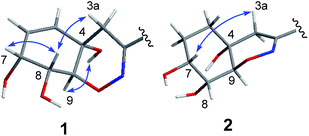
The relative configuration of 1 was deduced as 4S*, 7R*, 8R*, 9S* on the basis of the NOESY data and coupling constants. The NOESY cross-peaks of H-7/H-8 and the small coupling constant between them (JH-7/H-8 = 4.5 Hz) indicated that H-7 and H-8 were cofacial of the hexane ring (ring A). The NOESY correlation of 4-OH/H-9 and H-3a/H-8 suggested that 4-OH and H-9 oriented to the other side of the hexane ring (Fig. 3), which was also agree with the anti-configuration of H-8 and H-9 supported by the large coupling constant (JH-8/H-9 = 10.9 Hz) (Table 1). The absolute configuration of 1 was determined by comparison of the experimental and computed ECD curves.11–13 The initial MMFF conformational search and subsequent DFT reoptimization at the B3LYP/6-31 + G (d) level of the arbitrarily chosen (4S,7R,8R,9S)-1 provided four major lowest-energy conformers with 49.7%, 33.9%, 7.7% and 7.0% populations, respectively (Table S1 and Fig. S2 in ESI†). The ECD spectrum of each conformer was calculated at the same basis set and the combination results showed well agreement with the experiment one (Fig. 4), which indicated the 4S, 7R, 8R, 9S absolute configuration of 1.
| Position | 1 | 2 | 3 | |||
|---|---|---|---|---|---|---|
| δH (J in Hz) | δC, type | δH (J in Hz) | δC, type | δH (J in Hz) | δC, type | |
| 1 | 161.2, C | 161.4, C | 164.1, C | |||
| 2 | 148.2, C | 149.2, C | 146.0, C | |||
| 3 | a 2.58, d (18.9), b 2.15, d (18.9) | 29.3, CH2 | a 2.24, d (19.0), b 2.38, d (19.0) | 26.6, CH2 | 6.20, brs | 109.6, CH |
| 4 | 64.5, C | 66.9, C | 135.6, C | |||
| 4-OH | 5.47, brs | |||||
| 5 | 5.79, d (9.9) | 135.9, CH | 1.58, m | 28.3, CH2 | 6.37, d (9.4) | 125.9, CH |
| 6 | 5.67, dd (9.9, 4.5) | 127.2, CH | 1.58, m | 26.7, CH2 | 6.25, dd (9.4, 5.5) | 137.5, CH |
| 7 | 4.03, dd (4.5, 4.5) | 67.0, CH | 3.59, brs | 71.6, CH | 4.03, dd (5.5, 5.2) | 66.3, CH |
| 8 | 3.46, dd (10.9, 4.5) | 68.2, CH | 3.44, m | 67.1, CH | 3.56, m | 70.4, CH |
| 9 | 4.21, d (10.9) | 79.8, CH | 3.91, d (10.6) | 83.7, CH | 4.10, d (10.9) | 72.5, CH |
| 1′ | 158.2, C | 158.3, C | 158.4, C | |||
| 2′ | 121.3, C | 121.3, C | 128.2, C | |||
| 3′ | 8.51, s | 124.4, CH | 8.51, s | 124.2, CH | 8.11, s | 137.3, CH |
| 4′ | 114.1, C | 114.1, C | 113.7, C | |||
| 5′ | 7.46, d (8.8) | 123.4, CH | 7.46, d (8.8) | 123.4, CH | 7.41, d (8.4) | 124.1, CH |
| 6′ | 7.11, d (8.8) | 110.6, CH | 7.11, d (8.8) | 110.6, CH | 7.15, d (8.4) | 110.5, CH |
| 7′ | 154.3, C | 154.3, C | 155.9, C | |||
| 8′ | 135.7, C | 135.7, C | 135.7, C | |||
| 9′ | 144.0, C | 144.1, C | 146.2, C | |||
| 10′ | 9.31, s | 9.31, s | 3.23, s | 37.0, CH3 | ||
| 11′ | 3.88, s | 56.8, CH3 | 3.88, s | 56.8, CH3 | 3.90, s | 56.8, CH3 |
| 12′ | 3.82, s | 61.3, CH3 | 3.82, s | 61.3, CH3 | 3.82, s | 61.2,CH3 |
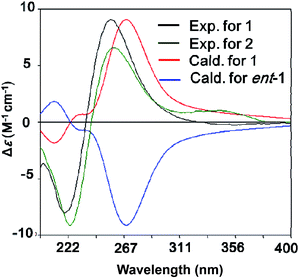 | ||
| Fig. 4 B3LYP/6-31+G(d)-calculated ECD spectra of 1 (red) and its enantiomer (blue) and the experimental ones of 1 (black) and 2 (green) (σ = 0.28 eV for 1). | ||
The chemical molecular of compound 2 was determined as C20H22N2O9 based on the HRESIMS ion peak at m/z 435.1385 [M + H]+. The 1D NMR data of compound 2 were very close to those of 1. The major differences between 1 and 2 were the appearance of signals for two methylenes at δH 1.58 (H2-5 and H2-6) in 2 and the disappearance of signals for a double bond (Δ5,6), indicating that the Δ5,6 double bond in 1 was saturated in 2. The planar structure was also confirmed by COSY and HMBC correlations (Fig. 2). With the biosynthetic consideration and evidenced by the NOESY correlations of H-3a/H-7 (Fig. 3) as well as the large coupling constants between H-8 and H-9 (10.6 Hz), the relative configuration of 2 was suggested the same to 1. Finally, the absolute configuration of 2 was determined as the same as 1 suggested by the similar ECD curves of them (Fig. 4).
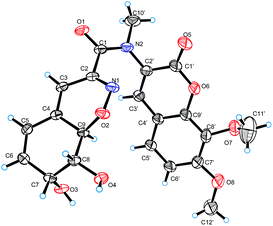
Compound 3 was isolated as pale yellow needles and assigned the molecular formula C21H20N2O8 on the basis of the HRESIMS ion peak at m/z 429.1298 [M + H]+. Comparing with 1, the absence of signals for H2-3 of 1 and appearance of a sp2 methine (δH 6.20, H-3) signal of 3 indicated that the 4-OH in 3 was substituted by a double bond. The replacement was further supported by the HMBC correlations from H-5 to C-3 (δC 109.6) (Fig. 2), and agreed with the degrees of unsaturation. Moreover, an extra methyl (δH 3.23, 10′-CH3) signal and the HMBC correlations from H3-10′ to C-1 and C-2′ indicated the existence of a N-methyl. The coupling constants between H-7 and H-8 (5.2 Hz) and between H-8 and H-9 (10.9 Hz) also suggested the same relative configurations of C-7, C-8 and C-9 as 1 (Table 1). The absolute configuration of 3 was also deduced by the X-ray single-crystal diffraction experiment (Cu Kα radiation (λ = 1.54184 Å); Flack parameter 0.05(11)) (Fig. 5).
The structures of known trichodermamides A–C (4–6) were identified by comparison of their spectroscopic and physical data (1H and 13C NMR, MS, optical rotation) with those reported in the literature.1,3
Inspired by the previously reported chemical transformation from pretrichodermamide A to trichodermamide A under alkali conditions,14 we investigated whether the trichodermamides isolated from P. janthinellum HDN13-309 were artificial products. The fresh CH3CN extract of the fermentation product was analyzed by UPLC-UV-MS and compounds 1–6 were all detected (Fig. S3 in ESI†). It was reported that pretrichodermamide A was stable under neutral and acidic conditions.14 The pH of the fermentation broth was also supervised and the values ranged from 6.0 to 5.0 during the culturing period. Based on the above data, compounds 1–6 were not considered as artificial products.
The cytotoxicity of compounds 1–6 were tested and only 5 was active. Including the reported cytotoxicity of 5 against HCT-116 and HeLa,1,5 compound 5 also showed activities against K562, HL-60, HO-8910 and MGC803 (adriamycin as positive control) with IC50 values of 8.0, 1.8, 1.9 and 1.6 μM.
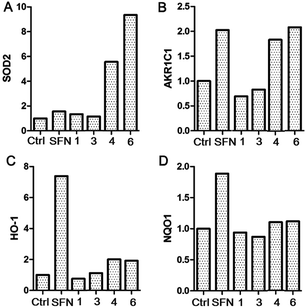
During the process of multiple cellular activities screening, compounds 1, 3, 4 and 6 were further tested cytoprotective activities by inducing the expression of phase II detoxifying enzymes, including superoxide dismutase 2 (SOD2), aldo–keto reductase family 1 member C1 (AKR1C1), heme oxygenase 1 (HO-1) and human NAD(P)H: quinone oxidoreductase 1 (NQO1). These antioxidant enzymes can prevent cells from various injuries of natural environment. In order to evaluate the antioxidant activities of these compounds in HaCaT cell, the cells were treated with these compounds (10 μM) for 12 h and then the total protein was analyzed by western blotting experiment. Interestingly, compounds 4 and 6 significantly induced the level of AKR1C1, SOD2, while only slightly increased the protein expression of HO-1 and NQO1 in HaCaT cells (Fig. 6). Since cytoprotective proteins are induced as an adaptive response to mild oxidative and/or electrophilic stress as a safe guard against excessive ROS-induced cellular damage, compounds 4 and 6 might be able to function as antioxidants to protect cells from ROS damage.
Experimental section
General
Optical rotations were measured with a JASCO P-1020 digital polarimeter. UV spectra were recorded on Beckman DU640 spectrophotometer. IR spectra were obtained with a Nicolet NEXUS 470 spectrophotometer in KBr discs. CD spectra were measured on JASCO J-715 or Chirascan CD spectropolarimeter. NMR spectra were recorded on a JEOL JNMECP 600 and Bruker-400 spectrometers using TMS as an internal standard, with chemical shifts recorded as δ values. ESIMS was measured on a Micromass Q-TOF Ultima Global GAA076 LC mass spectrometer. HRESIMS was obtained with a Micromass EI-4000 (Autospec-Ultima-TOF). The human chronic myeloblastic leukemia K562 cells, human promyelocytic leukemia HL-60 cells, human cervical carcinoma HeLa cells, and human gastric mucous adenocarcinoma MGC803 cells were obtained from Shanghai Cell Bank, Chinese Academy of Science. Human ovarian cancer HO-8910 cells were provided by the American Type Culture Collection. The phase II detoxifying enzymes including SOD2, AKR1C1, HO-1 and NQO1 were obtained from Cell Signaling Technology.Strains and culture conditions
The fungal strain HDN13-309 (GenBank accession number KM659023) was isolated from the root of mangrove plant Sonneratia caseolaris after disinfection, and was identified as Penicillium janthinellum by ITS sequence. A voucher specimen is deposited in our laboratory at −20 °C. The working strain was prepared on potato dextrose agar slants and stored at 4 °C. The fungus P. janthinellum HDN13-309 was cultured for four weeks under static conditions at 28 °C in 1000 mL Erlenmeyer flasks containing 300 mL liquid medium containing maltose (2%), mannitol (2%), glucose (1%), sodium glutamate (1%), yeast extract (0.3%), corn syrup (0.1%), KH2PO4 (0.05%) and MgSO4·7H2O (0.03%) dissolved in naturally collected seawater (Huiquan Bay, Yellow Sea, Qiangdao, China).Purification
The crude extract was applied to a silica gel (300–400 mesh) column and was separated into six fractions (fraction 1 to fraction 7) with a step gradient elution of MeOH–CH2Cl2. Among these, fraction 4 was purified by Sephadex LH20 and further separated by semipreparative HPLC (15![[thin space (1/6-em)]](https://www.rsc.org/images/entities/char_2009.gif) :
:![[thin space (1/6-em)]](https://www.rsc.org/images/entities/char_2009.gif) 85 CH3CN–H2O, 4 mL min−1) to obtain compound 4 (6.5 mg, tR 22 min). Fraction 5 was applied on semi-preparative HPLC (20
85 CH3CN–H2O, 4 mL min−1) to obtain compound 4 (6.5 mg, tR 22 min). Fraction 5 was applied on semi-preparative HPLC (20![[thin space (1/6-em)]](https://www.rsc.org/images/entities/char_2009.gif) :
:![[thin space (1/6-em)]](https://www.rsc.org/images/entities/char_2009.gif) 80 CH3CN–H2O, 4 mL min−1) to afford compounds 1 (6.0 mg, tR 15 min) and 2 (4.0 mg, tR 16 min). Fraction 6 was first purified by MPLC using stepwise gradient elution with 5–80% MeOH–H2O and then by semipreparative HPLC (50
80 CH3CN–H2O, 4 mL min−1) to afford compounds 1 (6.0 mg, tR 15 min) and 2 (4.0 mg, tR 16 min). Fraction 6 was first purified by MPLC using stepwise gradient elution with 5–80% MeOH–H2O and then by semipreparative HPLC (50![[thin space (1/6-em)]](https://www.rsc.org/images/entities/char_2009.gif) :
:![[thin space (1/6-em)]](https://www.rsc.org/images/entities/char_2009.gif) 50 MeOH–H2O, 4 mL min−1) to yield 3 (5.5 mg, tR 17 min). Fraction 7 was first purified by MPLC using stepwise gradient elution with 30–80% MeOH–H2O and then by semipreparative HPLC (35
50 MeOH–H2O, 4 mL min−1) to yield 3 (5.5 mg, tR 17 min). Fraction 7 was first purified by MPLC using stepwise gradient elution with 30–80% MeOH–H2O and then by semipreparative HPLC (35![[thin space (1/6-em)]](https://www.rsc.org/images/entities/char_2009.gif) :
:![[thin space (1/6-em)]](https://www.rsc.org/images/entities/char_2009.gif) 65 CH3CN–H2O, 4 mL min−1) to afford compounds 5 (15.0 mg, tR 15 min) and 6 (20.0 mg, tR 20 min).
65 CH3CN–H2O, 4 mL min−1) to afford compounds 5 (15.0 mg, tR 15 min) and 6 (20.0 mg, tR 20 min).
![[thin space (1/6-em)]](https://www.rsc.org/images/entities/char_2009.gif) ε) 243 (sh) (3.45), 313 (3.76) nm; IR (KBr) νmax 2355, 1684, 1601, 1519, 1460, 1378, 1284, 1102, 673 cm−1; 1H and 13C NMR see Table 1; HRESIMS m/z 429.1298 [M + H]+ (calcd for C21H21N2O8, 429.1292).
ε) 243 (sh) (3.45), 313 (3.76) nm; IR (KBr) νmax 2355, 1684, 1601, 1519, 1460, 1378, 1284, 1102, 673 cm−1; 1H and 13C NMR see Table 1; HRESIMS m/z 429.1298 [M + H]+ (calcd for C21H21N2O8, 429.1292).X-Ray crystallographic analysis
An optically active colorlessly crystal of 3 was obtained in acetone/H2O. The crystal was kept at 295(2) K during data collection. A suitable crystal was selected and recorded with Xcalibur Eos Gemini single-crystal diffractometer with Cu Kα radiation (λ = 1.54184 Å). Using Olex2,15 the structure was solved with the ShelXS16 structure solution program using Direct Methods and refined with the ShelXL17 refinement package using Least Squares minimisation. Crystallographic data have been deposited in the Cambridge Crystallographic Data Center with the deposition number CCDC 1569990.†Computation section
Conformational searches were run by employing the “systematic” procedure implemented in Spartan'14 (ref. 18) using MMFF (Merck molecular force field). All MMFF minima were reoptimized with DFT calculations at the B3LYP/6-31+G(d) level using the Gaussian09 program.19 The geometry was optimized starting from various initial conformations, with vibrational frequency calculations confirming the presence of minima. Time-dependent DFT calculations were performed on four lowest-energy conformations for (4S,7R,8R,9S)-1 (>5% population) using 20 excited states, and using a polarizable continuum model (PCM) for MeOH. ECD spectra were generated using the program SpecDis20 by applying a Gaussian band shape with 0.28 eV width for 1, from dipole length rotational strengths. The dipole velocity forms yielded negligible differences. The spectra of the conformers were combined using Boltzmann weighting, with the lowest-energy conformations accounting for about 98% of the weights. The calculated spectra were shifted by 5 nm to facilitate comparison to the experimental data.Bioassays
Cytotoxic activities of 1–6 were evaluated against six human tumor cell lines, including K562 (human chronic myeloblastic leukemia), HL-60 (human promyelocytic leukemia cells), HeLa (human cervical carcinoma cell line), HO-8910 (human ovarian cancer cell line) and MGC803 (human gastric cancer cell line), using the SRB and MTT methods.21,22 Adriamycin was used as the positive control.The expression phase II metabolic enzymes were detected by western blot analysis. HaCaT cells were treated with compounds (10 μM) for 12 h.23,24 Cells were harvested and lysed with cell lysis buffer, enriched with a complete protease inhibitor, PMSF, and then incubated on ice for 30 min with regular vortexing before centrifuging at 12![[thin space (1/6-em)]](https://www.rsc.org/images/entities/char_2009.gif) 000 rpm at 4 °C for 15 min. Protein concentration was determined by using BCA kit. The protein samples were boiled in 5× SDS sample buffer for 5 min and were resolved on a 10% SDS polyacrylamide gel. After electrophoresis, proteins were transferred onto polyvinyl difluoride (PVDF) membrane, which was blocked with 5% nonfat dry milk in 1× TBST (Tris-buffered saline with 0.1% Tween-20) and incubated with primary antibody at the appropriate final concentration followed by hybridization with horseradish peroxidase-conjugated anti-rabbit or anti-mouse secondary antibodies (1
000 rpm at 4 °C for 15 min. Protein concentration was determined by using BCA kit. The protein samples were boiled in 5× SDS sample buffer for 5 min and were resolved on a 10% SDS polyacrylamide gel. After electrophoresis, proteins were transferred onto polyvinyl difluoride (PVDF) membrane, which was blocked with 5% nonfat dry milk in 1× TBST (Tris-buffered saline with 0.1% Tween-20) and incubated with primary antibody at the appropriate final concentration followed by hybridization with horseradish peroxidase-conjugated anti-rabbit or anti-mouse secondary antibodies (1![[thin space (1/6-em)]](https://www.rsc.org/images/entities/char_2009.gif) :
:![[thin space (1/6-em)]](https://www.rsc.org/images/entities/char_2009.gif) 5000) followed by ECL detection. For each step, the membrane was washed with 1× TBST buffer three times for 10 min each.
5000) followed by ECL detection. For each step, the membrane was washed with 1× TBST buffer three times for 10 min each.
Conclusions
In summary, six heterocyclic dipeptides (1–6) were isolated from the mangrove endophytic fungus P. janthinellum HDN13-309. Trichodermamides D–F (1–3) are new ones possessing a rare 1,2-oxazadecaline moiety with the different replacement of the double bond from the known ones. The noncytotoxic compounds 4 and 6 exhibited significant cytoprotective activities which might be able to function as antioxidants.Conflicts of interest
There are no conflicts to declare.Acknowledgements
This work was financially supported by the National Natural Science Foundation of China (21372208, and 81373321), the Shandong Provincial Natural Science Fund for Distinguished Young Scholars (JQ201422), AoShan Talents Program Supported by Qingdao National Laboratory for Marine Science and Technology (2015ASTP-ES09), NSFC-Shandong Joint Fund for Marine Science Research Centers (U1606403), Shandong province key research and development program (2016GSF201204), Fundamental Research Funds for the Central Universities (201564026), the Scientific and Technological Innovation Project Financially Supported by Qingdao National Laboratory for Marine Science and Technology (2015ASKJ02).Notes and references
- E. Garo, C. M. Starks, P. R. Jensen, W. Fenical, E. Lobkovsky and J. Clardy, J. Nat. Prod., 2003, 66, 423–426 CrossRef CAS PubMed.
- H. Yamazaki, H. Rotinsulu, O. Takahashi, R. Kirikoshi and M. Namikoshi, Tetrahedron Lett., 2016, 57, 5764–5767 CrossRef CAS.
- R. A. Davis, J. Longden, V. M. Avery and P. C. Healy, Bioorg. Med. Chem. Lett., 2008, 18, 2836–2839 CrossRef CAS PubMed.
- R. J. Capon, R. Ratnayake, M. Stewart, E. Lacey, S. Tennant and J. H. Gill, Org. Biomol. Chem., 2005, 3, 123–129 CAS.
- P. E. Jans, A. M. Mfuh, H. D. Arman, C. V. Shaffer, O. V. Larionov and S. L. Mooberry, J. Nat. Prod., 2017, 80, 676–683 CrossRef CAS PubMed.
- C. D. Lu and A. Zakarian, Angew. Chem., Int. Ed., 2008, 47, 6829–6831 CrossRef CAS PubMed.
- X. Wan and M. M. Joullié, J. Am. Chem. Soc., 2008, 130, 17236–17237 CrossRef CAS PubMed.
- A. M. Mfuh, Y. Zhang, D. E. Stephens, A. X. T. Vo, H. D. Arman and O. V. Larionov, J. Am. Chem. Soc., 2015, 137, 8050–8053 CrossRef CAS PubMed.
- M. Zhu, X. Zhang, H. Feng, J. Dai, J. Li, Q. Che, Q. Gu, T. Zhu and D. Li, J. Nat. Prod., 2017, 80, 71–75 CrossRef CAS PubMed.
- D. Li, M. Zhu, Q. Gu, T. Zhu, J. Li and Q. Che, Faming Zhuanli Shenqing, ZL 105037397B, 2015.
- J. Peng, H. Gao, J. Li, J. Ai, M. Geng, G. Zhang, T. Zhu, Q. Gu and D. Li, J. Org. Chem., 2014, 79, 7895–7904 CrossRef PubMed.
- H. Gao, W. Liu, T. Zhu, X. Mo, A. Mándi, T. Kurtán, J. Li, J. Ai, Q. Gu and D. Li, Org. Biomol. Chem., 2012, 10, 9501–9506 CAS.
- W. Guo, D. Li, J. Peng, T. Zhu, Q. Gu and D. Li, J. Nat. Prod., 2015, 78, 306–310 CrossRef CAS PubMed.
- P. Seephonkai, P. Kongsaeree, S. Prabpai, M. Isaka and Y. Thebtaranonth, Org. Lett., 2006, 8, 3073–3075 CrossRef CAS PubMed.
- O. V. Dolomanov, L. J. Bourhis, R. J. Gildea, J. A. K. Howard and H. Puschmann, J. Appl. Crystallogr., 2009, 42, 339–341 CrossRef CAS.
- G. M. Sheldrick, Acta Crystallogr., 2015, A71, 3–8 CrossRef PubMed.
- G. M. Sheldrick, Acta Crystallogr., 2015, C71, 3–8 CrossRef PubMed.
- Spartan'14, Wavefunction Inc., Irvine, CA, 2013 Search PubMed.
- M. J. Frisch, G. W. Trucks, H. B. Schlegel, G. E. Scuseria, M. A. Robb, J. R. Cheeseman, G. Scalmani, V. Barone, B. Mennucci, G. A. Petersson, H. Nakatsuji, M. Caricato, X. Li, H. P. Hratchian, A. F. Izmaylov, J. Bloino, G. Zheng, J. L. Sonnenberg, M. Hada, M. Ehara, K. Toyota, R. Fukuda, J. Hasegawa, M. Ishida, T. Nakajima, Y. Honda, O. Kitao, H. Nakai, T. Vreven, J. A. Montgomery Jr, J. E. Peralta, F. Ogliaro, M. Bearpark, J. J. Heyd, E. Brothers, K. N. Kudin, V. N. Staroverov, R. Kobayashi, J. Normand, K. Raghavachari, A. Rendell, J. C. Burant, S. S. Iyengar, J. Tomasi, M. Cossi, N. Rega, J. M. Millam, M. Klene, J. E. Knox, J. B. Cross, V. Bakken, C. Adamo, J. Jaramillo, R. Gomperts, R. E. Stratmann, O. Yazyev, A. J. Austin, R. Cammi, C. Pomelli, J. W. Ochterski, R. L. Martin, K. Morokuma, V. G. Zakrzewski, G. A. Voth, P. Salvador, J. J. Dannenberg, S. Dapprich, A. D. Daniels, Ö. Farkas, J. B. Foresman, J. V. Ortiz, J. Cioslowski and D. J. Fox, Gaussian 09, Revision A.1, Gaussian, Inc., Wallingford, CT, 2009 Search PubMed.
- T. Bruhn, Y. Hemberger, A. Schaumlöffel and G. Bringmann, SpecDis, Version 1.53, University of Wuerzburg, Germany, 2011 Search PubMed.
- L. Du, T. Feng, B. Y. Zhao, D. H. Li, S. X. Cai, T. J. Zhu, F. P. Wang, X. Xiao and Q. Q. Gu, J. Antibiot., 2010, 63, 165–170 CrossRef CAS PubMed.
- T. Mosmann, J. Immunol. Methods, 1983, 65, 55–63 CrossRef CAS PubMed.
- B. W. Bolling and K. L. Parkin, Food Chem., 2009, 113, 1069–1075 CrossRef CAS.
- J. S. Park, J. S. Jung, Y. H. Jeong, J. W. Hyun, T. K. V. Le, D. H. Kim, E. C. Choi and H. S. J. Kim, Neurochemistry, 2011, 119, 909–919 CrossRef CAS PubMed.
Footnote |
| † Electronic supplementary information (ESI) available: Detailed information of ECD calculations of compound 1, HPLC-UV analysis of the extract, the UPLC-MS analysis of compounds 1–6, HRESIMS, 1D and 2D NMR spectra of compounds 1–3. CCDC 1569990. For ESI and crystallographic data in CIF or other electronic format see DOI: 10.1039/c7ra10389a |
| This journal is © The Royal Society of Chemistry 2017 |

