 Open Access Article
Interacting layered hydroxide nanosheets with KF leading to Y/Eu hydroxyfluoride, oxyfluoride, and complex fluoride nanocrystals and investigation of photoluminescence†
Jing Liab,
Xuejiao Wang *c,
Qi Zhuab,
Byung-Nam Kimd,
Xudong Sunabe and
Ji-Guang Li
 *abd
*abd
aKey Laboratory for Anisotropy and Texture of Materials (Ministry of Education), Northeastern University, Shenyang, Liaoning 110819, China
bInstitute of Ceramics and Powder Metallurgy, School of Materials Science and Engineering, Northeastern University, Shenyang, Liaoning 110819, China
cCollege of New Energy, Bohai University, Jinzhou, Liaoning 121000, China. E-mail: wangxuejiao@bhu.edu.cn; Tel: +86-416-3400708
dResearch Center for Functional Materials, National Institute for Materials Science, 1-1 Namiki, Tsukuba, Ibaraki 305-0044, Japan. E-mail: LI.Jiguang@nims.go.jp; Tel: +81-29-860-4394
eLiaoning Engineering Laboratory of Special Optical Functional Crystals, College of Environment and Chemical Engineering, Dalian University, Dalian, Liaoning 116622, China
First published on 16th November 2017
Abstract
Treating nanosheets (∼4 nm thick) of RE2(OH)5NO3·nH2O layered hydroxyl nitrate (LREH-NO3−, RE = Y0.95Eu0.05) with KF solution at a low temperature of ∼90 °C yielded F−-substituted LREH (RE2(OH)5F·nH2O), RE(OH)3−xFx hydroxyfluoride (x = 1.15–1.51), and K5RE9F32 complex fluoride depending on the F/RE molar ratio (R) used for phase conversion (R = 3![[thin space (1/6-em)]](https://www.rsc.org/images/entities/char_2009.gif) :
:![[thin space (1/6-em)]](https://www.rsc.org/images/entities/char_2009.gif) 3–200
3–200![[thin space (1/6-em)]](https://www.rsc.org/images/entities/char_2009.gif) :
:![[thin space (1/6-em)]](https://www.rsc.org/images/entities/char_2009.gif) 3). Calcining RE(OH)3−xFx of a relatively high F content (x = 1.29–1.51, R = 40
3). Calcining RE(OH)3−xFx of a relatively high F content (x = 1.29–1.51, R = 40![[thin space (1/6-em)]](https://www.rsc.org/images/entities/char_2009.gif) :
:![[thin space (1/6-em)]](https://www.rsc.org/images/entities/char_2009.gif) 3–70
3–70![[thin space (1/6-em)]](https://www.rsc.org/images/entities/char_2009.gif) :
:![[thin space (1/6-em)]](https://www.rsc.org/images/entities/char_2009.gif) 3) at 450 °C in air produced REO(3−x)/2Fx oxyfluorides, with the F/RE molar ratio close to that of the orthorhombic structured Y5O4F7 phase. Oxidation of REO(3−x)/2Fx to form REOF and even RE2O3 was observed at temperatures above ∼700 °C. The materials were characterized in depth by the combined techniques of elemental analysis, XRD, FE-SEM, TEM, FTIR, and TG to reveal the process of composition, phase, and morphology evolution, and the photoluminescent properties of the resultant hydroxyfluoride, oxyfluoride and complex fluoride were also elaborated with regard to the crystal structure of the host lattice, F content, and the temperature of calcination.
3) at 450 °C in air produced REO(3−x)/2Fx oxyfluorides, with the F/RE molar ratio close to that of the orthorhombic structured Y5O4F7 phase. Oxidation of REO(3−x)/2Fx to form REOF and even RE2O3 was observed at temperatures above ∼700 °C. The materials were characterized in depth by the combined techniques of elemental analysis, XRD, FE-SEM, TEM, FTIR, and TG to reveal the process of composition, phase, and morphology evolution, and the photoluminescent properties of the resultant hydroxyfluoride, oxyfluoride and complex fluoride were also elaborated with regard to the crystal structure of the host lattice, F content, and the temperature of calcination.
Introduction
Rare-earth fluorides normally possess a high refractive index (∼1.56), a low phonon energy (∼350–500 cm−1), and adequate thermal and environmental stability, and therefore are regarded as excellent host lattices for down- and up-conversion luminescence of lanthanide (Ln) ions.1–15 Among the investigated fluorides, the Y(OH)3−xFx hydroxyfluoride and YO(3−x)/2Fx oxyfluoride have been drawing great attention due to their significantly broader anion miscibility than their chloride and bromide counterparts of fixed anion substitution phases.16 It was also reported that Y(OH)3−xFx would decompose to YO(3−x)/2Fx and a mixture of Y2O3 and YOF when x ≥ 1 and x < 1, respectively.14,16 Aside from the benefit that the Y site of Y(OH)3−xFx and YO(3−x)/2Fx can be facilely substituted by an Ln3+ activator without additional charge compensation, the alterable OH−/F− and O2−/F− ligand molar ratio of these two types of compounds may offer great opportunities for engineering the local symmetry and crystal field strength to achieve tunable luminescence.The synthesis of Y(OH)3−xFx with changeable x value was exemplified by hydrothermal reaction under very high temperature and pressure. For example, Y(OH)3−xFx with the lower F content of 0.65 < x < 1.43 is obtainable via hydrothermally reacting Y2O3 and KF at 400 °C and 25 MPa and that with the higher F content of 1.5 < x < 2.0 can be synthesized via reacting Y2O3 and HF at 450 °C and 4 kb.16,17 Recently, RE(OH)3−xFx (RE: rare-earth) with some fixed x values (0.86, 0.98, 1.13, 1.43, and 1.90) was obtained via hydrothermal reaction at the lower temperatures of up to 220 °C,4,6,14,18 and the nano-/micro-crystals of several types of oxyfluorides (RE7O6F9, RE6O5F8, RE5O4F7, and REOF) were produced via thermolysis of precipitation products and by solid reaction.8,19,20 With these successes, the photoluminescent properties of the hydroxyfluoride and oxyfluoride products were investigated.4,6,9,11,21–23
Controlled synthesis of rare-earth compounds has also been achieved by the phase conversion technique,24–28 which generally involves the two different mechanisms of interface chemical transformation25,26 and dissolution-reprecipitation.24,27,28 The former applies when the precursor and target compound have the same crystal structure. In the course of phase conversion, the precursor serves as both a physical and chemical template and as a result the final product can well preserve the crystallite morphology of the precursor. This is evidenced by the hydrothermal conversion of hexagonal structured RE(OH)3 nanorods/nanotubes into hexagonal β-NaREF4 crystallites of the same morphology.25,26 The dissolution-reprecipitation mechanism takes the role when the precursor and final product differ in crystal structure, as shown by the evolution of LuBO3 microdiscs (hexagonal structured) upon reacting Lu4O(OH)9NO3 nanowires (monoclinic structured) with boric acid (H3BO3).24 REF3 and NaxREyFx+3y hollow spheres have also been hydrothermally converted from amorphous RE(OH)CO3 colloidal spheres in the presence of NaBF4 (ref. 27) or NaF.28
We employed in this work the phase conversion strategy to synthesize Eu3+ doped Y(OH)3−xFx with the nanosheets of RE2(OH)5NO3·nH2O layered hydroxyl nitrate (LREH-NO3−) as a new type of sacrificial precursor. The crystal structure of LREH-NO3− is constructed via alternative stacking of the [RE2(OH)5(H2O)n]+ host layer and anion-exchangeable interlayer NO3− along the c-axis ([001] direction).29 The compound received much research interest owing to the diverse and unique physicochemical properties of RE, particularly in the areas of nanosheets exfoliation via anion exchange of the parent crystals, assembly of the delaminated nanosheets into multi-functional films, and derivation of luminescent oxide powders and oriented films.29–43 Different from the traditional LREH-NO3− synthesis via reflux precipitation and hydrothermal reaction, which inevitably yield platelike thick crystals, we developed a “freezing-temperature crystallization” technique that can directly produce LREH-NO3− nanosheets of only ∼4 nm thick in an acceptable batch quantity.37 The technique was conceived from the fact that the lateral growth of LREH-NO3− crystallites needs lower activation energy than thickness growth because the hydroxide main layers are close-packed crystal planes. As a result, much thinner platelets (nanosheets) can be directly yielded by restricting the thickness growth through lowering the reaction temperature to ∼4 °C. Another distinct advantage of this technique is that it is widely applicable to the RE elements of Pr–Er in the lanthanide family (excluding radioactive Pm).37 To the best of our knowledge, however, sacrificial conversion of LREH-NO3− into fluoride compounds via reacting with KF has hardly been reported prior to us. The phase, morphology, and composition evolution during phase conversion and subsequent calcination and also the photoluminescent properties of the resultant fluoride compounds were investigated in detail.
Experimental
Reactants and materials synthesis
Eu(NO3)3·6H2O (99.95% pure) and Y(NO3)3·6H2O (99.99% pure) were purchased from Kanto Chemical Co. (Tokyo, Japan) while NH4OH solution (25%) and KF (99% pure) were purchased from Wako Pure Chemical Industries, Ltd. (Osaka, Japan).For the synthesis of RE2(OH)5NO3·nH2O layered hydroxide nanosheets (RE = Y0.95Eu0.05, hereafter referred to LREH-NO3−), 250 mL of a 0.2 mol L−1 aqueous solution of RE(NO3)3 was pre-cooled to ∼4 °C with a cool circulator, followed by dropwise addition of NH4OH aqueous solution (1 mol L−1) till pH ∼8.0.37 After aging for 1 h, the resultant suspension was suction filtrated and the precipitate was washed with deionized water two times and ethanol once, followed by drying in air at 70 °C for 24 h.
For phase conversion, a certain amount of KF was dissolved in 50 mL of deionized water at room temperature, to which 3 mmol of the as-prepared LREH-NO3− was added. The F/RE molar ratio (R) was varied in the wide range of 0–200 to investigate its effect on product property. After homogenizing under magnetic stirring for 10 min, the suspension was transferred into a capped glass tube for reaction at 90 °C for 3 h. The resultant precipitate was collected by centrifugation, washed with deionized water three times and ethanol once, followed by drying in air at 70 °C for 12 h.
REO(3−x)/2Fx oxyfluoride was obtained by thermal decomposition of the as-prepared RE(OH)3−xFx in air at a selected temperature for 2 h, with a heating rate of 5 °C min−1 at the ramp stage.
Characterization techniques
Phase identification was performed by powder X-ray diffractometry (XRD, Model RINF 2200 V/PC, Rigaku, Tokyo, Japan) under 40 kV/40 mA, using nickel-filtered Cu-Kα radiation and a scanning speed of 1° 2θ per minute. Phase constituent of the product was analysed via Rietveld fitting of the XRD pattern with the TOPAS software. Product morphology was inspected via field-emission scanning electron microscopy (FE-SEM, Model S-5000, Hitachi, Tokyo) under an acceleration voltage of 10 kV and transmission electron microscopy (TEM, model FEM-3000F, JEOL Ltd., Tokyo) under 300 kV. Topographic images of the LREH-NO3− nanosheets were acquired via atomic force microscopy (AFM, Model NanoScope IIIa, Veeco Instruments Inc., NY) in the tapping mode at the scanning rate of 1 Hz. Fourier transform infrared spectroscopy (FTIR, Model FT/IR-4200, JASCO Co. Ltd., Tokyo) was performed by the standard KBr pellet method. Thermogravimetry (TG, Model Thermo Plus TG8120, Rigaku) of the dried RE(OH)3−xFx was made in stagnant air with a heating rate of 10 °C min−1. Elemental contents of the product were determined for RE and K via inductively coupled plasma atomic emission spectroscopy (ICP-OES, Model SPS3520UV-DD, SII Nanotechnology, Kyoto, Japan) and for F via the “lanthanum/alizarin complexone (LAC)” absorptiometry technique (Model SPS3520UV-DD, SII Technologies); photoluminescence properties of the products were measured at room temperature using an FP-6500 fluorospectrophotometer, with a 150 W Xe lamp (JASCO) for excitation and with slit width of 5 nm for both excitation and emission.Results and discussion
Phase/morphology evolution and characterization of the conversion products
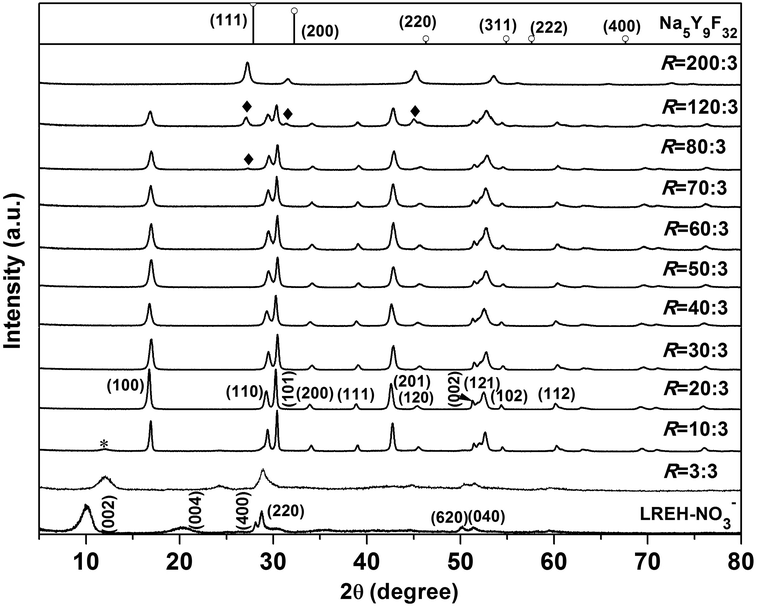
Fig. 1 shows powder XRD patterns of all the products obtained in this work. The precursor precipitated at ∼4 °C exhibits a series of 00l and non-00l diffractions that are characteristic of the orthorhombic structured LREH-NO3− compound,38,39,41,44,45 whose lattice parameters were analysed to be a ∼ 1.2699(3), b ∼ 0.7140(1), and c ∼ 1.6870(1) nm with the JADE 6.5 software. Reacting the LREH-NO3− precursor with KF under the F/RE molar ratio of R = 3![[thin space (1/6-em)]](https://www.rsc.org/images/entities/char_2009.gif) :
:![[thin space (1/6-em)]](https://www.rsc.org/images/entities/char_2009.gif) 3 yielded a product that can be assigned to the F− substituted LREH of RE2(OH)5F·nH2O (LREH-F−).37,46 Owing to the electrostatic attraction arising from strong hydrogen bonding between the interlayer F− and the hydroxyls/H2O in the adjacent hydroxide main layers, the interlayer distance (c/2) of the LREH, calculated from the centre of the 002 peak, contracted from the ∼0.844 nm of LREH-NO3− to the ∼0.740 nm of LREH-F−. Fluorination did not substantially alter the positions of the non-00l diffractions (such as 220), suggesting that the [RE2(OH)5(H2O)n]+ host layers largely remain intact since the non-00l diffractions come from the ab planes (hydroxide layers). The R = 10
3 yielded a product that can be assigned to the F− substituted LREH of RE2(OH)5F·nH2O (LREH-F−).37,46 Owing to the electrostatic attraction arising from strong hydrogen bonding between the interlayer F− and the hydroxyls/H2O in the adjacent hydroxide main layers, the interlayer distance (c/2) of the LREH, calculated from the centre of the 002 peak, contracted from the ∼0.844 nm of LREH-NO3− to the ∼0.740 nm of LREH-F−. Fluorination did not substantially alter the positions of the non-00l diffractions (such as 220), suggesting that the [RE2(OH)5(H2O)n]+ host layers largely remain intact since the non-00l diffractions come from the ab planes (hydroxide layers). The R = 10![[thin space (1/6-em)]](https://www.rsc.org/images/entities/char_2009.gif) :
:![[thin space (1/6-em)]](https://www.rsc.org/images/entities/char_2009.gif) 3 product shows diffractions that can be well indexed with hexagonal structured Y(OH)1.57F1.43 (JCPDS no. 80-2008), though a trace amount of unreacted LREH-F− was left behind (indicated with asterisk).37,46 The results thus suggest that, at R = 10
3 product shows diffractions that can be well indexed with hexagonal structured Y(OH)1.57F1.43 (JCPDS no. 80-2008), though a trace amount of unreacted LREH-F− was left behind (indicated with asterisk).37,46 The results thus suggest that, at R = 10![[thin space (1/6-em)]](https://www.rsc.org/images/entities/char_2009.gif) :
:![[thin space (1/6-em)]](https://www.rsc.org/images/entities/char_2009.gif) 3, the F− anions have replaced the water molecules and also a major portion of the hydroxyls in the hydroxide host layers of LREH-F−. The products obtained with the larger R values of 20
3, the F− anions have replaced the water molecules and also a major portion of the hydroxyls in the hydroxide host layers of LREH-F−. The products obtained with the larger R values of 20![[thin space (1/6-em)]](https://www.rsc.org/images/entities/char_2009.gif) :
:![[thin space (1/6-em)]](https://www.rsc.org/images/entities/char_2009.gif) 3–70
3–70![[thin space (1/6-em)]](https://www.rsc.org/images/entities/char_2009.gif) :
:![[thin space (1/6-em)]](https://www.rsc.org/images/entities/char_2009.gif) 3 are hexagonal structured RE(OH)3−xFx of high phase purity, which was proposed to form via the reaction of RE2(OH)5F·nH2O + (2x − 1)KF → 2RE(OH)3−xFx + (2x − 1)KOH + nH2O. The results of elemental analysis for the R = 20
3 are hexagonal structured RE(OH)3−xFx of high phase purity, which was proposed to form via the reaction of RE2(OH)5F·nH2O + (2x − 1)KF → 2RE(OH)3−xFx + (2x − 1)KOH + nH2O. The results of elemental analysis for the R = 20![[thin space (1/6-em)]](https://www.rsc.org/images/entities/char_2009.gif) :
:![[thin space (1/6-em)]](https://www.rsc.org/images/entities/char_2009.gif) 3–70
3–70![[thin space (1/6-em)]](https://www.rsc.org/images/entities/char_2009.gif) :
:![[thin space (1/6-em)]](https://www.rsc.org/images/entities/char_2009.gif) 3 products are tabulated in Table 1, where it is clearly seen that the prescribed Eu content (5 at%) was well kept to the reaction product in each case and that the F content (the x value in RE(OH)3−xFx) gradually increased from ∼1.15 to 1.51 with increasing R. It is also notable that the product contains a negligible amount of K+ in each case.
3 products are tabulated in Table 1, where it is clearly seen that the prescribed Eu content (5 at%) was well kept to the reaction product in each case and that the F content (the x value in RE(OH)3−xFx) gradually increased from ∼1.15 to 1.51 with increasing R. It is also notable that the product contains a negligible amount of K+ in each case.
| R | Proposed formula | Analysed content (wt%) | Calculated molar ratio | ||||||
|---|---|---|---|---|---|---|---|---|---|
| Y | Eu | F | K | nY![[thin space (1/6-em)]](https://www.rsc.org/images/entities/char_2009.gif) : :![[thin space (1/6-em)]](https://www.rsc.org/images/entities/char_2009.gif) nEu nEu![[thin space (1/6-em)]](https://www.rsc.org/images/entities/char_2009.gif) : :![[thin space (1/6-em)]](https://www.rsc.org/images/entities/char_2009.gif) nF nF![[thin space (1/6-em)]](https://www.rsc.org/images/entities/char_2009.gif) : :![[thin space (1/6-em)]](https://www.rsc.org/images/entities/char_2009.gif) nK nK |
|||||
20![[thin space (1/6-em)]](https://www.rsc.org/images/entities/char_2009.gif) : :![[thin space (1/6-em)]](https://www.rsc.org/images/entities/char_2009.gif) 3 3 |
RE(OH)1.85F1.15 | 55.4 | 5 | 14.3 | 0.24 | 0.95 | 0.05 | 1.15 | 0.01 |
30![[thin space (1/6-em)]](https://www.rsc.org/images/entities/char_2009.gif) : :![[thin space (1/6-em)]](https://www.rsc.org/images/entities/char_2009.gif) 3 3 |
RE(OH)1.77F1.23 | 56.1 | 5 | 15.5 | 0.22 | 0.95 | 0.05 | 1.23 | 0.01 |
40![[thin space (1/6-em)]](https://www.rsc.org/images/entities/char_2009.gif) : :![[thin space (1/6-em)]](https://www.rsc.org/images/entities/char_2009.gif) 3 3 |
RE(OH)1.71F1.29 | 55.7 | 4.9 | 16.2 | 0.37 | 0.95 | 0.05 | 1.29 | 0.01 |
50![[thin space (1/6-em)]](https://www.rsc.org/images/entities/char_2009.gif) : :![[thin space (1/6-em)]](https://www.rsc.org/images/entities/char_2009.gif) 3 3 |
RE(OH)1.65F1.35 | 55.5 | 5 | 16.9 | 0.55 | 0.95 | 0.05 | 1.35 | 0.02 |
60![[thin space (1/6-em)]](https://www.rsc.org/images/entities/char_2009.gif) : :![[thin space (1/6-em)]](https://www.rsc.org/images/entities/char_2009.gif) 3 3 |
RE(OH)1.51F1.49 | 54.7 | 4.9 | 18.3 | 0.75 | 0.95 | 0.05 | 1.49 | 0.03 |
70![[thin space (1/6-em)]](https://www.rsc.org/images/entities/char_2009.gif) : :![[thin space (1/6-em)]](https://www.rsc.org/images/entities/char_2009.gif) 3 3 |
RE(OH)1.49F1.51 | 54.3 | 4.9 | 18.4 | 0.83 | 0.95 | 0.05 | 1.51 | 0.03 |
200![[thin space (1/6-em)]](https://www.rsc.org/images/entities/char_2009.gif) : :![[thin space (1/6-em)]](https://www.rsc.org/images/entities/char_2009.gif) 3 3 |
K5RE9F32 | 43.2 | 3.9 | 32.7 | 11.2 | 8.55 | 0.45 | 30.28 | 5.04 |
Fig. 2 illustrates the lattice constants as a function of the F content for RE(OH)3−xFx. It is seen that the a parameter gradually decreases with increasing F incorporation while the c parameter keeps almost constant at ∼3.55 Å. The crystal structure of RE(OH)3−xFx is constructed through linking of each RE(O/F)9 polyhedron with three adjacent ones by edge-sharing along the a- and b-axis and with the other two by face-sharing along the c-axis,6,16 leaving a hexagonal tunnel running along the [001] direction (Fig. S1†). As the a constant is related to the metal-to-metal distance in the ab plane, the increasing hydrogen bonding (–O–H⋯F–) with increasing F− content may thus contribute to plane contraction, that is, decreasing a parameter. On the other hand, the main layers (ab planes) are perpendicular to the c direction and the sizes of OH− and F− are similar (rOH− = 0.137 and rF− = 0.133 nm for CN = 6),47 so the c parameter remains almost constant. Increasing the F/RE molar ratio to R = 200![[thin space (1/6-em)]](https://www.rsc.org/images/entities/char_2009.gif) :
:![[thin space (1/6-em)]](https://www.rsc.org/images/entities/char_2009.gif) 3 led to the crystallization of a mass that can be indexed with cubic structured Na5Y9F32 (Fig. 1; JCPDS no. 27-1428). Elemental analysis of this product found the K
3 led to the crystallization of a mass that can be indexed with cubic structured Na5Y9F32 (Fig. 1; JCPDS no. 27-1428). Elemental analysis of this product found the K![[thin space (1/6-em)]](https://www.rsc.org/images/entities/char_2009.gif) :
:![[thin space (1/6-em)]](https://www.rsc.org/images/entities/char_2009.gif) Y
Y![[thin space (1/6-em)]](https://www.rsc.org/images/entities/char_2009.gif) :
:![[thin space (1/6-em)]](https://www.rsc.org/images/entities/char_2009.gif) Eu
Eu![[thin space (1/6-em)]](https://www.rsc.org/images/entities/char_2009.gif) :
:![[thin space (1/6-em)]](https://www.rsc.org/images/entities/char_2009.gif) F molar ratio of ∼5.04
F molar ratio of ∼5.04![[thin space (1/6-em)]](https://www.rsc.org/images/entities/char_2009.gif) :
:![[thin space (1/6-em)]](https://www.rsc.org/images/entities/char_2009.gif) 8.55
8.55![[thin space (1/6-em)]](https://www.rsc.org/images/entities/char_2009.gif) :
:![[thin space (1/6-em)]](https://www.rsc.org/images/entities/char_2009.gif) 0.45
0.45![[thin space (1/6-em)]](https://www.rsc.org/images/entities/char_2009.gif) :
:![[thin space (1/6-em)]](https://www.rsc.org/images/entities/char_2009.gif) 30.2 (Table 1, Eu/(Y + Eu) = 0.05 molar ratio), which is quite close to the Na5Y9F32 analogue of K5(Y8.55Eu0.45)F32. The compound was proposed to form via the reaction of 9RE(OH)3−xFx + (32 − 9x)KF → K5RE9F32 + (27 − 9x)KOH. Analysis of this complex fluoride with the JADE 6.5 software found the lattice constant of a ∼ 0.5662(7) nm, which is larger than that of Na5Y9F32 in the standard diffraction file (a = 0.553 nm, JCPDS no. 27-1428). The larger cell parameter of K5RE9F32 is primarily owing to the fact that K+ (0.151 nm for CN = 8; CN: coordination number) is larger than Na+ (0.132 nm for CN = 8) and Eu3+ (0.1066 nm for CN = 8) is larger than Y3+ (0.1019 nm for CN = 8).47–49 The R = 80
30.2 (Table 1, Eu/(Y + Eu) = 0.05 molar ratio), which is quite close to the Na5Y9F32 analogue of K5(Y8.55Eu0.45)F32. The compound was proposed to form via the reaction of 9RE(OH)3−xFx + (32 − 9x)KF → K5RE9F32 + (27 − 9x)KOH. Analysis of this complex fluoride with the JADE 6.5 software found the lattice constant of a ∼ 0.5662(7) nm, which is larger than that of Na5Y9F32 in the standard diffraction file (a = 0.553 nm, JCPDS no. 27-1428). The larger cell parameter of K5RE9F32 is primarily owing to the fact that K+ (0.151 nm for CN = 8; CN: coordination number) is larger than Na+ (0.132 nm for CN = 8) and Eu3+ (0.1066 nm for CN = 8) is larger than Y3+ (0.1019 nm for CN = 8).47–49 The R = 80![[thin space (1/6-em)]](https://www.rsc.org/images/entities/char_2009.gif) :
:![[thin space (1/6-em)]](https://www.rsc.org/images/entities/char_2009.gif) 3 and 120
3 and 120![[thin space (1/6-em)]](https://www.rsc.org/images/entities/char_2009.gif) :
:![[thin space (1/6-em)]](https://www.rsc.org/images/entities/char_2009.gif) 3 products are clearly a phase mixture of RE(OH)3−xFx and K5RE9F32 (indicated with rhombus), indicating that under these R values the phase conversion is yet incomplete. It should be pointed out that the efforts to produce KREF4 and REF3 were failed, and one main reason is that the amount (concentration) of KF needed to completely replace the hydroxyls in RE(OH)3−xFx is so high that either KREF4 or REF3 becomes thermodynamically unstable than the K5RE9F32 phase under such conditions.
3 products are clearly a phase mixture of RE(OH)3−xFx and K5RE9F32 (indicated with rhombus), indicating that under these R values the phase conversion is yet incomplete. It should be pointed out that the efforts to produce KREF4 and REF3 were failed, and one main reason is that the amount (concentration) of KF needed to completely replace the hydroxyls in RE(OH)3−xFx is so high that either KREF4 or REF3 becomes thermodynamically unstable than the K5RE9F32 phase under such conditions.
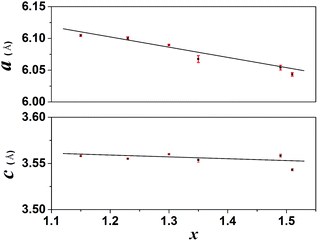 | ||
Fig. 2 Correlation of lattice parameters with the F content (x value, Table 1) for the RE(OH)3−xFx products obtained under the R values of 20![[thin space (1/6-em)]](https://www.rsc.org/images/entities/char_2009.gif) : :![[thin space (1/6-em)]](https://www.rsc.org/images/entities/char_2009.gif) 3–70 3–70![[thin space (1/6-em)]](https://www.rsc.org/images/entities/char_2009.gif) : :![[thin space (1/6-em)]](https://www.rsc.org/images/entities/char_2009.gif) 3. 3. | ||
To better understand the process of phase conversion and the characteristics of the conversion products, we performed FTIR analysis and the results are presented in Fig. 3. For the LREH-NO3− nanosheets, the sharp absorption band found at ∼1384 cm−1 is typical of the ν3 vibration of uncoordinated NO3− anions,33,50,51 while those at ∼3000–3450 cm−1 and 1641 cm−1 can be assigned to the OH stretching vibrations (ν1 and ν3) and H–O–H bending mode (ν2) of H2O molecules, respectively.52 The existence of hydroxyls (OH−) is evidenced by the absorption in the ∼3500–3750 cm−1 region. The results thus well conform to the chemical composition of LREH-NO3− (RE2(OH)5NO3·nH2O). Treating LREH-NO3− with KF solution under R = 3![[thin space (1/6-em)]](https://www.rsc.org/images/entities/char_2009.gif) :
:![[thin space (1/6-em)]](https://www.rsc.org/images/entities/char_2009.gif) 3 led to the vanishing of the NO3− absorption but did not appreciably affect the H2O and OH− vibrations. Such a result suggests that F− has substituted the interlayer NO3− of LREH-NO3− to form the LREH-F− of RE2(OH)5F·nH2O. The shallow twin bands in the ∼1300–1580 cm−1 region, which partially overlap with the NO3− vibration in the spectrum of LREH-NO3−, are characteristic of CO32− absorptions. The contamination, arising from dissolved atmospheric CO2 and the high affinity of CO32− toward RE3+, is common to all the samples synthesized in this work and is also widely observed in LREH-NO3− studies. The R = 10
3 led to the vanishing of the NO3− absorption but did not appreciably affect the H2O and OH− vibrations. Such a result suggests that F− has substituted the interlayer NO3− of LREH-NO3− to form the LREH-F− of RE2(OH)5F·nH2O. The shallow twin bands in the ∼1300–1580 cm−1 region, which partially overlap with the NO3− vibration in the spectrum of LREH-NO3−, are characteristic of CO32− absorptions. The contamination, arising from dissolved atmospheric CO2 and the high affinity of CO32− toward RE3+, is common to all the samples synthesized in this work and is also widely observed in LREH-NO3− studies. The R = 10![[thin space (1/6-em)]](https://www.rsc.org/images/entities/char_2009.gif) :
:![[thin space (1/6-em)]](https://www.rsc.org/images/entities/char_2009.gif) 3–70
3–70![[thin space (1/6-em)]](https://www.rsc.org/images/entities/char_2009.gif) :
:![[thin space (1/6-em)]](https://www.rsc.org/images/entities/char_2009.gif) 3 products exhibit FTIR absorptions agreeing with the hydroxyfluoride of RE(OH)3−xFx, with the intense and sharp band at ∼3649 cm−1, the one in the ∼743–752 cm−1 region, and the one at ∼500 cm−1 well assignable to the stretching vibrations of virtually free hydroxyls (OH−), OH− deformation,52 and νt(RE-F), respectively. The occurrence of OH− deformation vibration also implies the existence of intramolecular [O–H⋯F–] hydrogen bonding.16 The R = 200
3 products exhibit FTIR absorptions agreeing with the hydroxyfluoride of RE(OH)3−xFx, with the intense and sharp band at ∼3649 cm−1, the one in the ∼743–752 cm−1 region, and the one at ∼500 cm−1 well assignable to the stretching vibrations of virtually free hydroxyls (OH−), OH− deformation,52 and νt(RE-F), respectively. The occurrence of OH− deformation vibration also implies the existence of intramolecular [O–H⋯F–] hydrogen bonding.16 The R = 200![[thin space (1/6-em)]](https://www.rsc.org/images/entities/char_2009.gif) :
:![[thin space (1/6-em)]](https://www.rsc.org/images/entities/char_2009.gif) 3 product (K5RE9F32) exhibits absorptions arising from νt(RE–F) and H2O at the same time, which may indicate that the sample has some adsorbed water molecules. The results of FTIR, XRD, and elemental analysis are well supporting each other, and confirm the proposed pathway of phase evolution.
3 product (K5RE9F32) exhibits absorptions arising from νt(RE–F) and H2O at the same time, which may indicate that the sample has some adsorbed water molecules. The results of FTIR, XRD, and elemental analysis are well supporting each other, and confirm the proposed pathway of phase evolution.
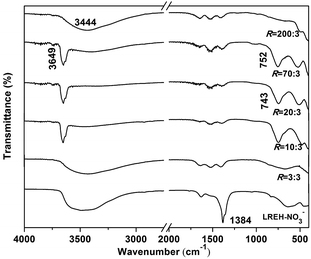 | ||
| Fig. 3 FTIR spectra for the LREH precursor and typical conversion products obtained under the different R values indicated in the figure. | ||
Fig. 4 exhibits the results of FE-SEM and TEM analysis for some representative reaction products. The LREH-NO3− precursor (R = 0) presents flower-like assembles of nanosheets with the lateral sizes of ∼300 nm and thicknesses of ∼4 nm. AFM analysis of the nanosheets (Fig. S2†) further confirmed the thickness value determined via TEM observation. The R = 3![[thin space (1/6-em)]](https://www.rsc.org/images/entities/char_2009.gif) :
:![[thin space (1/6-em)]](https://www.rsc.org/images/entities/char_2009.gif) 3 sample (the LREH-F− of RE2(OH)5F·nH2O) generally retained the overall morphology of LREH-NO3− as agglomerated nanosheets, but TEM observation found tiny holes on the individual nanosheets arising from KF corrosion. A mixture of prismatic particles (dominant) and some thin-platelets were found for the R = 10
3 sample (the LREH-F− of RE2(OH)5F·nH2O) generally retained the overall morphology of LREH-NO3− as agglomerated nanosheets, but TEM observation found tiny holes on the individual nanosheets arising from KF corrosion. A mixture of prismatic particles (dominant) and some thin-platelets were found for the R = 10![[thin space (1/6-em)]](https://www.rsc.org/images/entities/char_2009.gif) :
:![[thin space (1/6-em)]](https://www.rsc.org/images/entities/char_2009.gif) 3 product, which can be assigned to the newly formed RE(OH)3−xFx and residual LREH-F− phases, respectively, according to the results of XRD analysis (Fig. 1). The R = 20
3 product, which can be assigned to the newly formed RE(OH)3−xFx and residual LREH-F− phases, respectively, according to the results of XRD analysis (Fig. 1). The R = 20![[thin space (1/6-em)]](https://www.rsc.org/images/entities/char_2009.gif) :
:![[thin space (1/6-em)]](https://www.rsc.org/images/entities/char_2009.gif) 3 product exclusively contains dispersed short hexagonal prisms (lengths and diameters up to ∼300 and 100 nm, respectively), in coincidence with the hexagonal crystal structure of RE(OH)3−xFx (x ∼ 1.15, Table 1) and the single-phase nature of this product. HR-TEM lattice imaging well resolved the (110) crystal plane (interplanar spacing ∼0.306 nm) and showed that the prisms are elongated along the [001] crystallographic direction. Rice-grain shaped particles of up to ∼300 nm in length were produced by increasing the R value, as shown with the R = 70 sample for example (x ∼ 1.51, Table 1). TEM analysis found that the individual particles are significantly polycrystalline, which is in accordance with the fact that the powder has an average crystallite size of only ∼16 nm as assayed from the XRD pattern with the Scherrer formula. In addition, the interplanar spacing of ∼0.303 nm resolved by HR-TEM is assignable to the (110) plane of RE(OH)3−xFx. The as-prepared K5RE9F32 powder (R = 200
3 product exclusively contains dispersed short hexagonal prisms (lengths and diameters up to ∼300 and 100 nm, respectively), in coincidence with the hexagonal crystal structure of RE(OH)3−xFx (x ∼ 1.15, Table 1) and the single-phase nature of this product. HR-TEM lattice imaging well resolved the (110) crystal plane (interplanar spacing ∼0.306 nm) and showed that the prisms are elongated along the [001] crystallographic direction. Rice-grain shaped particles of up to ∼300 nm in length were produced by increasing the R value, as shown with the R = 70 sample for example (x ∼ 1.51, Table 1). TEM analysis found that the individual particles are significantly polycrystalline, which is in accordance with the fact that the powder has an average crystallite size of only ∼16 nm as assayed from the XRD pattern with the Scherrer formula. In addition, the interplanar spacing of ∼0.303 nm resolved by HR-TEM is assignable to the (110) plane of RE(OH)3−xFx. The as-prepared K5RE9F32 powder (R = 200![[thin space (1/6-em)]](https://www.rsc.org/images/entities/char_2009.gif) :
:![[thin space (1/6-em)]](https://www.rsc.org/images/entities/char_2009.gif) 3) is composed of nanospheres of up to ∼50 nm in diameter, and the resolved d-spacing of ∼0.326 nm may correspond to the (111) crystal plane. The well-resolved lattice fringes also imply good crystallinity of the products, despite of the low phase-conversion temperature of only ∼90 °C.
3) is composed of nanospheres of up to ∼50 nm in diameter, and the resolved d-spacing of ∼0.326 nm may correspond to the (111) crystal plane. The well-resolved lattice fringes also imply good crystallinity of the products, despite of the low phase-conversion temperature of only ∼90 °C.
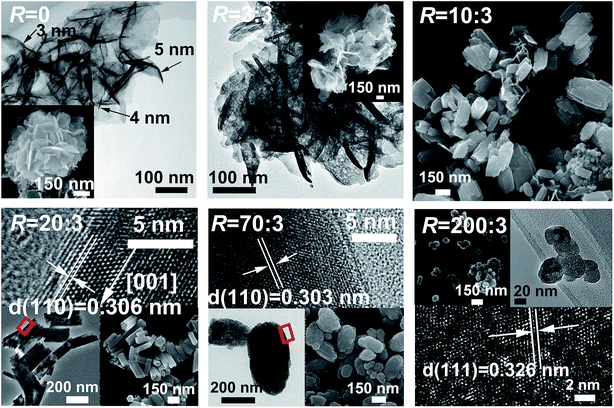 | ||
| Fig. 4 FE-SEM and TEM analysis of the products obtained under the different F/RE molar ratios (R) indicated in the figure. | ||
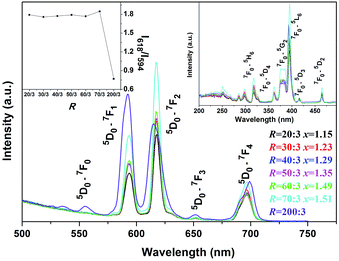
RE(OH)3−xFx, RE(OH)3, and β-NaREF4 are all hexagonal structured and present high structure similarities (Fig. S3†).5,53,54 As in RE(OH)3 and β-NaREF4, the Eu3+ activators were proposed to have C3h symmetry in RE(OH)3−xFx.5,53 The PL and PLE spectra of RE(OH)3−xFx are shown in Fig. 5 (R = 20![[thin space (1/6-em)]](https://www.rsc.org/images/entities/char_2009.gif) :
:![[thin space (1/6-em)]](https://www.rsc.org/images/entities/char_2009.gif) 3–70
3–70![[thin space (1/6-em)]](https://www.rsc.org/images/entities/char_2009.gif) :
:![[thin space (1/6-em)]](https://www.rsc.org/images/entities/char_2009.gif) 3, x = 1.15–1.51). It is seen that the hydroxyfluorides exhibit emissions at ∼594 nm (5D0 → 7F1, medium strong), 618 nm (5D0 → 7F2, strong), 652 nm (5D0 → 7F3, weak), and 697 nm (5D0 → 7F4, medium) under 395 nm excitation (the 7F0 → 5L6 excitation transition of Eu3+, Fig. 5).55–58 The stronger 5D0 → 7F2 than 5D0 → 7F1 transition conforms to the fact that the Eu3+ activators have the relatively low site symmetry of C3h in RE(OH)3−xFx.59 The PLE spectra obtained by monitoring the 618 nm main emission (Fig. 5, the right-hand inset) similarly consist of a series of sharp lines ascribed to the intra-4f6 transitions of Eu3+ as labelled in the figure. It is seen that both the emission and excitation intensities tend to increase with increasing R, which could be due to the gradually lower OH− content (higher F− content) in RE(OH)3−xFx, since hydroxyls are known to substantially quench the luminescence of rare-earth activators. The asymmetry factor of luminescence [I(5D0 → 7F2)/I(5D0 → 7F1) intensity ratio] keeps almost constant at ∼1.8 for all the hydroxyfluoride samples (Fig. 5, the left-hand inset), which further illustrates that the observed PLE/PL enhancement with increasing F incorporation is due to the decreased content of OH− rather than changed coordination environment (site symmetry) of Eu3+. K5RE9F32 has the fluorite-type cubic structure, which can be deemed as a random replacement of the Ca2+ sites of CaF2 by K+ and RE3+ ions, and is similar to that of the cubic-structured α-NaYF4 (Fig. S4†).49,60 As the Eu3+ ions in K5RE9F32 would occupy the centrosymmetric Oh lattice sites,57,61 stronger 5D0 → 7F1 emission (∼592 nm, parity allowed magnetic dipole transition) over 5D0 → 7F2 emission (∼617 nm, parity forbidden electric dipole transition) is thus observed from the PL spectrum under 395 nm excitation, and is in compliance with the less than unit (∼0.77) asymmetry factor of luminescence (Fig. 5, the left-hand inset). The PLE spectrum obtained by monitoring the 5D0 → 7F1 emission (592 nm) presents excitations essentially identical to those of the RE(OH)3−xFx hydroxyfluorides in band position, and the excitation intensity well conforms to the emission intensity.
3, x = 1.15–1.51). It is seen that the hydroxyfluorides exhibit emissions at ∼594 nm (5D0 → 7F1, medium strong), 618 nm (5D0 → 7F2, strong), 652 nm (5D0 → 7F3, weak), and 697 nm (5D0 → 7F4, medium) under 395 nm excitation (the 7F0 → 5L6 excitation transition of Eu3+, Fig. 5).55–58 The stronger 5D0 → 7F2 than 5D0 → 7F1 transition conforms to the fact that the Eu3+ activators have the relatively low site symmetry of C3h in RE(OH)3−xFx.59 The PLE spectra obtained by monitoring the 618 nm main emission (Fig. 5, the right-hand inset) similarly consist of a series of sharp lines ascribed to the intra-4f6 transitions of Eu3+ as labelled in the figure. It is seen that both the emission and excitation intensities tend to increase with increasing R, which could be due to the gradually lower OH− content (higher F− content) in RE(OH)3−xFx, since hydroxyls are known to substantially quench the luminescence of rare-earth activators. The asymmetry factor of luminescence [I(5D0 → 7F2)/I(5D0 → 7F1) intensity ratio] keeps almost constant at ∼1.8 for all the hydroxyfluoride samples (Fig. 5, the left-hand inset), which further illustrates that the observed PLE/PL enhancement with increasing F incorporation is due to the decreased content of OH− rather than changed coordination environment (site symmetry) of Eu3+. K5RE9F32 has the fluorite-type cubic structure, which can be deemed as a random replacement of the Ca2+ sites of CaF2 by K+ and RE3+ ions, and is similar to that of the cubic-structured α-NaYF4 (Fig. S4†).49,60 As the Eu3+ ions in K5RE9F32 would occupy the centrosymmetric Oh lattice sites,57,61 stronger 5D0 → 7F1 emission (∼592 nm, parity allowed magnetic dipole transition) over 5D0 → 7F2 emission (∼617 nm, parity forbidden electric dipole transition) is thus observed from the PL spectrum under 395 nm excitation, and is in compliance with the less than unit (∼0.77) asymmetry factor of luminescence (Fig. 5, the left-hand inset). The PLE spectrum obtained by monitoring the 5D0 → 7F1 emission (592 nm) presents excitations essentially identical to those of the RE(OH)3−xFx hydroxyfluorides in band position, and the excitation intensity well conforms to the emission intensity.
Phase/morphology evolution upon heating and characterization of the calcination products
The thermal behaviour of RE(OH)3−xFx was analysed via TG using the composition RE(OH)1.49F1.51 (R = 70![[thin space (1/6-em)]](https://www.rsc.org/images/entities/char_2009.gif) :
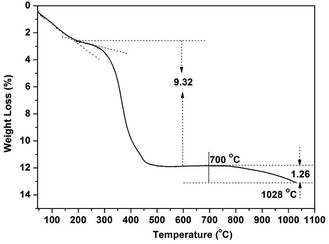
:![[thin space (1/6-em)]](https://www.rsc.org/images/entities/char_2009.gif) 3) as an example (Fig. 6). Three distinct stages of decomposition were observed for the sample, with the initial weight loss of ∼2.5 wt% owing to the evaporation of adsorbed species (such as H2O molecules, up to ∼200 °C) and the second loss of ∼9.32% (∼200–450 °C) owing to the dehydroxylation of RE(OH)1.49F1.51 to form oxyfluoride according to the equation of RE(OH)1.49F1.51 = REO0.745F1.51 + 0.745H2O. The theoretical weight loss calculated from the above equation (∼9.18 wt%) is indeed very close to the observed value of ∼9.32%. The gradual weight loss occurring at temperatures above ∼700 °C (third stage) is due to oxidation of REO0.745F1.51 to form the nominal composition of REO(0.745+y/2)F1.51−y. Taking the 1.26% of weight loss at 1028 °C for example, the y value was assayed to be ∼0.088. That is, the product at 1028 °C would have the nominal composition of REO0.789F1.422.
3) as an example (Fig. 6). Three distinct stages of decomposition were observed for the sample, with the initial weight loss of ∼2.5 wt% owing to the evaporation of adsorbed species (such as H2O molecules, up to ∼200 °C) and the second loss of ∼9.32% (∼200–450 °C) owing to the dehydroxylation of RE(OH)1.49F1.51 to form oxyfluoride according to the equation of RE(OH)1.49F1.51 = REO0.745F1.51 + 0.745H2O. The theoretical weight loss calculated from the above equation (∼9.18 wt%) is indeed very close to the observed value of ∼9.32%. The gradual weight loss occurring at temperatures above ∼700 °C (third stage) is due to oxidation of REO0.745F1.51 to form the nominal composition of REO(0.745+y/2)F1.51−y. Taking the 1.26% of weight loss at 1028 °C for example, the y value was assayed to be ∼0.088. That is, the product at 1028 °C would have the nominal composition of REO0.789F1.422.
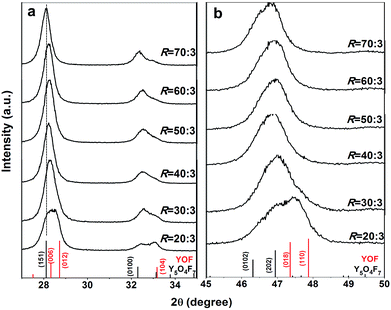
Fig. 7 exhibits XRD patterns of the products obtained by thermal decomposition of the as-prepared RE(OH)3−xFx (x = 1.15–1.51, R = 20![[thin space (1/6-em)]](https://www.rsc.org/images/entities/char_2009.gif) :
:![[thin space (1/6-em)]](https://www.rsc.org/images/entities/char_2009.gif) 3–70
3–70![[thin space (1/6-em)]](https://www.rsc.org/images/entities/char_2009.gif) :
:![[thin space (1/6-em)]](https://www.rsc.org/images/entities/char_2009.gif) 3) in air at 450 °C for 2 h. It is seen that the samples from the RE(OH)3−xFx of x = 1.29–1.51 (R = 40
3) in air at 450 °C for 2 h. It is seen that the samples from the RE(OH)3−xFx of x = 1.29–1.51 (R = 40![[thin space (1/6-em)]](https://www.rsc.org/images/entities/char_2009.gif) :
:![[thin space (1/6-em)]](https://www.rsc.org/images/entities/char_2009.gif) 3–70
3–70![[thin space (1/6-em)]](https://www.rsc.org/images/entities/char_2009.gif) :
:![[thin space (1/6-em)]](https://www.rsc.org/images/entities/char_2009.gif) 3, Table 1) can be indexed with the orthorhombic-structured Y5O4F7 phase (JCPDS no. 80-1124) while that from the least-F containing RE(OH)1.85F1.15 (x = 1.15, R = 20
3, Table 1) can be indexed with the orthorhombic-structured Y5O4F7 phase (JCPDS no. 80-1124) while that from the least-F containing RE(OH)1.85F1.15 (x = 1.15, R = 20![[thin space (1/6-em)]](https://www.rsc.org/images/entities/char_2009.gif) :
:![[thin space (1/6-em)]](https://www.rsc.org/images/entities/char_2009.gif) 3) shows peak splitting (Fig. 7a) and are assignable to a mixture of hexagonal REOF (JCPDS no. 71-2100) and RE5O4F7 phases. The calcination product of RE(OH)1.77F1.23 (R = 30
3) shows peak splitting (Fig. 7a) and are assignable to a mixture of hexagonal REOF (JCPDS no. 71-2100) and RE5O4F7 phases. The calcination product of RE(OH)1.77F1.23 (R = 30![[thin space (1/6-em)]](https://www.rsc.org/images/entities/char_2009.gif) :
:![[thin space (1/6-em)]](https://www.rsc.org/images/entities/char_2009.gif) 3) should also contain a small amount of REOF, as perceived from the existence of a right-hand tail in the amplified diffraction peak in Fig. 7b. Analysis of the phase constituent via Rietveld fitting of the XRD patterns (Fig. S5†) indeed found that the products calcined from RE(OH)1.85F1.15 and RE(OH)1.77F1.23 contain ∼44.0 (±0.6) and 11.8 (±0.5)% of the REOF phase, respectively. With the three decomposition products of R = 50–70 for example, we performed elemental analysis and the results are presented in Table 2. It is seen that the actual F content gradually increases towards a larger R, and the three RE5O4F7 phases have the deduced compositions of REO0.81F1.38 (RE5O4.05F6.90, R = 50
3) should also contain a small amount of REOF, as perceived from the existence of a right-hand tail in the amplified diffraction peak in Fig. 7b. Analysis of the phase constituent via Rietveld fitting of the XRD patterns (Fig. S5†) indeed found that the products calcined from RE(OH)1.85F1.15 and RE(OH)1.77F1.23 contain ∼44.0 (±0.6) and 11.8 (±0.5)% of the REOF phase, respectively. With the three decomposition products of R = 50–70 for example, we performed elemental analysis and the results are presented in Table 2. It is seen that the actual F content gradually increases towards a larger R, and the three RE5O4F7 phases have the deduced compositions of REO0.81F1.38 (RE5O4.05F6.90, R = 50![[thin space (1/6-em)]](https://www.rsc.org/images/entities/char_2009.gif) :
:![[thin space (1/6-em)]](https://www.rsc.org/images/entities/char_2009.gif) 3), REO0.78F1.44 (RE5O3.90F7.20, R = 60
3), REO0.78F1.44 (RE5O3.90F7.20, R = 60![[thin space (1/6-em)]](https://www.rsc.org/images/entities/char_2009.gif) :
:![[thin space (1/6-em)]](https://www.rsc.org/images/entities/char_2009.gif) 3), and REO0.755F1.49 (RE5O3.775F7.45, R = 70
3), and REO0.755F1.49 (RE5O3.775F7.45, R = 70![[thin space (1/6-em)]](https://www.rsc.org/images/entities/char_2009.gif) :
:![[thin space (1/6-em)]](https://www.rsc.org/images/entities/char_2009.gif) 3) if the trace amount of KF contaminant is ignored in each case. The slight (151) peak shifting observed in Fig. 7a could be due to the different F content of the products. In addition, the as-said RE5O4F7 products were assayed from their (151) diffractions with the Scherrer formula to have the average crystallite sizes of ∼15 ± 2 nm, not significantly affected by the R value or the actual content of F.
3) if the trace amount of KF contaminant is ignored in each case. The slight (151) peak shifting observed in Fig. 7a could be due to the different F content of the products. In addition, the as-said RE5O4F7 products were assayed from their (151) diffractions with the Scherrer formula to have the average crystallite sizes of ∼15 ± 2 nm, not significantly affected by the R value or the actual content of F.
![[thin space (1/6-em)]](https://www.rsc.org/images/entities/char_2009.gif) :
:![[thin space (1/6-em)]](https://www.rsc.org/images/entities/char_2009.gif) 3–70
3–70![[thin space (1/6-em)]](https://www.rsc.org/images/entities/char_2009.gif) :
:![[thin space (1/6-em)]](https://www.rsc.org/images/entities/char_2009.gif) 3) in air at 450 °C for 2 h
3) in air at 450 °C for 2 h
| R | Analysed content (wt%) | Derived molar ratio | x | ||||||
|---|---|---|---|---|---|---|---|---|---|
| Y | Eu | F | K | nY![[thin space (1/6-em)]](https://www.rsc.org/images/entities/char_2009.gif) : :![[thin space (1/6-em)]](https://www.rsc.org/images/entities/char_2009.gif) nEu nEu![[thin space (1/6-em)]](https://www.rsc.org/images/entities/char_2009.gif) : :![[thin space (1/6-em)]](https://www.rsc.org/images/entities/char_2009.gif) nF nF![[thin space (1/6-em)]](https://www.rsc.org/images/entities/char_2009.gif) : :![[thin space (1/6-em)]](https://www.rsc.org/images/entities/char_2009.gif) nK nK |
|||||
| 50 | 62.8 | 5.6 | 19.5 | 0.64 | 0.95 | 0.05 | 1.38 | 0.02 | 1.38 |
| 60 | 62.3 | 5.5 | 20.2 | 0.82 | 0.95 | 0.05 | 1.44 | 0.03 | 1.44 |
| 70 | 61.9 | 5.5 | 20.8 | 0.97 | 0.95 | 0.05 | 1.49 | 0.03 | 1.49 |
SEM and TEM analysis (Fig. 8) showed that the products well-retained the overall morphologies and particle sizes of their respective hydroxyfluoride parents. The particles are apparently polycrystalline in view of the crystallite size in each case. HR-TEM analysis of the REO0.755F1.49 powder (R = 70![[thin space (1/6-em)]](https://www.rsc.org/images/entities/char_2009.gif) :
:![[thin space (1/6-em)]](https://www.rsc.org/images/entities/char_2009.gif) 3) found interplanar spacings of ∼0.317 nm, which may correspond to the (151) crystal plane. The result also indicates that the oxyfluoride powder has good crystallinity despite the low calcination temperature.
3) found interplanar spacings of ∼0.317 nm, which may correspond to the (151) crystal plane. The result also indicates that the oxyfluoride powder has good crystallinity despite the low calcination temperature.
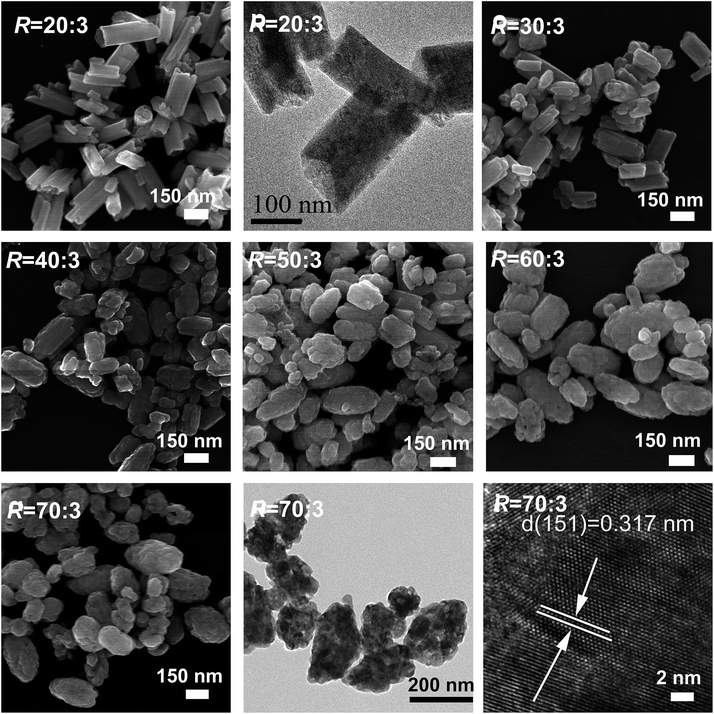 | ||
Fig. 8 FE-SEM and TEM analysis of the products calcined from RE(OH)3−xFx (x = 1.15–1.51, R = 20![[thin space (1/6-em)]](https://www.rsc.org/images/entities/char_2009.gif) : :![[thin space (1/6-em)]](https://www.rsc.org/images/entities/char_2009.gif) 3–70 3–70![[thin space (1/6-em)]](https://www.rsc.org/images/entities/char_2009.gif) : :![[thin space (1/6-em)]](https://www.rsc.org/images/entities/char_2009.gif) 3) in air at 450 °C for 2 h. 3) in air at 450 °C for 2 h. | ||
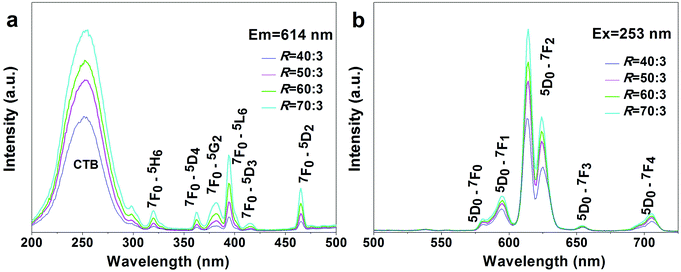
Fig. 9 shows PLE and PL spectra of the REO(3−x)/2Fx products (the said RE5O4F7 phases, x = 1.38–1.49; R = 40![[thin space (1/6-em)]](https://www.rsc.org/images/entities/char_2009.gif) :
:![[thin space (1/6-em)]](https://www.rsc.org/images/entities/char_2009.gif) 3–70
3–70![[thin space (1/6-em)]](https://www.rsc.org/images/entities/char_2009.gif) :
:![[thin space (1/6-em)]](https://www.rsc.org/images/entities/char_2009.gif) 3). The strong excitation bands of O2−–Eu3+ CTB are located with maxima at ∼253 nm, while the weaker peaks in the longer wavelength region (∼300–500 nm) can be assigned to the intra-4f6 transitions of Eu3+. Owing to the much greater energy needed to remove an electron from F− than from O2−, F−–Eu3+ CTB, which generally occurs below 200 nm in the excitation spectrum, is not present in the PLE spectra of this work. Considering that the electronegativity of F (3.98) is higher than that of O (3.44), blue-shifted CTB was initially expected for the oxyfluoride of a higher F content. The almost constant CTB centre actually observed in this work may suggest that the F− anions have not been as well coordinated to RE3+ as O2− in the molecules or the F content has not been sufficiently different to reveal the effects of ligand electronegativity. RE5O4F7 provides the approximate C4v site symmetry for the Eu3+ activator,54 and thus PL spectra dominated by the 5D0 → 7F2 electric dipole transition at ∼614 nm were yielded. The enhanced excitation and emission intensity at a higher R or F content could probably be due to improved crystallinity of the oxyfluoride by the flux effects of F− anions. With the 5D0 → 7F2 emission (614 nm) for example, the oxyfluorides have the increasing intensity ratio of 1
3). The strong excitation bands of O2−–Eu3+ CTB are located with maxima at ∼253 nm, while the weaker peaks in the longer wavelength region (∼300–500 nm) can be assigned to the intra-4f6 transitions of Eu3+. Owing to the much greater energy needed to remove an electron from F− than from O2−, F−–Eu3+ CTB, which generally occurs below 200 nm in the excitation spectrum, is not present in the PLE spectra of this work. Considering that the electronegativity of F (3.98) is higher than that of O (3.44), blue-shifted CTB was initially expected for the oxyfluoride of a higher F content. The almost constant CTB centre actually observed in this work may suggest that the F− anions have not been as well coordinated to RE3+ as O2− in the molecules or the F content has not been sufficiently different to reveal the effects of ligand electronegativity. RE5O4F7 provides the approximate C4v site symmetry for the Eu3+ activator,54 and thus PL spectra dominated by the 5D0 → 7F2 electric dipole transition at ∼614 nm were yielded. The enhanced excitation and emission intensity at a higher R or F content could probably be due to improved crystallinity of the oxyfluoride by the flux effects of F− anions. With the 5D0 → 7F2 emission (614 nm) for example, the oxyfluorides have the increasing intensity ratio of 1![[thin space (1/6-em)]](https://www.rsc.org/images/entities/char_2009.gif) :
:![[thin space (1/6-em)]](https://www.rsc.org/images/entities/char_2009.gif) 1.33
1.33![[thin space (1/6-em)]](https://www.rsc.org/images/entities/char_2009.gif) :
:![[thin space (1/6-em)]](https://www.rsc.org/images/entities/char_2009.gif) 1.50
1.50![[thin space (1/6-em)]](https://www.rsc.org/images/entities/char_2009.gif) :
:![[thin space (1/6-em)]](https://www.rsc.org/images/entities/char_2009.gif) 1.79 with the R increasing from 40
1.79 with the R increasing from 40![[thin space (1/6-em)]](https://www.rsc.org/images/entities/char_2009.gif) :
:![[thin space (1/6-em)]](https://www.rsc.org/images/entities/char_2009.gif) 3 to 70
3 to 70![[thin space (1/6-em)]](https://www.rsc.org/images/entities/char_2009.gif) :
:![[thin space (1/6-em)]](https://www.rsc.org/images/entities/char_2009.gif) 3 (Fig. 9b).
3 (Fig. 9b).
Structure stability of the oxyfluoride was studied with the most F rich hydroxyfluoride of RE(OH)1.49F1.51 (R = 70![[thin space (1/6-em)]](https://www.rsc.org/images/entities/char_2009.gif) :
:![[thin space (1/6-em)]](https://www.rsc.org/images/entities/char_2009.gif) 3) for sample, and the 450 °C product of which is REO0.755F1.49 as aforementioned. Fig. 10 shows XRD patterns of the products calcined in air at various temperatures for 2 h. It is seen that those obtained in the range of 450–700 °C can be assigned to the orthorhombic RE5O4F7 phase. Elemental analysis of the 700 °C product found the nY
3) for sample, and the 450 °C product of which is REO0.755F1.49 as aforementioned. Fig. 10 shows XRD patterns of the products calcined in air at various temperatures for 2 h. It is seen that those obtained in the range of 450–700 °C can be assigned to the orthorhombic RE5O4F7 phase. Elemental analysis of the 700 °C product found the nY![[thin space (1/6-em)]](https://www.rsc.org/images/entities/char_2009.gif) :
:![[thin space (1/6-em)]](https://www.rsc.org/images/entities/char_2009.gif) nEu
nEu![[thin space (1/6-em)]](https://www.rsc.org/images/entities/char_2009.gif) :
:![[thin space (1/6-em)]](https://www.rsc.org/images/entities/char_2009.gif) nF
nF![[thin space (1/6-em)]](https://www.rsc.org/images/entities/char_2009.gif) :
:![[thin space (1/6-em)]](https://www.rsc.org/images/entities/char_2009.gif) nK molar ratio of 0.95
nK molar ratio of 0.95![[thin space (1/6-em)]](https://www.rsc.org/images/entities/char_2009.gif) :
:![[thin space (1/6-em)]](https://www.rsc.org/images/entities/char_2009.gif) 0.05
0.05![[thin space (1/6-em)]](https://www.rsc.org/images/entities/char_2009.gif) :
:![[thin space (1/6-em)]](https://www.rsc.org/images/entities/char_2009.gif) 1.40
1.40![[thin space (1/6-em)]](https://www.rsc.org/images/entities/char_2009.gif) :
:![[thin space (1/6-em)]](https://www.rsc.org/images/entities/char_2009.gif) 0.03, and thus the chemical formula was derived to be (Y0.95Eu0.05)O0.80F1.40. The sample apparently has less F than the 450 °C product of (Y0.95Eu0.05)O0.755F1.49, indicating that slight F loss via oxidation has taken place, as also suggested by TG analysis (Fig. 6). Calcining at 900 °C led to the formation of hexagonal REOF, owing to the F loss via oxidation of RE5O4F7. Partial oxidation of REOF took place at 1100 °C, and thus a phase mixture of hexagonal REOF and trace cubic RE2O3 (JCPDS no. 43-1036) was resulted.
0.03, and thus the chemical formula was derived to be (Y0.95Eu0.05)O0.80F1.40. The sample apparently has less F than the 450 °C product of (Y0.95Eu0.05)O0.755F1.49, indicating that slight F loss via oxidation has taken place, as also suggested by TG analysis (Fig. 6). Calcining at 900 °C led to the formation of hexagonal REOF, owing to the F loss via oxidation of RE5O4F7. Partial oxidation of REOF took place at 1100 °C, and thus a phase mixture of hexagonal REOF and trace cubic RE2O3 (JCPDS no. 43-1036) was resulted.
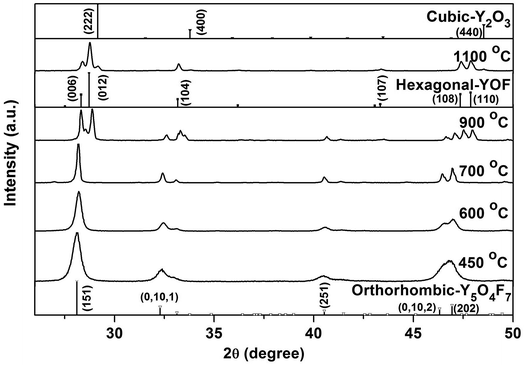 | ||
Fig. 10 Powder XRD patterns of the products calcined from Y(OH)1.49F1.51 (R = 70![[thin space (1/6-em)]](https://www.rsc.org/images/entities/char_2009.gif) : :![[thin space (1/6-em)]](https://www.rsc.org/images/entities/char_2009.gif) 3) at the various temperatures indicated in the figure. 3) at the various temperatures indicated in the figure. | ||
Fig. 11 compares excitation and emission properties of the oxyfluorides obtained by calcining RE(OH)1.49F1.51 (R = 70![[thin space (1/6-em)]](https://www.rsc.org/images/entities/char_2009.gif) :
:![[thin space (1/6-em)]](https://www.rsc.org/images/entities/char_2009.gif) 3) in air at the three temperatures of 450, 600, and 700 °C. The PLE spectra (Fig. 11a) show the O2−–Eu3+ charge transfer band (CTB) and the intra-4f6 transitions of Eu3+ as indicated in the figure. The PL spectra obtained under 255 nm excitation (Fig. 11b) show emission transitions from the 5D0 excited state to the 7FJ (J = 0–4) ground states of Eu3+ as marked in the figure, with the dominant red emission at ∼612 nm arising from the 5D0 → 7F2 forced electric dipole transition. The intensity of PL/PLE bands steadily increases with rising temperature of calcination owing to improved crystallinity of the products. The 612 nm emission, for example, has the intensity ratio of ∼1
3) in air at the three temperatures of 450, 600, and 700 °C. The PLE spectra (Fig. 11a) show the O2−–Eu3+ charge transfer band (CTB) and the intra-4f6 transitions of Eu3+ as indicated in the figure. The PL spectra obtained under 255 nm excitation (Fig. 11b) show emission transitions from the 5D0 excited state to the 7FJ (J = 0–4) ground states of Eu3+ as marked in the figure, with the dominant red emission at ∼612 nm arising from the 5D0 → 7F2 forced electric dipole transition. The intensity of PL/PLE bands steadily increases with rising temperature of calcination owing to improved crystallinity of the products. The 612 nm emission, for example, has the intensity ratio of ∼1![[thin space (1/6-em)]](https://www.rsc.org/images/entities/char_2009.gif) :
:![[thin space (1/6-em)]](https://www.rsc.org/images/entities/char_2009.gif) 1.51
1.51![[thin space (1/6-em)]](https://www.rsc.org/images/entities/char_2009.gif) :
:![[thin space (1/6-em)]](https://www.rsc.org/images/entities/char_2009.gif) 2.44 for the oxyfluorides calcined at 450, 600, and 700 °C. Increasing temperature of calcination led to slight shift of the CTB centre from ∼253 to 259 nm, which could be due to the gradually higher oxygen content (less F) of the product and the smaller electronegativity of oxygen than fluorine. It was also noticed that the intra-4f6 transitions gradually gained intensity over CTB with increasing temperature of calcination, as seen from Fig. 11a. That is, CTB dominates the excitation spectrum for the 450 °C product while the 7F0 → 5L6 intra-4f6 transition is the strongest for the 700 °C one. The phenomenon may again suggest that O2− is better coordinated to RE3+ than F− in the 450 °C product, and as a result the PLE spectrum of this sample is similar to that widely observed for the Y2O3:Eu red phosphor. Increasing temperature of calcination promotes crystallization and at the same time better coordination of F− to RE3+. As a result, CTB shows slower intensity increment than the intra-4f6 transitions since a significant mixing in of F in the (O, F)–RE bond would reduce the efficiency of charge transfer by the higher electronegativity of F. Fluorescence decay curves of the three oxyfluoride phosphors are shown in Fig. S6,† where it was found that the decay kinetics can all be well fitted with the single exponential of I = A
2.44 for the oxyfluorides calcined at 450, 600, and 700 °C. Increasing temperature of calcination led to slight shift of the CTB centre from ∼253 to 259 nm, which could be due to the gradually higher oxygen content (less F) of the product and the smaller electronegativity of oxygen than fluorine. It was also noticed that the intra-4f6 transitions gradually gained intensity over CTB with increasing temperature of calcination, as seen from Fig. 11a. That is, CTB dominates the excitation spectrum for the 450 °C product while the 7F0 → 5L6 intra-4f6 transition is the strongest for the 700 °C one. The phenomenon may again suggest that O2− is better coordinated to RE3+ than F− in the 450 °C product, and as a result the PLE spectrum of this sample is similar to that widely observed for the Y2O3:Eu red phosphor. Increasing temperature of calcination promotes crystallization and at the same time better coordination of F− to RE3+. As a result, CTB shows slower intensity increment than the intra-4f6 transitions since a significant mixing in of F in the (O, F)–RE bond would reduce the efficiency of charge transfer by the higher electronegativity of F. Fluorescence decay curves of the three oxyfluoride phosphors are shown in Fig. S6,† where it was found that the decay kinetics can all be well fitted with the single exponential of I = A![[thin space (1/6-em)]](https://www.rsc.org/images/entities/char_2009.gif) exp(−t/τR) + B, where τR, t and I denote the fluorescence lifetime, delay time and relative intensity, respectively, and A and B are constants. The phosphors calcined at 450, 600 and 700 °C were analysed to have the increasing lifetime values of 1.39 (±0.01), 2.34 (±0.01) and 2.48 (±0.01) ms and the gradually higher internal/external quantum yields (in percentage) of 33.2/15.9, 45.0/24.2 and 51.0/31.6, respectively. The successively longer fluorescence lifetime and higher quantum yield observed for a higher calcination temperature are primarily owing to the elimination of luminescence quenching defects and improved crystallinity, through crystallite growth, of the phosphor powder.
exp(−t/τR) + B, where τR, t and I denote the fluorescence lifetime, delay time and relative intensity, respectively, and A and B are constants. The phosphors calcined at 450, 600 and 700 °C were analysed to have the increasing lifetime values of 1.39 (±0.01), 2.34 (±0.01) and 2.48 (±0.01) ms and the gradually higher internal/external quantum yields (in percentage) of 33.2/15.9, 45.0/24.2 and 51.0/31.6, respectively. The successively longer fluorescence lifetime and higher quantum yield observed for a higher calcination temperature are primarily owing to the elimination of luminescence quenching defects and improved crystallinity, through crystallite growth, of the phosphor powder.
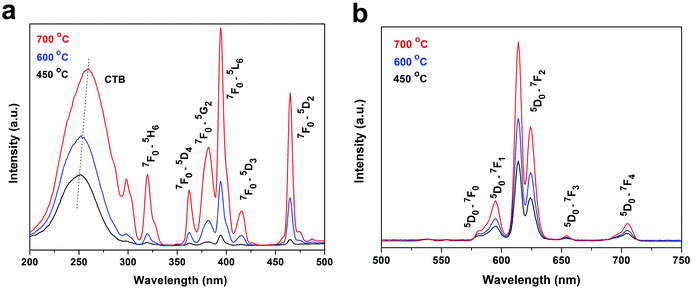 | ||
Fig. 11 PLE ((a) λem = 614 nm) and PL ((b) λex = 255 nm) spectra of the oxyfluorides calcined from Y(OH)1.49F1.51 (R = 70![[thin space (1/6-em)]](https://www.rsc.org/images/entities/char_2009.gif) : :![[thin space (1/6-em)]](https://www.rsc.org/images/entities/char_2009.gif) 3) in air the temperatures indicated in the figure. 3) in air the temperatures indicated in the figure. | ||
Conclusions
RE(OH)3−xFx hydroxyfluoride (x = 1.15–1.51) and K5RE9F32 crystals have been successfully converted from the nanosheets (∼4 nm thick) of RE2(OH)5NO3·nH2O layered hydroxyl nitrate (LREH-NO3−, RE = Y0.95Eu0.05) via reacting with KF solution at the low temperature of ∼90 °C. Calcining RE(OH)3−xFx of the relatively high F content of x = 1.29–1.51 at 450 °C in air has also produced REO(3−x)/2Fx oxyfluorides that are analogous to the orthorhombic structured Y5O4F7 phase. It was shown that the actual F content of the product is dependent on the F/RE molar ratio used for phase conversion and the temperature of subsequent calcination. Oxidation of REO(3−x)/2Fx to form REOF and even RE2O3 was observed at temperatures above ∼700 °C. The resultant hydroxyfluorides, oxyfluorides and complex fluoride were shown to exhibit photoluminescence dependent on the crystal structure of the host lattice, F content, and temperature of calcination.Conflicts of interest
There are no conflicts to declare.Acknowledgements
This work was supported in part by the National Natural Science Foundation of China (Grants No. 51672039, 51702020, and U1302272) and the Fundamental Research Funds for the Central Universities (Grants N160204008). Jing Li was funded by the China Scholarship Council (Grant No. 201206080059) during this work.References
- J. L. Zhuang, L. F. Liang, H. H. Y. Sung, X. F. Yang, M. M. Wu, I. D. Williams, S. H. Feng and Q. Su, Inorg. Chem., 2007, 46, 5404–5410 CrossRef CAS PubMed.
- M. Y. Ding, C. H. Lu, L. H. Cao, J. B. Song, Y. Ni and Z. Z. Xu, J. Mater. Sci., 2013, 48, 4989–4998 CrossRef CAS.
- J. X. Fu, X. H. Fu, C. M. Wang, X. F. Yang, J. L. Zhuang, G. G. Zhang, B. Y. Lai, M. M. Wu and J. Wang, Eur. J. Inorg. Chem., 2013, 1269–1274 CrossRef CAS.
- B.-Q. Liu, K. Guo, J. Wang, Z.-J. Zhang, Y. Tao, Y. Huang and J.-T. Zhao, Mater. Lett., 2013, 100, 245–247 CrossRef CAS.
- J. L. Zhuang, X. F. Yang, J. X. Fu, C. L. Liang, M. M. Wu, J. Wang and Q. Su, Cryst. Growth Des., 2013, 13, 2292–2297 CAS.
- X. H. He and B. Yan, CrystEngComm, 2015, 17, 621–627 RSC.
- D.-Q. Zhang, T.-Y. Sun, X.-F. Yu, Y. Jia, M. Chen, J.-H. Wang, H. Huang and P. K. Chu, Mater. Res. Bull., 2014, 52, 122–127 CrossRef CAS.
- H. Wagata, T. Wakabayashi, S. Suzuki, M. Tanaka, H. Nishikiori, S. Oishi and K. Teshima, Cryst. Growth Des., 2013, 13, 1187–1192 CAS.
- Y. Zhang, D. L. Geng, X. J. Kang, M. M. Shang, Y. Wu, X. Li, H. Z. Lian, Z. Y. Cheng and J. Lin, Inorg. Chem., 2013, 52, 12986–12994 CrossRef CAS PubMed.
- L. S. Liu, H. H. Chen, B. Q. Liu, H. Zhang, B. Tang, X. J. Feng, Z. J. Sun and J. T. Zhao, J. Rare Earths, 2014, 32, 686–690 CrossRef.
- L. Tao, W. Xu, Y. S. Zhu, L. Xu, H. C. Zhu, Y. X. Liu, S. Xu, P. W. Zhou and H. W. Song, J. Mater. Chem. C, 2014, 2, 4186–4195 RSC.
- M. Y. Ding, D. Q. Chen, Z. Y. Wan, Y. Zhou, J. S. Zhong, J. H. Xi and Z. G. Ji, J. Mater. Sci., 2015, 50, 6779–6785 CrossRef CAS.
- E. Martinez-Castro, J. Garcia-Sevillano, F. Cusso and M. Ocana, J. Alloys Compd., 2015, 619, 44–51 CrossRef CAS.
- B. Q. Shao, Q. Zhao, W. Z. Lv, M. M. Jiao, W. Lue and H. P. You, Adv. Opt. Mater., 2015, 3, 583–592 CrossRef CAS.
- H.-X. Mai, Y.-W. Zhang, R. Si, Z.-G. Yan, L.-D. Sun, L.-P. You and C.-H. Yan, J. Am. Chem. Soc., 2006, 128, 6426–6436 CrossRef CAS PubMed.
- H. Nishizawa, K. Okumoto and T. Mitsushio, J. Solid State Chem., 1991, 92, 370–379 CrossRef CAS.
- A. Marbeuf, G. Demazeau, S. Turrell and P. Hagenmuller, J. Solid State Chem., 1971, 3, 637–641 CrossRef CAS.
- L. Tian, W. T. Jiang, Q. L. Sun and J. Liu, J. Rare Earths, 2012, 30, 378–382 CrossRef CAS.
- Y. Zhang, X. J. Li, D. L. Geng, M. M. Shang, H. Z. Lian, Z. Y. Cheng and J. Lin, CrystEngComm, 2014, 16, 2196–2204 RSC.
- M. Ma, C. F. Xu, L. W. Yang, G. Z. Ren, J. G. Lin and Q. B. Yang, Phys. B, 2011, 406, 3256–3260 CrossRef CAS.
- R. Q. Li, Y. Liu, N. N. Zhang, L. L. Li, L. Liu, Y. M. Liang and S. C. Gan, J. Mater. Chem. C, 2015, 3, 3928–3934 RSC.
- B. Q. Liu, L. S. Liu, K. Guo, J. Wang, L. L. Zhu, H. Zhang, W. Wen, T. Y. Yang and J. T. Zhao, J. Rare Earths, 2013, 31, 745–749 CrossRef CAS.
- L. N. Guo, Y. H. Wang, L. L. Han, Q. P. Qiang, W. Zeng, Z. H. Zou, B. Wang and X. X. Guo, J. Mater. Chem. C, 2013, 1, 7952–7962 RSC.
- G. Jia, H. P. You, Y. H. Song, J. J. Jia, Y. H. Zheng, L. H. Zhang, K. Liu and H. J. Zhang, Inorg. Chem., 2009, 48, 10193–10201 CrossRef CAS PubMed.
- Z. H. Xu, C. X. Li, P. P. Yang, C. M. Zhang, S. S. Huang and J. Lin, Cryst. Growth Des., 2009, 9, 4752–4758 CAS.
- F. Zhang and D. Y. Zhao, ACS Nano, 2009, 3, 159–164 CrossRef CAS PubMed.
- J. Xu, S. L. Gai, P. A. Ma, Y. L. Dai, G. X. Yang, F. He and P. P. Yang, J. Mater. Chem. B, 2014, 2, 1791–1801 RSC.
- Y. H. Han, S. L. Gai, P. A. Ma, L. Z. Wang, M. L. Zhang, S. H. Huang and P. P. Yang, Inorg. Chem., 2013, 52, 9184–9191 CrossRef CAS PubMed.
- F. X. Geng, R. Z. Ma and T. Sasaki, Acc. Chem. Res., 2010, 43, 1177–1185 CrossRef CAS PubMed.
- X. L. Wu, J.-G. Li, J. K. Li, Q. Zhu, X. D. Li, X. D. Sun and Y. Sakka, Sci. Technol. Adv. Mater., 2013, 14, 015006 CrossRef PubMed.
- X. L. Wu, J.-G. Li, D.-H. Ping, J. K. Li, Q. Zhu, X. D. Li, X. D. Sun and Y. Sakka, J. Alloys Compd., 2013, 559, 188–195 CrossRef CAS.
- Q. Zhu, J.-G. Li, R. Z. Ma, T. Sasaki, X. J. Yang, X. D. Li, X. D. Sun and Y. Sakka, J. Solid State Chem., 2012, 192, 229–237 CrossRef CAS.
- Q. Zhu, J.-G. Li, C. Y. Zhi, X. D. Li, X. D. Sun, Y. Sakka, D. Golberg and Y. Bando, Chem. Mater., 2010, 22, 4204–4213 CrossRef CAS.
- Q. Zhu, J.-G. Li, X. D. Li, X. D. Sun, Y. Qi, M. Y. Zhu and Y. Sakka, Sci. Technol. Adv. Mater., 2014, 15, 014203 CrossRef PubMed.
- Q. Zhu, J. G. Li, C. Zhi, R. Ma, T. Sasaki, J. X. Xu, C. H. Liu, X. D. Li, X. D. Sun and Y. Sakka, J. Mater. Chem., 2011, 21, 6903–6908 RSC.
- L. F. Hu, R. Z. Ma, T. C. Ozawa and T. Sasaki, Chem.–Asian J., 2010, 5, 248–251 CrossRef CAS PubMed.
- X. L. Wu, J.-G. Li, Q. Zhu, W. G. Liu, J. Li, X. D. Li, X. D. Sun and Y. Sakka, J. Mater. Chem. C, 2015, 3, 3428–3437 RSC.
- F. X. Geng, Y. Matsushita, R. Z. Ma, H. Xin, M. Tanaka, N. Iyi and T. Sasaki, Inorg. Chem., 2009, 48, 6724–6730 CrossRef CAS PubMed.
- K.-H. Lee and S.-H. Byeon, Eur. J. Inorg. Chem., 2009, 929–936 CrossRef CAS.
- K.-H. Lee and S.-H. Byeon, Eur. J. Inorg. Chem., 2009, 4727–4732 CrossRef CAS.
- L. J. McIntyre, L. K. Jackson and A. M. Fogg, Chem. Mater., 2008, 20, 335–340 CrossRef CAS.
- Y. S. Zhao, J.-G. Li, M. X. Guo and X. J. Yang, J. Mater. Chem. C, 2013, 1, 3584–3592 RSC.
- X. L. Wu, J.-G. Li, Q. Zhu, J. K. Li, R. Z. Ma, T. Sasaki, X. D. Li, X. D. Sun and Y. Sakka, Dalton Trans., 2012, 41, 1854–1861 RSC.
- S. A. Hindocha, L. J. McIntyre and A. M. Fogg, J. Solid State Chem., 2009, 182, 1070–1074 CrossRef CAS.
- L. J. McIntyre, T. J. Prior and A. M. Fogg, Chem. Mater., 2010, 22, 2635–2645 CrossRef CAS.
- J. Li, J.-G. Li, Q. Zhu and X. Sun, Mater. Des., 2016, 112, 207–216 CrossRef CAS.
- R. D. Shannon, Acta Crystallogr., Sect. A: Cryst. Phys., Diffr., Theor. Gen. Crystallogr., 1976, 32, 751–767 CrossRef.
- J. Wen, L. Ning, C.-K. Duan, Y. Chen, Y. Zhang and M. Yin, J. Phys. Chem. C, 2012, 116, 20513–20521 CAS.
- S. L. Gai, G. X. Yang, X. B. Li, C. X. Li, Y. L. Dai, F. He and P. P. Yang, Dalton Trans., 2012, 41, 11716–11724 RSC.
- W. L. Li, Q. Y. Gu, F. F. Su, Y. H. Sun, G. B. Sun, S. L. Ma and X. J. Yang, Inorg. Chem., 2013, 52, 14010–14017 CrossRef CAS PubMed.
- Q. Zhu, J.-G. Li, X. D. Li, Y. Qi and X. D. Sun, RSC Adv., 2015, 5, 64588–64595 RSC.
- K. Nakamoto, Infrared and Raman Spectra of Inorganic and Coordination Compounds, John Wiley & Sons, Inc., New Jersey, 6th edn, 2009 Search PubMed.
- Q. G. Zeng, Z. J. Ding, Z. M. Zhang and Y. Q. Sheng, J. Phys. Chem. C, 2010, 114, 4895–4900 CAS.
- S. Fujihara, S. Koji, Y. Kadota and T. Kimura, J. Am. Ceram. Soc., 2004, 87, 1659–1662 CrossRef CAS.
- D. Zakaria, R. Mahiou, D. Avignant and M. Zahir, J. Alloys Compd., 1997, 257, 65–68 CrossRef CAS.
- Z.-G. Wei, L.-D. Sun, X.-C. Jiang, C.-S. Liao and C.-H. Yan, Chem. Mater., 2003, 15, 3011–3017 CrossRef CAS.
- F. Wang, X. P. Fan, D. B. Pi and M. Q. Wang, Solid State Commun., 2005, 133, 775–779 CrossRef CAS.
- B. R. Judd, Phys. Rev., 1962, 127, 750–761 CrossRef CAS.
- Z. H. Xu, C. X. Li, P. P. Yang, C. M. Zhang, S. Huang and J. Lin, Cryst. Growth Des., 2009, 9, 4752–4758 CAS.
- P. Ghosh and A. Patra, J. Phys. Chem. C, 2008, 112, 3223–3231 CAS.
- G. K. Liu, Chem. Soc. Rev., 2015, 44, 1635–1652 RSC.
Footnote |
| † Electronic supplementary information (ESI) available. See DOI: 10.1039/c7ra10508h |
| This journal is © The Royal Society of Chemistry 2017 |

