 Open Access Article
Investigation of kinetics of tetrabutylammonium chloride (TBAC) + CH4 semiclathrate hydrate formation
Lingli Shi abc and
Deqing Liang
 *abc
*abc
aCAS Key Laboratory of Gas Hydrate, Guangzhou Institute of Energy Conversion, Chinese Academy of Sciences, Guangzhou 510640, China
bGuangdong Provincial Key Laboratory of New and Renewable Energy Research and Development, Guangzhou 510640, China
cGuangzhou Center for Gas Hydrate Research, Chinese Academy of Sciences, Guangzhou 510640, China. E-mail: liangdq@ms.giec.ac.cn; Fax: +86 2087057669
First published on 22nd November 2017
Abstract
For potential application in advanced gas storage at moderate temperatures, a systematic study on tetrabutylammonium chloride (TBAC) + CH4 semiclathrate hydrate formation kinetics was conducted using isobaric kinetics measurements to evaluate the effects of pressure (6.0, 3.0 MPa), temperature (278 K, subcooling degree of 6 K), and salt concentration (0.10, 0.20, 0.30, 0.34, 0.45 mass fraction). The results revealed that the systems showed shorter induction time, higher normalized gas consumption and higher rapid growth rate under a higher supersaturation environment, represented by higher pressure or lower temperature. Besides, the effect of salt concentration was complicated. With the increase of salt concentration, the total gas consumption was almost the same while the normalized gas consumption decreased greatly, indicating that the amount of CH4 trapped in the hydrate unit greatly decreased and the system with low salt concentration was a good choice for advanced gas storage. In addition, a Raman device was employed to reveal the structural properties. The spectra showed that the (TBAC + CH4) semiclathrate hydrates were formed with hexagonal structure or tetragonal structure under different salt concentrations, which were different from the structures of pure TBAC hydrate. It was assumed that at low salt concentrations the addition of CH4 induced the formation of hexagonal structure since it had three 512 cages per TBAC which was higher than that of the tetragonal structure.
1. Introduction
Clathrate hydrate is one kind of nonstoichiometric crystalline inclusion compound. It comprises a water lattice held together through hydrogen bonding with guest molecules of gases (such as CH4, CO2, or N2) or some volatile liquids (such as tetrahydrofuran, acetone).1 Generally, the structures of simple clathrate hydrates are mainly categorized into three structures, namely structure I with space group Pm3n, structure Π with space group Fd3m, and structure H with space group P6/mmm, which are formed depending on the size, shape and nature of the accommodated guest species. In cases where the guest molecules are large ionic molecules, such as tetrabutylammonium salts (TBAX, X= F/Cl/Br) and tetrabutylphosphonium salts, the guest cations are encaged in the four cage-fused cage composed by tetrakaidecahedron cages (T, 51262) and pentakaidecahedron cages (P, 51263), and the anions can replace the water molecules in the hydrate cage.2–5 The dodecahedron cages (D, 512) are vacant to trap guest gas molecules. Thus this kind of ionic clathrate hydrate, known as semiclathrate hydrate (SCH), shows many special features, such as cohost inclusion and improved thermal stability, due to the ionic interaction between host and guest molecules.6 Recently, SCH has been studied as a more promising medium as compared with ordinary clathrate hydrate for many engineering practices, such as gas separation/storage/transportation,7–20 seawater desalination,21 and cold energy storage.22–25SCHs of TBAX (X = F/Cl/Br) were first founded by Fowler et al.26 in 1940 and structurally determined by Jeffery27 in 1969. They were reported to be stable at temperatures above 273 K and the most common structures of SCHs were hexagonal structure-I (HS-I), tetragonal structure-I (TS-I) and cubic superstructure-I (CSS-I) with unit cell formula of 2P·2T·3D·40H2O, 4P·16T·10D·172H2O, and 48T·16D·368H2O, respectively.4 Rodionova et al.3 reported that according to different salt concentrations TBAB, TBAC and TBAF SCHs were formed on the basis of HS-I/TS-I, TS-I, and TS-I/CSS-I, respectively. As compared with some other known thermodynamic promoters, such as tetrahydrofuran (THF), TBAX (X = F/Cl/Br) were more attractive because of their non-volatile property, which could ensure the gas phase uncontaminated and the SCH forming process reversible.
In recent years, many researchers have reported that TBAX (X = F/Cl/Br) could remarkably enhance the stability of gas hydrate by greatly lowering the equilibrium pressure and increasing the equilibrium temperature.28–35 While regarding the formation kinetics which were more important for industrial applications, only some limited experiments have been carried out. Among TBAX (X = F/Cl/Br), TBAB was most investigated. In 2013, Roosta et al.36 reported that TBAB could increase the CH4 hydrate formation rate. In 2014, Zhang et al.14 studied the formation kinetics of (TBAB + CO2) SCHs at mass fraction = (0.05 and 0.10), and the results revealed that the moles of formed SCHs and the formation rates both increased with the increase of subcooling degree. In 2016, Verrent et al.37 investigated the hydrate growth of (TBAB + CO2) at 0.40 salt mass fraction. However, as compared to TBAB, TBAC was reported to give a higher pressure reduction for N2/CO2 hydrate formation and a similar pressure reduction for CH4 hydrate formation.38 To our best knowledge, most of studies related with TBAC were focused on the thermodynamic properties. While considering the structural properties, only a limited data were reported in the open literature.4,39–41 Kim et al. presented the PXRD patterns of (TBAC + CO2) SCHs and (TBAC + CO2 + N2) SCHs.39,40 Oshima et al.41 studied crystallographic properties of (TBAB + TBAC) SCHs through PXRD measurement, and the result demonstrated that the double SCHs were formed with structure of tetragonal one (P4/mmm or P4/m) or orthorhombic one (Pmma) at different salt concentrations. However, these achievements of TBAC did not involve the formation kinetics which were important for hydrate-based applications. This literature review indicated an imperative need for studying the kinetics of TBAC SCHs with varying mass fractions to understand and develop uses of hydrates, including designing effective processes.
In this work, we studied the formation kinetics of double (TBAC + CH4) SCHs to determine the effects of TBAC concentration, pressure and temperature on the hydrate nucleation, hydrate growth and gas storage capacity. In addition, the Raman spectroscopy was employed to analyze the hydrate structure and identify the molecular behavior.
2. Experimental section
2.1 Experimental materials
TBAC (0.98 mass fraction, Tokyo Chemical Industry Co., Ltd.), and CH4 (0.999 mole fraction, Guangzhou Shiyuan Gases Co., Ltd.) were purchased and used without further treatment. Deionized water made in the laboratory, after careful degassing, and TBAC were weighed on an electronic balance with the uncertainty of ± 0.01 g to prepare desired TBAC aqueous solution with w (TBAC mass fraction) = (0.10, 0.20, 0.30, 0.34, and 0.45).2.2 Experimental apparatus
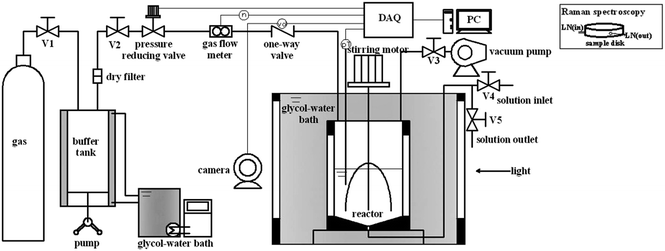
A schematic diagram of the experimental apparatus used for the measurements of hydrate formation kinetics was shown in Fig. 1. The apparatus mainly consisted of a hydrate formation reactor with a stirrer driven by a DC motor, a glycol–water bath, a pressure reducing valve (ER5000SI-1, Tescom), a gas flow meter (EL-FLOW Digital, Bronkhorst), and a data acquisition system (DAQ). The reactor, the core of the apparatus, was made of stainless steel with inner volume of approximately 307 cm3. The glycol–water bath, equipped with two see-through quartz windows (16 mm × 80 mm each), allowed lighting inside the reactor and making video documentation during hydrate formation process. The pressure reducing valve and the gas flow meter were used to maintain a constant pressure with a precision of ±0.5% relative and record the consumed gas, respectively. The temperature and pressure of the system were measured by a platinum resistance with an uncertainty of ±0.1 K and a pressure transducer with an uncertainty of ± 0.024 MPa, respectively. All the data of temperature, pressure, gas consumption, and process video were collected through the DAQ and saved at preset sampling intervals on a computer.2.3 Experimental procedures
3. Results and discussion
3.1 Formation kinetics of (TBAB + CH4) hydrate
To fully understand the effect of TBAC on CH4 hydrate formation kinetics, the experiment was conducted with w varying from (0.10 to 0.45) at P = (6.0 and 3.0) MPa under different temperature conditions (ΔT = 6 K, or T = 278.15 K). Table 1 and Fig. 3 showed the experimental conditions as well as equilibrium data of double (TBAC + CH4) SCHs.43–45 It could be seen that the experimental temperatures were higher than the equilibrium temperatures of pure CH4 hydrate at the same pressure. Hence it could provide a more economical method for hydrated based gas storage. The formation process could be generally divided into three sections: nucleation process, rapid growth process and slow growth process. Thus the investigated parameters included induction time (IT), normalized gas consumption (NGC), hydrate rapid growth time (RGT) and hydrate rapid growth rate (RGR). It was well-known that systems with a higher ΔT and higher P, indicating a higher driving force, were expected to show a better kinetic performance.| Code | w | P/MPa | T/K | Teq/K | Code | w | P/MPa | T/K | Teq/K |
|---|---|---|---|---|---|---|---|---|---|
| a Teq was the equilibrium data reported in the open literature. | |||||||||
| A1 | 0.10 | 6.0 | 283.90 | 289.9 | C3 | 0.30 | 3.0 | 284.35 | 290.35 |
| A2 | 0.10 | 6.0 | 278.15 | 289.9 | C4 | 0.30 | 3.0 | 278.15 | 290.35 |
| A3 | 0.10 | 3.0 | 281.10 | 287.1 | D1 | 0.34 | 6.0 | 287.20 | 293.2 |
| A4 | 0.10 | 3.0 | 278.15 | 287.1 | D2 | 0.34 | 6.0 | 278.15 | 293.2 |
| B1 | 0.20 | 6.0 | 286.50 | 292.5 | D3 | 0.34 | 3.0 | 284.60 | 290.6 |
| B2 | 0.20 | 6.0 | 278.15 | 292.5 | D4 | 0.34 | 3.0 | 278.15 | 290.6 |
| B3 | 0.20 | 3.0 | 283.70 | 289.7 | E1 | 0.45 | 6.0 | 286.30 | 292.3 |
| B4 | 0.20 | 3.0 | 278.15 | 289.7 | E2 | 0.45 | 6.0 | 278.15 | 292.3 |
| C1 | 0.30 | 6.0 | 286.90 | 292.9 | E3 | 0.45 | 3.0 | 283.65 | 289.65 |
| C2 | 0.30 | 6.0 | 278.15 | 292.9 | E4 | 0.45 | 3.0 | 278.15 | 289.65 |
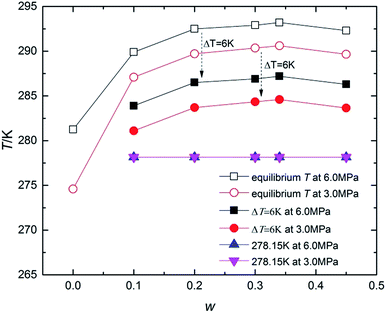 | ||
| Fig. 3 Kinetic experimental conditions represented on the T-w curve along with reported equilibrium conditions. | ||
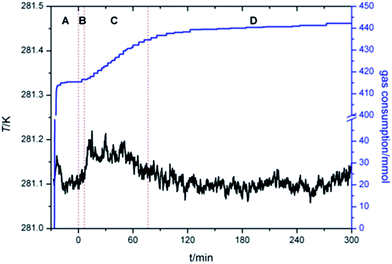
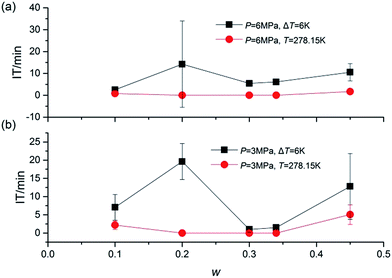
Fig. 4 presented the IT of hydrate nucleation process for systems at various w, P and T. The IT was caused by the fact that a supersaturation environment was needed for the hydrate formation. The supersaturation environment was dependent on the pressure and temperature differences between the equilibrium conditions and the operation conditions. In the present study, IT was calculated as the time elapsed from the beginning of the stirring until a significant temperature increase was detected in the system, which could also be confirmed with the assistant of visual observation through the see-through quartz windows. As shown in Fig. 4, under the same ΔT or T, systems with higher P showed shorter IT. And under the same P, systems with lower T also showed shorter IT. While considering the effect of TBAC, IT did not show a regular trend with the increase of w. The stochastic property of IT performed strongly in systems with w = 0.20. It should be noted that in systems of (B2, B4, C2, C4, D2 and D4), the hydrate formation had started before the start of stirring, then the IT was set to be 0 in these systems. The readings of stirring were shown only on the digital screen and not collected through DAQ, thus the curve could not be provided. In the future study, the readings would be added in the experimental apparatus. The obvious drawback was the fact that the formation of SCHs seriously hindered the start of stirring. Then it prevented the CH4 molecules from going into the test fluid and forming double (TBAC + CH4) SCHs. Thus the prior formation of SCH and unable start of stirring led to the reduction in methane capture. From this viewpoint, the systems with rather long or short IT were not the good choice for industrial applications, since the long IT would cause financial loss and the extremely short IT might lead to the unable start of stirring and the decreased gas storage amount.
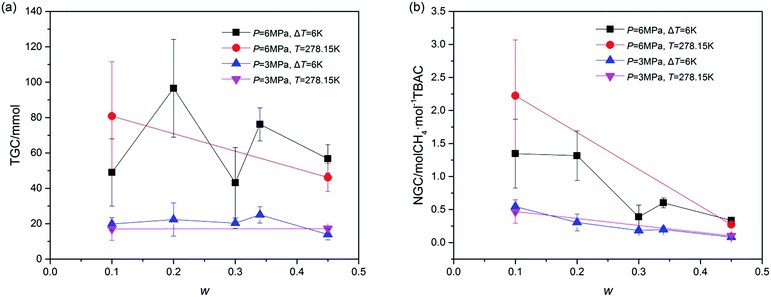
Total gas consumption (TGC) was the parameter of hydrate growth process (shown as section C and D in Fig. 2) and collected with the gas flow meter. As shown in Fig. 5, despite of systems in which stirring was blocked at first, systems with same P showed similar TGC, and it had little difference with the change of w. Besides, TGC of systems with P = 6.0 MPa was two times higher than that of systems with P = 3.0 MPa. In complement with the data of TGC, normalized gas consumption (NGC) was calculated with TGC and the moles of added TBAC (nTBAC) which was collected with the test solutions, as shown in eqn (1). Its unit was molCH4 mol−1TBAC.
| NGC = TGC/nTBAC | (1) |
Different from the calculation of NGC with moles of consumed gas and water reported in refs,46,47 the calculation of NGC in the present study was proposed due to the fact that the amount of TBAC was the main factor affecting the hydrate forming amount in our systems. According to the structural parameters (10D·5TBAC·150H2O, V = 7.048 × 10⁻²⁷ m3) reported by Rodionova et al.,3 the storage capacity of (TBAC + CH4) hydrate should be 2 molCH4 mol−1TBAC (namely 52.768 m−3CH4 m3SCH)48 with TS-I structure. It should be noted that the NGC of A2 was higher than 2 molCH4 mol−1TBAC. This might be caused by the structure of SCH, which would be checked and discussed in the next Section 3.2. From Fig. 5, it could be seen that the effects of P and T on NGC were similar to those on TGC. But considering the effect of w, it was greatly different. With the increase of w, NGC continuously decreased. Considering the fact that in all systems only double (TBAC + CH4) SCH was formed, this phenomenon revealed that with the increase of w, the amount of CH4 trapped in the unit cell of SCH continuously decreased, indicating that the cage occupancy decreased. Thus the system with high w, showing good stabilization effect in thermodynamics, did not perform well in gas storage, and the system with low salt concentration was a good choice for advanced gas storage. Besides, Fig. 5 illustrated that the gas consumption parameters were affected more by pressure than by temperature, thus for systems with same w, pressure was a key parameter for gas consumption. Since the gas consumption was affected by the experimental conditions, systems with TBAB reported in open literature could not be compared with the systems in this study. Thus the comparison of systems with different SCH formers under the same experimental conditions would be the subject of future study.
Furthermore, the rapid growth stage of hydrate growth process was studied in addition to understanding the hydrate formation kinetics. The process, shown as section C in Fig. 2, began from the end of the nucleation and ended at the point in which the slope of the plotted gas consumption-t curve sharply changed. In this section, the hydrate was formed evenly and quickly, represented by the constant slope of (gas consumption-t) curve. Thus the rapid growth time (RGT) and rapid growth rate (RGR) were chosen to illustrate this stage. As shown in Fig. 6, the RGT of systems with P = 6.0 MPa and ΔT = 6 K were relatively long under different w, while in systems with P = 3.0 MPa, the RGT became shorter with the increase of w. Besides, the RGR was also an important parameter. As illustrated in Fig. 6, the RGR decreased vary slightly with the increase of w in each system. And the effect of T on RGR was larger in systems with P = 6.0 MPa than that in systems with P = 3.0 MPa. Fig. 6 revealed that the hydrate rapid growth process, different from gas consumption parameters, was affected more by temperature than by pressure. In other words, to improve the gas rapid growth process, temperature was a key parameter. In addition, these data suggested that the under the conditions of ΔT = 6 K and T = 278.15 K, the running time for hydrate growth would be better within (40 to 100) min and (30 to 60) min, respectively.
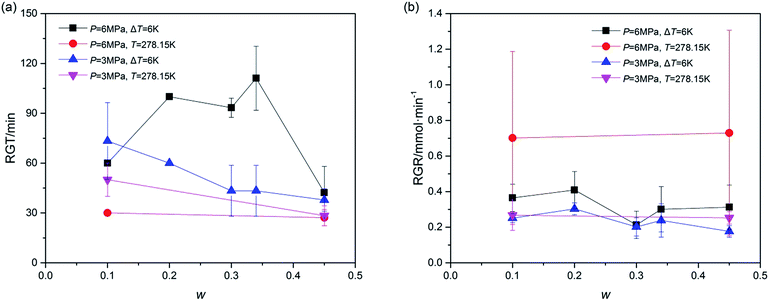 | ||
| Fig. 6 Rapid growth process of TBAC + CH4 hydrate: (a), rapid growth time (RGT); (b), rapid growth rate (RGR). The error bars indicated the standard deviations of each system. | ||
3.2 Structural analysis of (TBAC + CH4) hydrate
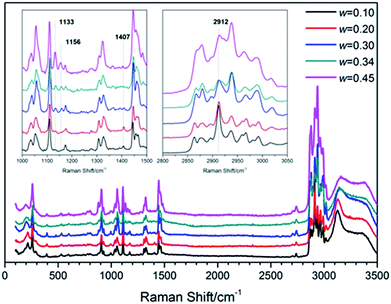
To understand the structure and molecular behavior of (TBAC + CH4) SCHs, Raman measurement was carried out. Fig. 7 presented the Raman spectra of (TBAC + CH4) hydrate samples. It could be seen that one peak appeared at 2912 cm−1. In 2016, Jin et al.,49 reported the Raman spectra of TBAB hydrate. The peak around 2912 cm−1, corresponding to C–H vibration of TBA+, was much lower than the left peak and the right peak. While in this study, for systems with w = (0.10 and 0.20), the peak around 2912 cm−1 was higher than other peaks. For systems with w = (0.30, 0.34 and 0.45), the peak at 2912 cm−1 was higher than the left peak and almost as high as the right peak. Thus the peak at 2912 cm−1 could be assigned to the C–H vibration of CH4 molecules in 512 cages. This implied that small cages of TBAC SCHs were vacant to trap gas molecules and the cage occupancy decreased with the increase of w. It was well-known that CH4 hydrate was formed based on structure I with two peaks at 2905 cm−1 and 2915 cm−1, corresponding to the CH4 in large and small cages, respectively. The slight shift in wavenumbers (2915 cm−1 to 2912 cm−1) could be caused by the structure of double (TBAC + CH4) SCH, in which the cation was encaged in the host lattice and affected the Raman spectra. Besides, it should be noted that this phenomenon was not the first time to show up. In 2015, Kim et al.39,40 studied the spectra of (TBAC + CO2) SCHs and (TBAC + CO2 + N2) SCHs, and the results showed that the addition of TBAC caused a slight shift of wavenumbers from 1275 cm−1 to 1272 cm−1. Moreover, Hashimoto50 provided the differences between HS-I SCHs and TS-I SCHs in Raman spectra in 2008. The differences mainly showed in the peaks around 1100 cm−1 and 1400 cm−1, and the latter one only showed up in HS-I. In our experimental systems, the peaks appeared at 1133 cm−1, 1156 cm−1 and 1407 cm−1. And the peaks at 1133 cm−1 and 1156 cm−1 became more obvious with w increased. This result revealed that the (TBAC + CH4) SCHs were formed on the base of HS-I with w= (0.10 and 0.20), TS-I with w= (0.30 and 0.34), and both (HS-I + TS-I) with w = 0.45, respectively. It was reported that pure TBAC hydrate was formed only on the basis of TS-I.3 Thus it was assumed that at low salt concentrations the addition of CH4 induced the formation of HS-I since it had three D cages per TBAC which was higher than that of TS-I.4. Conclusions
In this study, the formation kinetics of TBAC + CH4 SCHs have been investigated with an isobaric method for potential application of gas storage at moderate temperatures. In order to fully understand the effect of different operation conditions, the experiment was carried out for systems with w = (0.10, 0.20, 0.30, 0.34 and 0.45) and P = (6.0 and 3.0) MPa at constant (ΔT or T). The IT became shorter with higher supersaturation environment, represented by higher P or lower T. The NGC continuously decreased with the increase of w, showing that the amount of CH4 trapped in the 512 cages decreased rather than kept constant. The parameters of rapid growth stage, RGT and RGR, were studied to provide information for industrial operation. The suggested operation time for systems with ΔT = 6 K or T = 278.15 K was (40 to 100) min and (30 to 60) min, respectively. In addition, Raman spectra were employed to investigated the structure of (TBAC + CH4) SCHs. The spectra revealed that the SCHs were formed with hexagonal structure or tetragonal structure under different salt concentrations, which were different from the structures of pure TBAC hydrate. It was assumed that at low salt concentrations the addition of CH4 induced the formation of hexagonal structure since it had three 512 cages per TBAC which was higher than that of tetragonal structure. These results were of great fundamental and practical importance for advanced hydrate-based gas storage.Conflicts of interest
There are no conflicts to declare.Acknowledgements
The authors acknowledge the support from the National Natural Science Foundation of China (51606198 and 51376182), the Natural Science Foundation of Guangdong Province (2016A030310126), and Fund of Key Laboratory of Gas Hydrate Chinese Academy of Sciences (Y607jb1001).References
- E. D. Sloan and C. A. Koh, Clathrate Hydrates of Natural Gases, CRC Press (Taylor & Francis Group), 3rd edn, 2008 Search PubMed.
- W. Shimada, M. Shiro, H. Kondo, S. Takeya, H. Oyama, T. Ebinuma and H. Narita, Acta Crystallogr., Sect. C: Cryst. Struct. Commun., 2005, 61, O65–O66 Search PubMed.
- T. V. Rodionova, V. Y. Komarov, G. V. Villevald, T. D. Karpova, N. V. Kuratieva and A. Y. Manakov, J. Phys. Chem. B, 2013, 117, 10677–10685 CrossRef CAS PubMed.
- T. Rodionova, V. Komarov, G. Villevald, L. Aladko, T. Karpova and A. Manakov, J. Phys. Chem. B, 2010, 114, 11838–11846 CrossRef CAS PubMed.
- V. Y. Komarov, T. V. Rodionova, I. S. Terekhova and N. V. Kuratieva, J. Inclusion Phenom. Macrocyclic Chem., 2007, 59, 11–15 CrossRef CAS.
- Y. Youn, J. Seol, M. Cha, Y.-H. Ahn and H. Lee, J. Chem. Eng. Data, 2014, 59, 2004–2012 CrossRef CAS.
- J. W. Du and L. G. Wang, Ind. Eng. Chem. Res., 2014, 53, 1234–1241 CrossRef CAS.
- J. W. Du, H. J. Li and L. G. Wang, Ind. Eng. Chem. Res., 2014, 53, 8182–8187 CrossRef CAS.
- Z. X. Liao, X. Q. Guo, Y. Y. Zhao, Y. W. Wang, Q. Sun, A. X. Liu, C. Y. Sun and G. J. Chen, Ind. Eng. Chem. Res., 2013, 52, 18440–18446 CrossRef CAS.
- J. W. Du, D. Q. Liang, D. L. Li, Y. F. Chen and X. J. Li, Ind. Eng. Chem. Res., 2011, 50, 11720–11723 CrossRef CAS.
- X.-S. Li, Z.-M. Xia, Z.-Y. Chen, K.-F. Yan, G. Li and H.-J. Wu, Ind. Eng. Chem. Res., 2010, 49, 11614–11619 CrossRef CAS.
- Q. A. Sun, X. Q. Guo, A. X. Liu, B. Liu, Y. S. Huo and G. Y. Chen, Ind. Eng. Chem. Res., 2011, 50, 2284–2288 CrossRef CAS.
- P. Babu, W. I. Chin, R. Kumar and P. Linga, Ind. Eng. Chem. Res., 2014, 53, 4878–4887 CrossRef CAS.
- N. Ye, P. Zhang and Q. S. Liu, Ind. Eng. Chem. Res., 2014, 53, 10249–10255 CrossRef CAS.
- D.-l. Zhong, Y. Ye, C. Yang, Y. Bian and K. Ding, Ind. Eng. Chem. Res., 2012, 51, 14806–14813 CrossRef CAS.
- M. Garcia, R. Marriott and M. A. Clarke, Ind. Eng. Chem. Res., 2016, 55, 777–787 CrossRef CAS.
- S. Muromachi, R. Kamo, T. Abe, T. Hiaki and S. Takeya, RSC Adv., 2017, 7, 13590–13594 RSC.
- H. Sakamoto, K. Sato, K. Shiraiwa, S. Takeya, M. Nakajima and R. Ohmura, RSC Adv., 2011, 1, 315–322 RSC.
- C.-G. Xu and X.-S. Li, RSC Adv., 2015, 5, 54672–54699 RSC.
- C.-G. Xu and X.-S. Li, RSC Adv., 2014, 4, 18301–18316 RSC.
- P. T. Ngema, C. Petticrew, P. Naidoo, A. H. Mohammadi and D. Ramjugernath, J. Chem. Eng. Data, 2014, 59, 466–475 CrossRef CAS.
- T. Tanii, J. Jpn. Soc. Mech. Eng., 1994, 97, 925–927 Search PubMed.
- X. Wang, M. Dennis and L. Hou, Renewable Sustainable Energy Rev., 2014, 36, 34–51 CrossRef CAS.
- S. Babaee, H. Hashemi, A. H. Mohammadi, P. Naidoo and D. Ramjugernath, J. Chem. Thermodyn., 2015, 81, 52–59 CrossRef CAS.
- G. Li, D. Liu and Y. Xie, J. Therm. Anal. Calorim., 2010, 102, 819–826 CrossRef CAS.
- D. L. Fowler, W. V. Loebenstein, D. B. Pall and C. A. Kraus, J. Am. Chem. Soc., 1940, 62, 1140–1142 CrossRef CAS.
- G. A. Jeffrey, Acc. Chem. Res., 1969, 2, 344–352 CrossRef CAS.
- D. Mech, G. Pandey and J. S. Sangwai, Fluid Phase Equilib., 2015, 402, 9–17 CrossRef CAS.
- D. Mech and J. S. Sangwai, J. Chem. Eng. Data, 2014, 59, 3932–3937 CrossRef CAS.
- D. Mech and J. S. Sangwai, J. Chem. Eng. Data, 2016, 61, 3607–3617 CrossRef CAS.
- J. S. Sangwai and L. Oellrich, Fluid Phase Equilib., 2014, 367, 95–102 CrossRef CAS.
- H. Najibi, K. Momeni, M. T. Sadeghi and A. H. Mohammadi, J. Chem. Thermodyn., 2015, 87, 122–128 CrossRef CAS.
- Q. Sun, J. Liu, A. Liu, X. Guo, L. Yang and J. Zhang, Int. J. Hydrogen Energy, 2015, 40, 6358–6364 CrossRef CAS.
- S. Muromachi, K. A. Udachin, S. Alavi, R. Ohmura and J. A. Ripmeester, Chem. Commun., 2016, 52, 5621–5624 RSC.
- W. Lee, Y.-S. Kim and S.-P. Kang, Chem. Eng. J., 2018, 331, 1–7 CrossRef CAS.
- H. Roosta, S. Khosharay and F. Varaminian, Energy Convers. Manage., 2013, 76, 499–505 CrossRef CAS.
- J. Verrett and P. Servio, Can. J. Chem. Eng., 2016, 94, 2138–2144 CrossRef CAS.
- L.-L. Shi and D.-Q. Liang, J. Chem. Eng. Data, 2014, 59, 3705–3709 CrossRef CAS.
- S. Kim, I.-H. Baek, J.-K. You and Y. Seo, Appl. Energy, 2015, 140, 107–112 CrossRef CAS.
- S. Kim and Y. Seo, Appl. Energy, 2015, 154, 987–994 CrossRef CAS.
- M. Oshima, M. Kida and J. Nagao, J. Chem. Eng. Data, 2016, 61, 3334–3340 CrossRef CAS.
- L. Shi, L. Yi, X. Shen, W. Wu and D. Liang, J. Mol. Liq., 2017, 229, 98–105 CrossRef CAS.
- T. Makino, T. Yamamoto, K. Nagata, H. Sakamoto, S. Hashimoto, T. Sugahara and K. Ohgaki, J. Chem. Eng. Data, 2010, 55, 839–841 CrossRef CAS.
- Z.-G. Sun and C.-G. Liu, J. Chem. Eng. Data, 2012, 57, 978–981 CrossRef CAS.
- L.-l. Shi and D.-q. Liang, Fluid Phase Equilib., 2015, 386, 149–154 CrossRef CAS.
- H. P. Veluswamy, W. J. Ang, D. Zhao and P. Linga, Chem. Eng. Sci., 2015, 132, 186–199 CrossRef CAS.
- H. P. Veluswamy, A. Kumar, R. Kumar and P. Linga, Appl. Energy, 2017, 188, 190–199 CrossRef CAS.
- D. Mech, P. Gupta and J. S. Sangwai, J. Nat. Gas Sci. Eng., 2016, 35, 1519–1534 CrossRef CAS.
- Y. Jin, M. Kida and J. Nagao, J. Chem. Eng. Data, 2016, 61, 679–685 CrossRef CAS.
- S. Hashimoto, T. Sugahara, M. Moritoki, H. Sato and K. Ohgaki, Chem. Eng. Sci., 2008, 63, 1092–1097 CrossRef CAS.
| This journal is © The Royal Society of Chemistry 2017 |

