 Open Access Article
Creative Commons Attribution 3.0 Unported Licence
Tin-based materials supported on nitrogen-doped reduced graphene oxide towards their application in lithium-ion batteries†
Xiaoxia Zuoa,
Bao Lia,
Kun Chang*b,
Hongwei Tanga and
Zhaorong Chang *a
*a
aCollaborative Innovation Center of Henan Province for Green Manufacturing of Fine Chemicals, School of Chemistry and Chemical Engineering, Henan Normal University, Xinxiang 453007, P. R. China. E-mail: czr_56@163.com
bNational Institute for Materials Science (NIMS), 1-1 Namiki, Tsukuba, Ibaraki 305-0044, Japan. E-mail: chang.kun@nims.go.jp
First published on 17th November 2017
Abstract
Recently, nitrogen-doped graphene has attracted significant attention for application as an anode in lithium-ion batteries due to effective modulation of the electronic properties of graphene. Herein, we report a facile route to successfully synthesize a series of tin-based materials (including Sn, SnO2, and SnS2) supported on N-doped reduced graphene oxide (N-rGO). Field emission scanning electron microscopy (FESEM) and transmission electron microscopy (TEM) images indicated that the Sn-based materials were uniformly and tightly dispersed on the surface of N-rGO. When used as an anode in LIBs, the electrochemical performances of the proposed electrodes were systematically investigated and compared. The results show that among these electrodes, SnS2/N-rGO with a matched layered structure delivers the best performance with not only high specific capability but also excellent cycling stability.
1. Introduction
Rechargeable lithium-ion batteries (LIBs) are a promising power technology for future applications. They have also attracted extensive attention as power sources for high-power tools and electric vehicles. Graphitic materials are extensively used as commercial anode materials for LIBs due to their flat and low potential profile as compared to that of lithium and structural stability during cycling. However, the small theoretical specific capacity of graphite (372 mA h g−1) necessitates the search of alternative negative electrodes.1 During the past few decades, numerous research efforts have been carried out towards exploring novel anode materials, such as amorphous carbon, metal oxides, metal sulfides, and metals or alloys, with high specific capacity;2–8 moreover, ideal electrodes that possess not only high capacity but also lower potential profile have been prepared using tin (Sn)-based and silicon (Si)-based materials, as shown in Fig. S1 (ESI).† However, the large volume changes of both metals during the lithiation process restrict the improvement in cycling stability, especially for Si-based electrodes in which the volume change can reach up to 420%, severely destroying the structure of the electrodes.9–13Sn-based materials have attracted growing research interest for use in LIB anodes due to their multi-type compounds such as SnO2 and SnS2, which can buffer the large volume change to some extent.14–17 Moreover, the discovery of reduced graphene oxide (rGO) in recent years has led to the development of a significant number of graphene-based metal, metal oxides, or metal sulfides for use as LIB anodes due to the unique physical and chemical properties and potential of rGO for applications in electronic devices and sensors. The results have generally been promising towards the improvement of their specific capacity and cycling stability.8,18–20 To further enhance the properties of rGO, element (such as sulfur, boron, and nitrogen) doping via chemical substitution has been used beyond just morphology and size control, and nitrogen doping is shown to be particularly effective in modulating the electronic properties of graphene.21 Based on previous reports on Sn-based materials supported on rGO or nitrogen-doped rGO (N-rGO), the most frequently used preparation method is to use rGO as a template and subsequently subject it to a reduction reaction to form Sn-based rGO composites.22–30 Although Sn-based materials prepared using this method can be uniformly dispersed on the surface of rGO, the number of remaining oxygen functional groups on rGO will restrict the electronic conductivity and electrochemical performance for the LIB anodes.21
Therefore, our current study was aimed at using the as-prepared rGO and N-rGO obtained via a thermal exfoliation method as the templates to synthesize Sn-based materials supported on rGO or N-rGO. However, this attempt was unsuccessful while preparing SnO2/rGO, where the SnO2 nanoparticles could not be directly anchored on the surface of rGO. This may be attributed to the smooth surface of rGO obtained via the thermal exfoliation method. Herein, a series of Sn-based materials (including Sn, SnO2, and SnS2) supported on N-rGO were successfully synthesized. Field emission scanning electron microscopy (FESEM) and transmission electron microscopy (TEM) images indicated that the Sn-based materials were uniformly and tightly dispersed on the surface of N-rGO. When used as LIB anodes, the electrochemical performance of the proposed electrodes was systematically investigated and compared. The results show that among these electrodes, SnS2/N-rGO with a matched layered structure delivered the best performance, with not only high specific capability but also excellent cycling stability.
2. Experimental
2.1 Synthesis of rGO and N-rGO
RGO and N-rGO were prepared following literature procedures.21 Briefly, graphite oxide powder was first synthesized using the modified Hummers method.31 Then, the graphite oxide powder was heated at 1050 °C for 30 s under an Ar atmosphere to obtain rGO. N-rGO was further obtained by heating rGO under high purity ammonia mixed with Ar at 900 °C for 4 h.2.2 Synthesis of the Sn-based N-rGO composites
To synthesize the SnO2/N-rGO composite, 0.38 g of SnCl2 and 2 mL of 0.5 M HCl were dissolved in 80 mL of deionized water, and then, the abovementioned N-rGO powder was added to the mixture. After ultrasonication and stirring for 30 min, the mixture was transferred to a 100 mL Teflon-lined stainless steel autoclave, sealed tightly, and heated at 180 °C for 12 h. After cooling down to room temperature naturally, the black precipitate was obtained by centrifugation, washed with deionized water and ethanol, and then dried in a vacuum oven at 80 °C for 24 h. Finally, the products were annealed at 300 °C for 1 h under an Ar atmosphere. In the control experiment, the Sn/N-rGO composite was also prepared using the same abovementioned procedure with N2H4 and H2 protection in the synthetic route, and the SnS2/N-rGO composite was prepared using the same procedure with L-cysteine as the S source.2.3 Characterization
Samples were characterized via X-ray diffraction (XRD; Rigaku RU-200BVH diffractometer employing a Cu-Kα source), field emission scanning electron microscopy (FESEM, Hitachi S-4800), transmission electron microscopy (TEM, TECNAI G2 F30, Japan), energy dispersive X-ray spectroscopy (EDX, GENESIS 4000), Raman spectroscopy (Horiba-Jovin Yvon T64000) and X-ray photoelectron spectroscopy (XPS, ULVAC-PHI, Japan).2.4 Electrochemical measurements
The negative electrodes for the battery tests were composed of Sn-based materials, acetylene black, and polyvinylidene fluoride (PVDF) in a weight ratio of 75![[thin space (1/6-em)]](https://www.rsc.org/images/entities/char_2009.gif) :
:![[thin space (1/6-em)]](https://www.rsc.org/images/entities/char_2009.gif) 10
10![[thin space (1/6-em)]](https://www.rsc.org/images/entities/char_2009.gif) :
:![[thin space (1/6-em)]](https://www.rsc.org/images/entities/char_2009.gif) 15. The mixture of the active material, acetylene black, and PVDF was ground for 2 h in an agate mortar. The mixture was then dried in a vacuum oven at 80 °C for 4 h to remove any moisture. After this, NMP was added to form a slurry, which was subsequently spread onto a copper foil with a thickness of 0.1 mm and a diameter of 12 mm, dried at 80 °C in a drying oven for 2 h, compacted using a hydraulic press, and then dried again at 120 °C for 12 h in a vacuum drying chamber. Button cells (2025R) containing a Li foil as a counter electrode, polypropylene film (Celgard 2400) as a separator, and 1 M (mol L−1) LiPF6 in a mixture of ethylene carbonate/dimethyl carbonate/diethyl carbonate (EC/DMC/DEC 1
15. The mixture of the active material, acetylene black, and PVDF was ground for 2 h in an agate mortar. The mixture was then dried in a vacuum oven at 80 °C for 4 h to remove any moisture. After this, NMP was added to form a slurry, which was subsequently spread onto a copper foil with a thickness of 0.1 mm and a diameter of 12 mm, dried at 80 °C in a drying oven for 2 h, compacted using a hydraulic press, and then dried again at 120 °C for 12 h in a vacuum drying chamber. Button cells (2025R) containing a Li foil as a counter electrode, polypropylene film (Celgard 2400) as a separator, and 1 M (mol L−1) LiPF6 in a mixture of ethylene carbonate/dimethyl carbonate/diethyl carbonate (EC/DMC/DEC 1![[thin space (1/6-em)]](https://www.rsc.org/images/entities/char_2009.gif) :
:![[thin space (1/6-em)]](https://www.rsc.org/images/entities/char_2009.gif) 1
1![[thin space (1/6-em)]](https://www.rsc.org/images/entities/char_2009.gif) :
:![[thin space (1/6-em)]](https://www.rsc.org/images/entities/char_2009.gif) 1 by volume) as an electrolyte were assembled in an argon-filled glovebox. Constant-current charge and discharge tests were performed using a cell test system (Land CT2001A) in the potential range between 0.005 and 3.0 V. Cyclic voltammetry (CV) tests were carried out using an electrochemical workstation (CHI 660C) over a potential range from 0.005 to 3.0 V at a scan rate of 0.1 mV s−1. Electrochemical impedance tests were also performed using an electrochemical workstation (CHI 660C) over the frequency range from 0.01 Hz to 100 kHz at an amplitude of 5 mV.
1 by volume) as an electrolyte were assembled in an argon-filled glovebox. Constant-current charge and discharge tests were performed using a cell test system (Land CT2001A) in the potential range between 0.005 and 3.0 V. Cyclic voltammetry (CV) tests were carried out using an electrochemical workstation (CHI 660C) over a potential range from 0.005 to 3.0 V at a scan rate of 0.1 mV s−1. Electrochemical impedance tests were also performed using an electrochemical workstation (CHI 660C) over the frequency range from 0.01 Hz to 100 kHz at an amplitude of 5 mV.
3. Results and discussion
The proposed rGO and N-rGO were synthesized using the method described in the Experimental section. According to the calculation in XPS spectrum of N-rGO, the atomic ratio of the doped nitrogen was estimated to be 2.3 at% (Fig. S2†). Fig. 1 shows the characterization results for the as-prepared rGO and N-rGO. Upon comparing their Raman spectra shown in Fig. 1a, it was found that the D band observed at approximately 1350 cm−1 was disorder-induced and attributed to the structural defect sites on the rGO plane. The G band observed at approximately 1600 cm−1 is commonly observed for all graphitic structures and attributed to the E2g vibrational mode present in the sp2-bonded graphitic carbons. The intensity ratio of the D peak to G peak, i.e. ID/IG, provides an indication of the amount of structural defect sites and is a quantitative measure of edge plane exposure. It can be clearly observed from Fig. 1a that the ID/IG ratio of N-rGO is obviously larger than that of rGO as a result of the structural defect sites caused by the incorporation of heterogeneous nitrogen atoms into the rGO layers. Their corresponding molecular structures are schematically illustrated in Fig. 1b, where the red balls represent the nitrogen atoms. At high temperatures, the partial active carbon atoms in rGO are easily replaced by the nitrogen atoms in ammonia gas to form N-rGO with more defects and vacancies. Upon comparing the FESEM images of rGO (Fig. 1c) and N-rGO (Fig. 1d), it has also been found that N-rGO possesses a rougher and more wrinkled surface than rGO. Moreover, after nitrogen doping, the rGO nanosheets become thinner, which can be observed from the XRD patterns shown in Fig. 1e. The diffraction peaks observed at 2θ = 24.1°, which are attributed to the (002) plane of the rGO and N-rGO nanosheets, have the slightly larger interlayer distance than that of graphite, with the diffraction peak of (002) at 2θ = 26.38°. In addition, the (002) peak intensity of N-rGO was obviously lower than that of rGO; this indicated that the restacking degree of the N-rGO nanosheets along c-axis was lower than that found in the case of the rGO nanosheets as well as illustrated that the nanosheets for N-rGO were more thinner.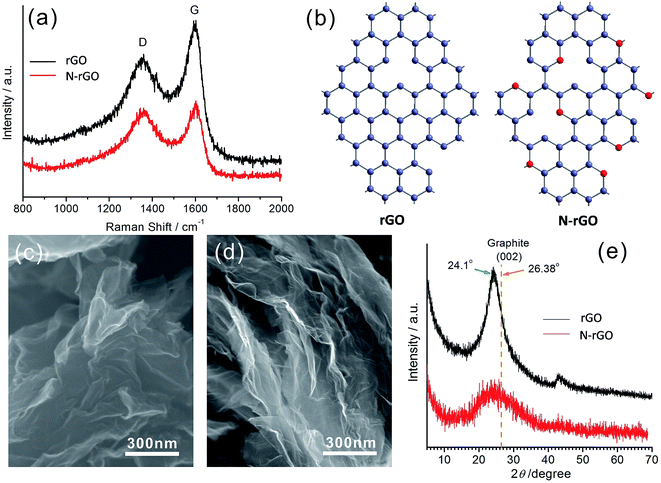 | ||
| Fig. 1 (a) The Raman spectra of rGO and N-rGO. (b) A schematic of the molecular structures of rGO and N-rGO. SEM images of (c) rGO and (d) N-rGO. (e) XRD patterns of rGO and N-rGO. | ||
Using N-rGO as a template, the Sn-based materials were anchored in situ on the surface of N-rGO via a solution-phase method. Fig. 2 illustrates schematically the synthesis routes used to prepare the Sn-based materials supported on N-rGO, in which Sn2+ ions are the starting materials. While using rGO as the template, the hydrolyzed SnO2 nanoparticles were not adsorbed on the surface of the rGO nanosheets. It can also be observed in Fig. S3† that the SnO2 nanoparticles are separated from the rGO nanosheets. As abovementioned, this may be attributed to the smooth surface of the rGO nanosheets obtained through the thermal exfoliation process, which does not provide nucleation sites for the SnO2 nanoparticles. Thus, N-rGO with more defect sites and vacancies was used as the template for the nucleation of SnO2 nanoparticles.32
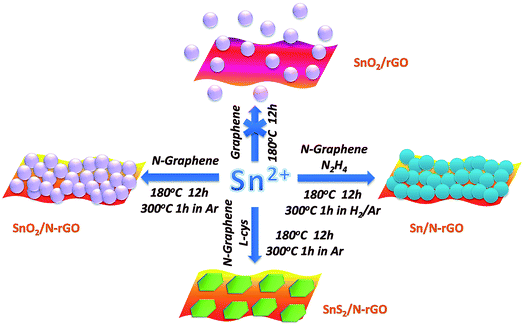 | ||
| Fig. 2 A schematic of the synthetic routes used to prepare the Sn-based materials supported on rGO and N-rGO. | ||
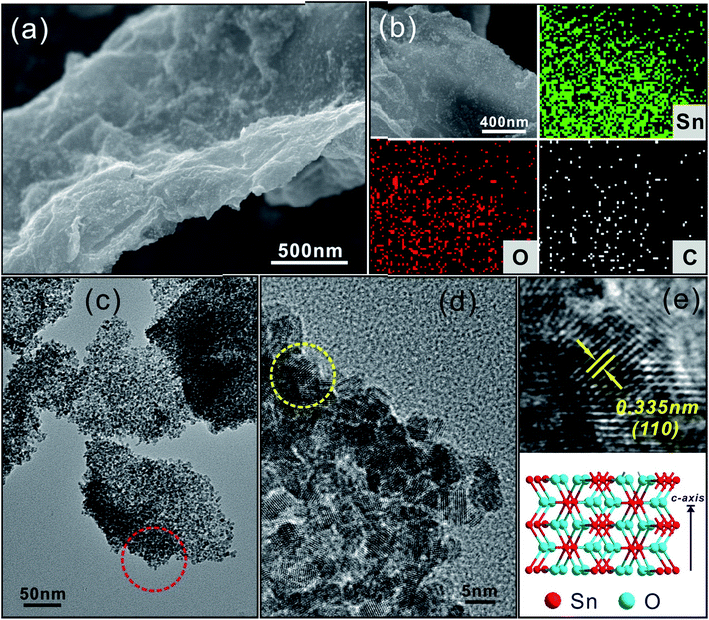
Fig. 3 shows the morphology and structure of SnO2/N-rGO. The FESEM image, as shown in Fig. 3a, indicates that the SnO2 nanocrystals are densely anchored on the surface of the N-rGO nanosheets; this is caused by the large number of defects and vacancies in N-rGO. The elemental mapping images shown in Fig. 3b reveal that the Sn, O, and C elements are uniformly dispersed on the N-rGO nanosheets. The TEM images, as shown in Fig. 3c and d, show that the average size of the SnO2 nanocrystals is around 3–4 nm, and from the HRTEM image (Fig. 3e), it can be seen that the lattice fringes of 0.335 nm correspond to the (110) planes of tetragonal SnO2. The XRD pattern of SnO2/N-rGO is shown in Fig. S4.† All the peaks can be indexed to tetragonal SnO2 (JCPDS 41-1445), and the corresponding molecular structure is illustrated in Fig. 3e.
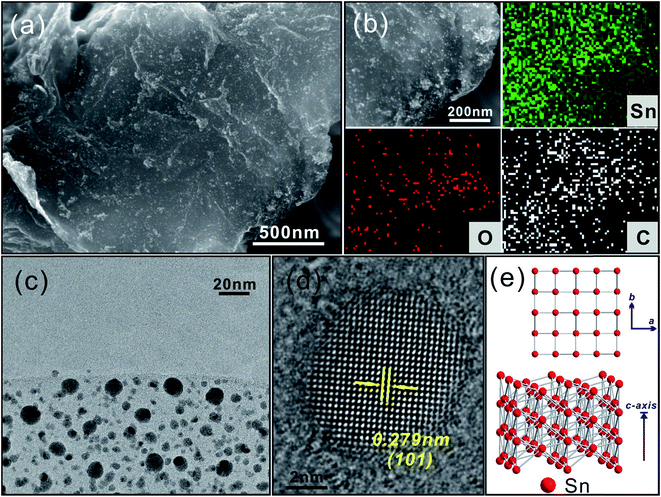
The Sn/N-rGO composite was obtained from SnO2/N-rGO by annealing at 300 °C in H2/N2 for 1 h. The SnO2 nanoparticles were reduced to Sn metal under H2 during the high temperature treatment. Fig. 4 shows the morphology and structure of Sn/N-rGO, where it can be seen in Fig. 4a that the reduced Sn metal nanoparticles are homogeneously distributed on the surface of N-rGO. The element mapping images shown in Fig. 4b reveal that the composites mainly contain the elements Sn and C as well as a small amount of O derived from the oxygen functional groups of N-rGO and non-reduced SnO2. The TEM image in Fig. 4c indicates that the Sn particle size ranges from 5 to 10 nm, and from the HRTEM image (Fig. 4d), it can be seen that the lattice fringes of 0.279 nm correspond to the (101) planes of tetragonal Sn. Fig. S5† shows the XRD pattern of the Sn/N-rGO composite, where it can be observed that all the diffraction peaks for the composites correspond well to the tetragonal crystalline phase of Sn (JCPDS 04-0673), which corresponds to the molecular structure illustrated in Fig. 4e.
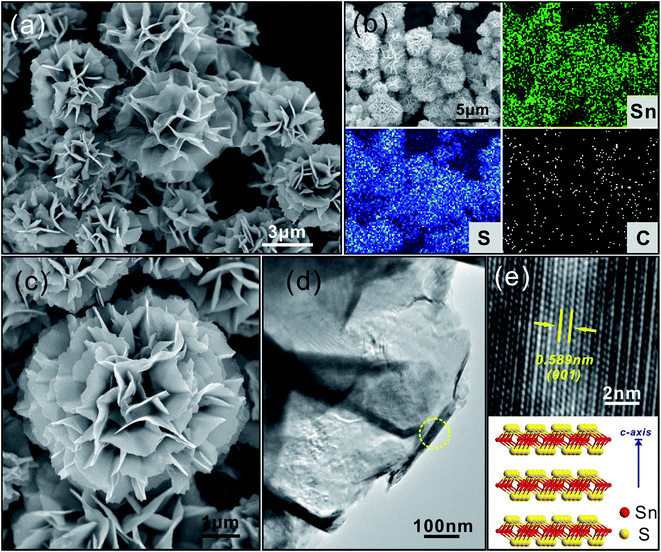
Using a similar process as that used to prepare SnO2/N-rGO, SnS2/N-rGO was synthesized by adding L-cysteine (L-cys) as the sulfur source. Upon comparing the morphologies of SnO2/N-rGO and Sn/N-rGO, which show zero-dimensional (0D) materials composited with two-dimensional (2D) materials, it has been observed that SnS2/N-rGO shows a double 2D material composite structure. Fig. 5a provides a general view of the SnS2/N-rGO composite, where it can be seen that the composite shows a three-dimensional (3D) architecture consisted of the curved nanosheets. According to previous reports,3,33 the self-assembly of the 3D architecture materials was facile under the L-cys-assisted hydrothermal conditions due to the network structure of the L-cys molecule.
In this study, the self-assembly was promoted under the condition that layered SnS2 and rGO were involved depending on their interactions. The elemental mapping images shown in Fig. 5b reveal that SnS2/N-rGO mainly contains the elements Sn, S, and C, which are uniformly distributed in the composites. Fig. 5c and d indicate that SnS2 and N-rGO deliver matched 2D layered structures, which are tightly composited together. The XRD pattern of SnS2/N-rGO in Fig. S6† also shows that all the diffraction peaks can be attributed to layered hexagonal SnS2 corresponding to the JCPDS card no. 23-0677. It can be calculated from the d spacing of the (001) peak at 2θ = 15.1° according to the diffraction angles using the Bragg equation that the interlayer distance of SnS2 is 0.59 nm, which is in accordance with the measurement results shown in the HRTEM image shown in Fig. 5e. When used as the anode material in an LIB, this 2D layered structure (Fig. 5e, illustration of the SnS2 molecular structure) could buffer the volume change and improve the cycling stability of the electrodes.34,35
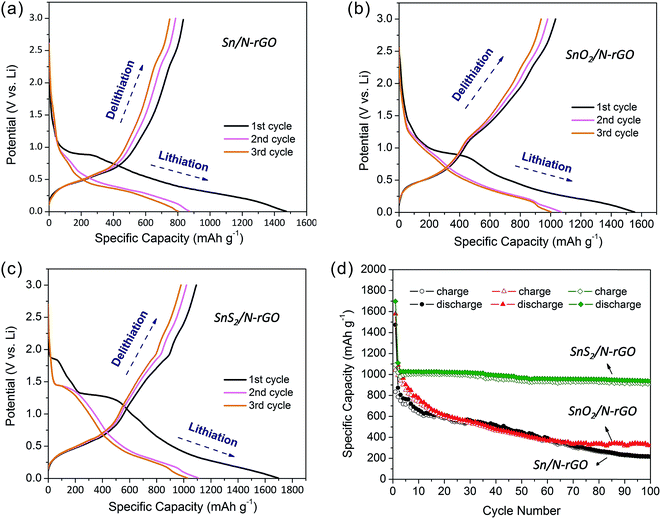
To investigate the effect of N-rGO on the electrochemical performance of the composites, we undertook electrical tests using different samples. According to the elemental analysis of EDS (Table S1†), it can be seen that the amount of N-rGO was lower than 3 wt% in the three composites; therefore, the Sn-based materials still acted as the major active electrode material in our experiments. Fig. 6 shows the first three charge/discharge profiles of the three composite samples between 0.01 and 3.0 V vs. Li+/Li and their cycling behaviors at a current density of 100 mA h g−1. All the specific capacities given below are calculated based on the whole composites. Upon comparing the three initial discharge curves of Sn/N-rGO, SnO2/N-rGO, and SnS2/N-rGO, it was found that an inconspicuous potential plateau appeared at 1.8 V for SnS2/N-rGO (Fig. 6c), which could be attributed to the formation of LixSnS2 when lithium ions were intercalated into the SnS2 layers to some extent without causing phase decomposition.36 For SnO2/N-rGO (Fig. 6b), this inconspicuous potential plateau appeared at 1.4 V, whereas no potential plateau was observed for Sn/N-rGO. The irreversible plateaus that emerged at 1.3 V for SnS2/N-rGO and 1.0 V for SnO2/N-rGO and Sn/N-rGO can be assigned to the formation of Sn and Li2S or Li2O,37–39 where oxygen in the Sn/N-rGO composite originates from the oxygen functional groups in N-rGO (Fig. 4b). In the potential range from 0.01 to 0.5 V, lithium ions alloyed with the Sn metal form a series of Li–Sn alloys. During the subsequent cycles, the lithiation and delithiation process can be attributed to the following two reactions: Li2S (or Li2O) ↔ 2Li + S and LixSn ↔ xLi + Sn.40 Correspondingly, the charge and discharge voltage plateaus characteristic for the three Sn-based N-rGO composites were assigned to their cyclic voltammograms curves (Fig. S7†).
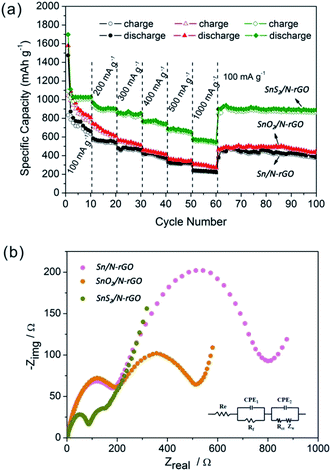
In Fig. 6a–c, the initial charge capacity observed for Sn/N-rGO, SnO2/N-rGO, and SnS2/N-rGO was 834.3, 1041.3, and 1093 mA h g−1, and the discharge capacity was 1473.8, 1579.2, and 1697.3 mA h g−1, respectively. The initial irreversible capacity can be attributed to the formation of a solid electrolyte interface (SEI) layer and the side reactions of the electrolyte.41 All three composites exhibit a high charge/discharge capacity when compared with bare Sn-based materials.16,42–44 Among these, the SnS2/N-rGO composite shows the highest specific capacity, and the higher capacity of SnO2/N-rGO and SnS2/N-rGO than Sn/N-rGO is assigned to the contribution of the O and S elements in the composites. The drastic enhancement in the specific capacity is attributed to the cooperation of N-rGO, which provides a large surface for anchoring the Sn-based materials uniformly and high conductivity for electron transport.44,45 As is known, the main drawback of Sn-based materials as LIB electrodes is their volume change during cycling that leads to rapid capacity fading. Carbon materials, such as amorphous carbon, rGO, and N-rGO, are usually coated on Sn-based materials to buffer the volume change of these materials. In our study, we also used N-rGO as the substrate to support the Sn-based materials to avoid their capacity fading. However, as seen in Fig. 6d, the cycling behavior of the three Sn-based materials showed that only the SnS2/N-rGO composite exhibited good stability. After 100 cycles, the reversible capacity of SnS2/N-rGO was still 920.6 mA h g−1 with a capacity retention of 84.2%. On the contrary, the Sn/N-rGO and SnO2/N-rGO composites deliver the poor cycling abilities with a reversible capacity retention of only 25.8% and 31.0% after 100 cycles. In general, the capacity fading was caused by the expansive volume excursions in the active electrode materials during the charging and discharging, leading to the pulverization of material and loss of electrical connectivity. Due to the mismatched structure of zero-dimensional Sn and SnO2 nanoparticles with two-dimensional N-rGO, the electrode active materials are easily exfoliated during the charge/discharge process.8 The SnS2/N-rGO composite maintain good stability during the charge/discharge process due to its matched and robust structure formed between the two-dimensional layered SnS2 and N-rGO.
Fig. 7a shows the rate cycling behavior of the three Sn-based composite electrodes. The high reversible capacity and excellent cycling behavior of the SnS2/N-rGO composite are reflected in their high rate capabilities. The average specific capacities observed for the SnS2/N-rGO composite are 1034, 918, 852, 772, 678, and 567 mA h g−1 at the current densities of 100, 200, 300, 400, 500, and 1000 mA g−1, respectively. Remarkably, after cycling at 1000 mA g−1, a stable capacity of ∼900 mA h g−1 was still delivered when the current density was reduced back to 100 mA g−1; this indicated high cycling stability. However, the Sn/N-rGO and SnO2/N-rGO composites deliver a reversible capacity of only 200–300 mA h g−1 at a current density of 1000 mA g−1, exhibiting a poor rate capability.
To further explain and better understand why the SnS2/N-rGO electrode exhibits superior electrochemical performance as compared to the Sn/N-rGO and SnO2/N-rGO electrodes, electrochemical impedance measurements have been performed after 3 cycles, as shown in Fig. 7b. The equivalent circuit model of the studied system is shown in the inset image of Fig. 7b.
The kinetic differences in the three Sn-based composite electrodes were further investigated by electrochemical impedance spectrum (EIS) modeling based on the modified equivalent circuit46 using the fitted impedance parameters listed in Table 1.
| Electrodes | Re (Ω) | Rf (Ω) | CPE1 (μF) | Rct (Ω) | CPE2 (μF) |
|---|---|---|---|---|---|
| Sn/N-rGO | 4.9 | 166.2 | 1.831 | 423.9 | 88.1 |
| SnO2/N-rGO | 4.674 | 54.79 | 1.782 | 249.6 | 115.3 |
| SnS2/N-rGO | 3.385 | 20.57 | 1.662 | 75.93 | 232 |
In this model system, Re represents the internal resistance of the test battery, Rf and CPE1 are associated with the resistance and constant phase element of the SEI film, Rct and CPE2 are associated with the charge-transfer resistance and constant phase element of the electrode/electrolyte interface, respectively, and ZW is associated with the Warburg impedance corresponding to the lithium-diffusion process. In Fig. 7b, the high frequency semicircle corresponds to the resistance Rf and CPE1 of the SEI film, and the semicircle in the medium frequency region is assigned to the charge-transfer resistance Rct and CPE2 of the electrode/electrolyte interface. The inclined line corresponds to the lithium-diffusion process within the bulk of the electrode material. From the analysis results, it is known that the SEI film resistance Rf and charge-transfer resistance Rct of the SnS2/N-rGO electrode material are 20.57 and 75.93 Ω, respectively, which are significantly lower than those found for the Sn/N-rGO and SnO2/N-rGO electrodes. These results confirm that the structurally matched SnS2/N-rGO composite can provide more active sites and greater electrolyte–electrode contact area for lithium ion insertion and extraction as compared to the others. The incorporation of N-rGO does not only preserve the high conductivity of the composite, but also greatly enhances the rapid electron transport during the electrochemical lithium insertion/extraction process. In particular, for the layer structured SnS2/N-rGO composite, its robust structure ensures its stability during the high rate cycle, resulting in a significant improvement in the electrochemical performance of the SnS2/N-rGO composite.
4. Conclusions
In summary, a series of tin-based materials (including Sn, SnO2, and SnS2) supported on N-rGO were successfully synthesized. When compared with pure rGO nanosheets, N-rGO provides more vacancies to provide nucleation sites for the Sn-based materials. The characterization results indicated that all the Sn-based materials were uniformly and tightly dispersed on the surface of N-rGO. In the three composites, the structural compatibility between the layer structured SnS2 and N-rGO suggested the possibility of designing a robust electrode as an LIB anode without the deficiency of most rGO composites with 0D metal oxides. The LIB test results indicated that among three samples, the SnS2/N-rGO composite delivered the highest specific reversible capacity (1093 mA h g−1) with excellent cycling stability and high-rate capability. Upon comparing the three structural composites, it has been found that the impressive electrochemical performance observed for SnS2/N-rGO can be attributed to its robust composite architecture that can withstand the stress of cycling as well as the complementary and synergistic interactions between the layered SnS2 and N-rGO structures.Conflicts of interest
There are no conflicts to declare.Acknowledgements
This work was financially supported by the Natural Science Foundation of China (No. 51672071), the Natural Science Foundation of China for Young (No. 21303042), and Science and Technology Research Projects of Henan Provincial Department (No. 132102210256).References
- M. Winter and R. J. Brodd, Chem. Rev., 2004, 104, 4245–4269 CrossRef CAS PubMed.
- K. Chang, W. X. Chen, L. Ma, H. Li, H. Li, F. H. Huang, Z. D. Xu, Q. B. Zhang and J. Y. Lee, J. Mater. Chem., 2011, 21, 6251–6257 RSC.
- K. Chang and W. X. Chen, ACS Nano, 2011, 5, 4720–4728 CrossRef CAS PubMed.
- L. Shi, W. K. Wang, A. B. Wang, K. G. Yuan, Z. Q. Jin and Y. S. Yang, J. Power Sources, 2016, 318, 184–191 CrossRef CAS.
- D. M. Kang, Q. L. Liu, R. Si, J. J. Gu, W. Zhang and D. Zhang, Carbon, 2016, 99, 138–147 CrossRef CAS.
- Y. R. Ren and M. Q. Li, J. Power Sources, 2016, 306, 459–466 CrossRef CAS.
- Y. Y. Li, H. Y. Zhang, Y. M. Chen, Z. C. Shi, X. G. Cao, Z. P. Guo and P. K. Shen, ACS Appl. Mater. Interfaces, 2016, 8, 197–207 CAS.
- K. Chang, Z. Wang, G. C. Huang, H. Li, W. X. Chen and J. Y. Lee, J. Power Sources, 2012, 201, 259–266 CrossRef CAS.
- Y. H. Xu, J. C. Guo and C. S. Wang, J. Mater. Chem., 2012, 22, 9562–9567 RSC.
- X. Xin, X. F. Zhou, F. Wang, X. Y. Yao, X. X. Xu, Y. M. Zhu and Z. P. Liu, J. Mater. Chem., 2012, 22, 7724–7730 RSC.
- H. T. Kwon, C. K. Lee, K. J. Jeon and C. M. Park, ACS Nano, 2016, 10, 5701–5709 CrossRef CAS PubMed.
- H. X. Yang and L. Li, J. Alloys Compd., 2014, 584, 76–80 CrossRef CAS.
- P. Zhao, W. B. Yue, Z. X. Xu, S. M. Sun and H. Y. Bao, J. Alloys Compd., 2017, 704, 51–57 CrossRef CAS.
- S. Z. Liang, X. F. Zhu, P. C. Lian, W. S. Yang and H. H. Wang, J. Solid State Chem., 2011, 184, 1400–1404 CrossRef CAS.
- K. Nishikawa, K. Dokko, K. Kinoshita, S. W. Woo and K. Kanamura, J. Power Sources, 2009, 189, 726–729 CrossRef CAS.
- X. W. Lou, C. M. Li and L. A. Archer, Adv. Mater., 2009, 21, 2536–2539 CrossRef CAS.
- J. T. Zai, K. X. Wang, Y. Z. Su, X. F. Qian and J. S. Chen, J. Power Sources, 2011, 196, 3650–3654 CrossRef CAS.
- Y. Z. Jiang, T. Z. Yuan, W. P. Sun and M. Yan, ACS Appl. Mater. Interfaces, 2012, 4, 6216–6220 CAS.
- J. Qin, C. N. He, N. Q. Zhao, Z. Y. Wang, C. S. Shi, E. Z. Liu and J. J. Li, ACS Nano, 2014, 8, 1728–1738 CrossRef CAS PubMed.
- K. Zhang, H. Yang, M. Lü, C. Yan, H. Wu, A. Yuan and S. Lin, J. Alloys Compd., 2018, 731, 646–654 CrossRef CAS.
- K. Chang, D. S. Geng, X. F. Li, J. L. Yang, Y. J. Tang, M. Cai, R. Y. Li and X. L. Sun, Adv. Energy Mater., 2013, 3, 839–844 CrossRef CAS.
- G. X. Wang, B. Wang, X. L. Wang, J. Park, S. X. Dou, H. Ahn and K. Kim, J. Mater. Chem., 2009, 19, 8378–8384 RSC.
- Y. M. Li, X. J. Lv, J. Lu and J. H. Li, J. Phys. Chem. C, 2010, 114, 21770–21774 CAS.
- L. S. Zhang, Y. P. Huang, Y. F. Zhang, W. Fan and T. X. Liu, ACS Appl. Mater. Interfaces, 2015, 7, 27823–27830 CAS.
- X. S. Zhou, J. C. Bao, Z. H. Dai and Y. G. Guo, J. Phys. Chem. C, 2013, 117, 25367–25373 CAS.
- X. Q. Xie, D. W. Su, J. Q. Zhang, S. Q. Chen, A. K. Mondal and G. X. Wang, Nanoscale, 2015, 7, 3164–3172 RSC.
- X. S. Zhou, L. J. Wan and Y. G. Guo, Adv. Mater., 2013, 25, 2152–2157 CrossRef CAS PubMed.
- F. H. Du, Y. S. Liu, J. Long, Q. C. Zhu, K. X. Wang, X. Wei and J. S. Chen, Chem. Commun., 2014, 50, 9961–9964 RSC.
- J. Q. Shan, Y. X. Liu, P. Liu, Y. S. Huang, Y. Z. Su, D. Q. Wu and X. L. Feng, J. Mater. Chem. A, 2015, 3, 24148–24154 CAS.
- Q. Wang, L. Xing and X. Xue, Mater. Lett., 2017, 209, 155–158 CrossRef CAS.
- W. S. Hummers and R. E. Offeman, J. Am. Chem. Soc., 1958, 80, 1339 CrossRef CAS.
- D. S. Geng, Y. Chen, Y. G. Chen, Y. L. Li, R. Y. Li, X. L. Sun, S. Y. Ye and S. Knights, Energy Environ. Sci., 2011, 4, 760–764 CAS.
- K. Chang, W. X. Chen, H. Li and H. Li, Electrochim. Acta, 2011, 56, 2856–2861 CrossRef CAS.
- L. Wen, C. M. Liu, R. S. Song, H. Z. Luo, Y. Shi, F. Li and H. M. Cheng, Acta Chim. Sin., 2014, 72, 333–344 CrossRef CAS.
- Y. Jing, Z. Zhou, C. R. Cabrera and Z. F. Chen, J. Mater. Chem. A, 2014, 2, 12104–12122 CAS.
- C. Julien and C. PerezVicente, Solid State Ionics, 1996, 89, 337–343 CrossRef CAS.
- C. Guan, X. H. Wang, Q. Zhang, Z. X. Fan, H. Zhang and H. J. Fan, Nano Lett., 2014, 14, 4852–4858 CrossRef CAS PubMed.
- J. Z. Chen, L. Yang, S. H. Fang, Z. X. Zhang, A. Deb and S. Hirano, Electrochim. Acta, 2014, 127, 390–396 CrossRef CAS.
- M. Alaf and H. Akbulut, J. Power Sources, 2014, 247, 692–702 CrossRef CAS.
- G. Kilibarda, S. Schlabach, V. Winkler, M. Bruns, T. Hanemann and D. V. Szabo, J. Power Sources, 2014, 263, 145–153 CrossRef CAS.
- W. L. Yao, J. Yang, J. L. Wang and Y. Nuli, J. Electrochem. Soc., 2008, 155, A903–A908 CrossRef CAS.
- H. Nara, Y. Fukuhara, A. Takai, M. Komatsu, H. Mukaibo, Y. Yamauchi, T. Momma, K. Kuroda and T. Osaka, Chem. Lett., 2008, 37, 142–143 CrossRef CAS.
- H. Mukaibo, A. Yoshizawa, T. Momma and T. Osaka, J. Power Sources, 2003, 119, 60–63 CrossRef.
- H. B. Wang, T. Maiyalagan and X. Wang, ACS Catal., 2012, 2, 781–794 CrossRef CAS.
- D. Usachov, O. Vilkov, A. Gruneis, D. Haberer, A. Fedorov, V. K. Adamchuk, A. B. Preobrajenski, P. Dudin, A. Barinov, M. Oehzelt, C. Laubschat and D. V. Vyalikh, Nano Lett., 2011, 11, 5401–5407 CrossRef CAS PubMed.
- S. B. Yang, H. H. Song and X. H. Chen, Electrochem. Commun., 2006, 8, 137–142 CrossRef CAS.
Footnote |
| † Electronic supplementary information (ESI) available. See DOI: 10.1039/c7ra10731e |
| This journal is © The Royal Society of Chemistry 2017 |

