 Open Access Article
Creative Commons Attribution 3.0 Unported Licence
Preparation of diamond-based AuNP-modified nanocomposites with elevated catalytic performances
Xinna Zhaoab,
Tifeng Jiao *ab,
Ruirui Xingbc,
Hao Huanga,
Jie Hub,
Yuan Qud,
Jingxin Zhou*b,
Lexin Zhangb and
Qiuming Penga
aState Key Laboratory of Metastable Materials Science and Technology, Yanshan University, Qinhuangdao 066004, China. E-mail: tfjiao@ysu.edu.cn
bHebei Key Laboratory of Applied Chemistry, School of Environmental and Chemical Engineering, Yanshan University, Qinhuangdao 066004, China. E-mail: zhoujingxin@ysu.edu.cn
cState Key Laboratory of Biochemical Engineering, Institute of Process Engineering, Chinese Academy of Sciences, Beijing 100190, P. R. China
dQinhuangdao Taiji-ring Nano Products Co. Ltd, Qinhuangdao 066002, China
First published on 26th October 2017
Abstract
Diamond@graphene oxide@gold nanoparticle (D@GO@AuNP) nanocomposite materials were synthesized by a modified Hummers method using diamond@graphite composites that were obtained by the spark plasma sintering treatment of diamond, and gold nanoparticles that were prepared from a solution of HAuCl4 via reduction by NaBH4. The obtained diamond@graphene oxide utilized as a catalytic carrier has great advantages, such as high specific surface area and a porous structure, which provide more opportunities for the gold nanoparticles to access the catalytic carrier. In addition, the prepared hierarchical diamond-based D@GO@AuNP nanocomposites are beneficial to improve the catalytic capacity of gold nanoparticles with higher dispersion on the GO surface. Catalytic experiments with 4-nitrophenol and 2-nitroaniline were carried out using the synthesized D@GO@AuNP material. The obtained nanocomposites demonstrated excellent catalytic activity and high recyclability, without any decrease in the weight of gold nanoparticles after eight cycles of catalytic reduction, indicating the potential applications of the composite catalytic materials.
1. Introduction
In recent years, noble-metal materials such as Au, Cu, and Ag have drawn great attention due to their extensive applications in various fields, including biomedicine, catalysis, electrochemistry and environmental protection, which are beneficial for improving the living standards of modern people.1–8 Furthermore, noble metal nanoparticles have attracted increased attention in catalytic research on account of their high surface energy, small size and shape as catalytic centers. However, it is well known that the aggregation of noble metal particles is inevitable during the preparation process. Chi et al. discussed numerous highly dispersed Ag nanoparticles with a narrow size distribution.9 Khan et al. investigated different preparation methods for noble nanoparticles10–15 and the relationship between the catalytic activity of gold nanoparticles and their particle size.16 As the gold nanoparticles get smaller, the surface area can provide more effective contact between the catalyst and reactant molecules. Therefore, how to manipulate the size and shape of noble-metal materials remains a challenge and is attracting widespread attention.Another important factor that influences the catalytic capacity is the catalyst support. Good catalytic carriers providing a high specific area and narrow pore size distribution can effectively improve the amount of gold nanoparticle absorption and prevent the aggregation of gold nanoparticles. These catalytic carriers, such as polymers,17,18 carbon materials,19,20 and magnetic nanocomposites,21–24 have been extensively used. For example, Fang et al. synthesized core–shell Fe3O4@thermally crosslinked PANI@tungstophosphoric acid nanostructures, which exhibited high activity, facile magnetic recoverability, and robust stability.25 Zhang et al. prepared magnetic hollow triple-shelled FeCo2O4 (TS-FeCo2O4) microspheres with a 3D architecture that exhibited higher catalytic capacity.26 Kobotaeva et al. reported the preparation of metal-carbon carrier composite materials to expand the specific surface area, including Ag-multiwalled carbon nanotubes, Ag-carbon black, and Ni-multiwalled carbon nanotubes.27 Based on the abovementioned materials, graphene oxide can be used as a catalytic carrier providing a higher specific surface area and porous structure and resulting in a higher catalytic capacity. In addition, diamond has attracted extensive attention because of its mechanical and optical properties, high surface area and thermal conductivity, special chemical and electrochemical stability, and tunable surface structures.28–31 Dong et al. synthesized nanodiamond/nitrogen-doped graphene and used it as an effective metal-free electrocatalyst for the oxygen reduction reaction.32 Moreover, the separation and recyclability of the catalysts is another significant challenge. To overcome these challenges, the utilization of diamond as the core of catalyst composites improves the density and hardness of the hierarchical nanocomposites, which makes them easier to separate from the catalytic solution.33,34 This research work demonstrated a new material field for researchers to investigate diamond-based nanocomposites.
Therefore, in this presented work, we report the preparation of diamond@graphene oxide@AuNP (D@GO@AuNP) nanoparticles. The diamond@graphene oxide was obtained by a modified Hummers method using diamond@graphite as a reactant, which was synthesized by diamond annealing in an atmosphere of 10−3 Pa vacuum at a temperature of 1500 °C for 15 min. Then, the preparation of D@GO@AuNPs was accomplished via the electrostatic adsorption of gold nanoparticles, which were synthesized by the reaction between HAuCl4 and NaBH4. The prepared D@GO@AuNP nanocomposites were then used as a catalyst to carry out catalytic experiments with 4-nitrophenol and 2-nitroaniline. The results of the catalytic experiments indicated that these porous D@GO@AuNP nanocomposite catalysts have many advantages, including high catalytic activity, convenient separation, good dispersibility, high water stability, and excellent recyclability.
2. Materials and methods
2.1 Materials
Microdiamond powders were obtained from Element Six Ltd (Henan, China). Chloroauric acid tetrahydrate (HAuCl4·4H2O, 99.9%), sodium borohydride (NaBH4, 98%) and chloroacetic acid (Cl–CH2COOH, 99%) were provided by Alfa Aesar Company and Alfa Aesar Chemicals (Shanghai, China). 4-Nitrophenol (abbreviated as 4-NP, 99%) and 2-nitroaniline (abbreviated as 2-NA, 99%) were obtained from Alfa Aesar Company. Ammonia water (NH3·H2O, analytical reagent) and ethanol (C2H5OH, analytical reagent) were provided by Sinopharm Chemical Reagent Co., Ltd (Beijing, China). Other reagents and chemicals such as sulfuric acid (H2SO4, 98%, analytical reagent), potassium permanganate (KMnO4, analytical reagent), potassium nitrate (KNO3, analytical reagent), hydrogen peroxide (H2O2, 30%, analytical reagent), and hydrochloric acid (HCl, 37%, analytical reagent) were commercially provided by Beijing Chemicals and used without further purification. All aqueous solutions were prepared with water purified in a double-stage Millipore Milli-Q Plus purification system.2.2 Preparation of diamond-based nanocomposites
The preparation of diamond@graphite (abbreviated as D@G) and diamond@graphene oxide (abbreviated as D@GO) has been reported in our previous work.33 The characterization of these products was also presented in our previous work. The synthetic process of the diamond@graphene oxide@AuNPs (abbreviated as D@GO@AuNPs) was as follows: first, D@GO (10 mg) was put into an aqueous 100 mM HAuCl4 solution (50 mL) under conditions of vigorous mechanical stirring to form a stable liquid suspension. Second, 0.01 mol L−1 NaBH4 (10 mL) was added slowly into the above solution with vigorous mechanical stirring. Subsequently, the mixed solution was continuously stirred at room temperature for 2 hours. Then the D@GO@AuNP nanocomposites were obtained after centrifugation and washing with pure water several times.2.3 Catalytic test
Catalytic experiments of the present composites were carried out successfully according to previous reports.5 In the catalytic experiments, the first step was that the D@GO@AuNPs (20 mg) were added into ethanol (10 mL) to form a stable suspension. Fresh NaBH4 (0.1 mol L−1, 20 mL) was added into the solution of 4-NP (0.005 mol L−1, 20 mL) rapidly and then 2 mL of the D@GO@AuNP mixture with alcohol was also put into the solution. The supernatant liquid was obtained at the same time (2.5 min) intervals for subsequent characterization using a Shimadzu UV2550 spectrophotometer. With the addition of NaBH4, the UV/vis spectra of 4-NP showed a redshift of its characteristic absorption peak, due to the formation of 4-nitrophenolate. After the addition of the D@GO@AuNP catalyst, the absorbance at 401 nm was decreased because the 4-NP reacted with the NaBH4 to give 4-aminophenol. Therefore, the maximum absorbance at 401 nm was recorded to monitor the concentration of the residual samples (4-NP) with pre-established calibration curves. According to the previous steps, a catalytic experiment for 2-NA was also accomplished. The results showed that the 4-NP totally reacted within 12.5 min and the 2-NA solution changed from yellow to colorless within 22.5 min. Obviously, the catalytic efficiency for 4-NP was better than that for 2-NA. In order to verify the stability of the D@GO@AuNPs, recycling experiments for both 4-NP and 2-NA were carried out. With the addition of D@GO@AuNPs, the solution became colorless quickly. After complete reaction, the composites were washed and stirred several times in water. Then the same experimental steps were accomplished and the conversion values were averaged from five parallel tests. It turns out that the D@GO@AuNPs present good performance for eight consecutive cycles using the same composites and initial fresh solutions.2.4 Characterization
All of the present synthesized materials were obtained using an FD-1C-50 lyophilizer (Beijing Boyikang Experimental Instrument Co., Ltd., China) to completely remove water over 2–3 days. A field-emission scanning electron microscope (SEM) (S-4800II, Hitachi, Japan) and transmission electron microscope (TEM) (HT7700, Hitachi High-Technologies Corporation, Japan) were used to characterize the morphologies of the synthesized materials. Thermogravimetry (TG) characterization was accomplished within an argon gas atmosphere by using a NETZSCH STA 409 PC Luxxsi multaneous thermal analyzer (Netzsch Instruments Manufacturing Co, Ltd, Germany). X-ray diffraction (XRD) was measured via an X-ray diffractometer equipped with a Cu Kα X-ray radiation source and a Bragg diffraction setup (SMART LAB, Rigaku, Japan). Raman spectroscopy was performed using a Horiba Jobin Yvon Xplora PLUS confocal Raman microscope with an excitation laser wavelength of 532 nm and a laser power below 1 mW. X-ray photoelectron spectroscopy (XPS) was carried out using a Thermo Scientific ESCALab 250Xi with 200 W monochromated Al Kα radiation. Both survey scans and individual high-resolution scans for characteristic peaks were recorded. Elemental analysis was carried out with a Flash EA Carlo-Erba-1106 Thermo-Quest. BET measurements (NOVA 4200-P, US) were obtained to characterize the specific surface areas and pore diameter distribution. The catalytic experiments were monitored using a Shimadzu UV2550 spectrophotometer.3. Results and discussion
3.1 Characterization of diamond-based nanocomposites
The fabrication process of the D@GO@AuNP nanocomposites by means of chemical modification is shown in part (A) of Fig. 1. Intermediate products such as D@G and D@GO were synthesized according to our previous report.33 D@graphite (abbreviated as D@G) was obtained by utilizing diamond annealing under a 10−3 Pa vacuum at a temperature of 1500 °C for 15 min. Then, D@graphene oxide (abbreviated as D@GO) was subsequently synthesized via a modified Hummers method with the efficient oxidizers H2SO4 and HNO3. The preparation of D@graphene oxide@AuNPs (abbreviated as D@GO@AuNPs) was accomplished using electrostatic adsorption of gold nanoparticles that were synthesized by the reaction of HAuCl4 with NaBH4. Part (B) in Fig. 1 illustrates the catalytic reactions with the substrates 4-NP and 2-NA. More specifically, 4-nitrophenol reacted with NaBH4 to give 4-aminophenol (abbreviated as 4-AP). The reactant 2-nitroaniline changes into O-phenylenediamine (abbreviated as OPD) in the presence of the D@GO@AuNP nanocomposites.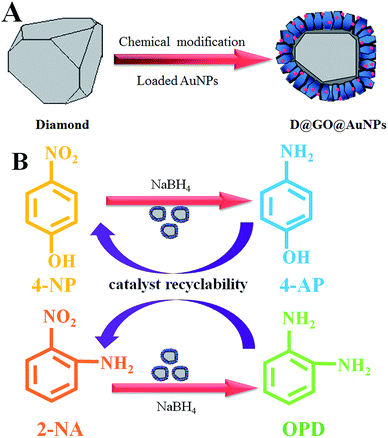 | ||
| Fig. 1 Schematic illustration of the synthesis of D@GO@AuNPs and presentation of the catalytic experiments with 4-NP and 2-NA. | ||
The morphologies of D@GO and D@GO@AuNPs were characterized by SEM and TEM as shown in Fig. 2. The pictures shown in (a) and (b) are the SEM and TEM of the D@GO nanocomposite. In these images, it is clear that the surface morphology exhibits a sheet structure, which is similar to that of graphene oxide. With the addition of gold nanoparticles, the morphology of the composites changed as presented in Fig. 2c and d. The surface of the sheet structure contained highlighted areas, which turned out to be the gold nanoparticles in the SEM image in (c). At the same time, an EDX image of the D@GO@AuNPs was acquired and is shown in Fig. 2, which demonstrates the presence of carbon, oxygen and gold elements. The detailed composition was found to be C = 37.41%, O = 36.78% and Au = 25.81%. The atomic percentages were found to be C = 56.18%, O = 41.46% and Au = 2.36%, indicating the successful modification of gold nanoparticles in the target composites.
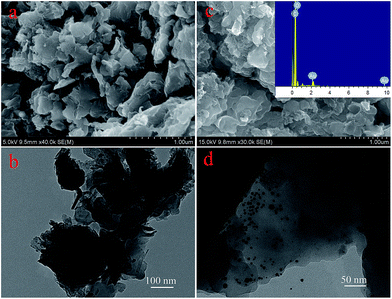 | ||
| Fig. 2 (a) SEM and (b) TEM images of the D@GO material; (c) SEM and EDX images of the as-prepared D@GO@AuNP composites; (d) TEM image of the D@GO@AuNPs. | ||
At the same time, the elemental analysis results are presented in Table 1 for all the nanocomposites. There were some differences between the intermediate products; for example, the content of oxygen changed from 99.25% for D@G to 64.57% for D@GO. With the addition of gold nanoparticles, the carbon content also changed from 64.57% to 64.10%. A TEM image of the D@GO@AuNPs is presented in Fig. 2d, in which gold nanoparticles are absorbed on the surface of the D@GO. The diameter of the gold nanoparticles was around 5–8 nm. The obtained gold nanoparticles were characterized specifically in our previous report.34 The UV-vis spectrum of the solution containing gold nanoparticles exhibited an adsorption peak at 516 nm indicating the generation of gold nanoparticles. In order to investigate the morphology of the gold nanoparticles, a TEM image was acquired, which indicated that the size of the gold nanoparticles was about 8–13 nm, providing more active sites and a higher specific area in the catalytic processes. The above characterization of the morphology indicated the successful modification of the gold nanoparticles.
| Sample | C [wt%] | H [wt%] |
|---|---|---|
| D@G | 99.25 | 0.17 |
| D@GO | 64.57 | 1.74 |
| D@GO@AuNPs | 64.10 | 1.60 |
On account of the obvious variation of the intermediate products, spectral characterization was performed as shown in Fig. 3. The XRD method was used to characterize all of the obtained nanocomposites and the corresponding XRD patterns are shown in Fig. 3a. The peak at 2θ = 43.92° attributed to the (111) cubic diamond plane was observed for all composites, indicating the existence of diamond. After the synthesis of D@G using the SPS technique,35 the peak at 2θ = 25.92° was attributed to the graphite (100) plane. A strong absorption peak at 11.67° was observed for D@GO, corresponding to the (001) reflection peak with a layer distance of 0.76 nm, which clearly indicates the formation of a GO layer on the surface of the D@G material. Furthermore, after the addition of gold nanoparticles, the peaks at 2θ values of 38.32°, 44.47°, 64.56° and 77.58° for the D@GO@AuNP nanocomposite could be ascribed to the (111), (200), (220), and (331) planes of the face-centered cubic structure of gold nanoparticles.
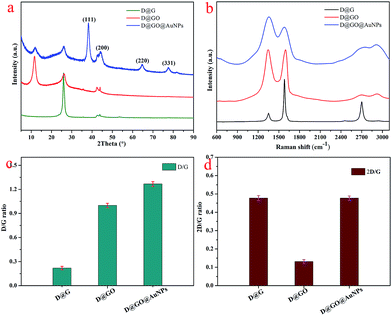 | ||
| Fig. 3 (a) XRD curves and (b) Raman spectroscopy of the as-prepared D@G, D@GO and D@GO@AuNPs; (c) and (d) images showing the 2D/G ratios and D/G ratios in the Raman data. | ||
Simultaneously, Raman spectroscopy was also performed to provide useful characteristic structural information, especially for the carbon-based nanomaterials.36 As shown in Fig. 3b, three characteristic bands of graphene sheets in the Raman spectra appeared for the obtained composites, including the G band (1601 cm−1) from the first-order scattering of the E2g phonons in the sp2-hybridized carbon atoms, the D band (1351 cm−1) from the breathing mode of K-point phonons of A1g symmetry of the defects in the sp3-hybridized carbon bonds (hydroxyl and/or epoxide bonds), and the 2D band (2692 cm−1), which is very sensitive to the stacking of graphene sheets.37,38 In addition, the 2D/G ratios for graphene sheets with different numbers of layers (1, 2, 3, and >4) are normally >1.6, 0.8, 0.30, and 0.07, respectively.39,40 For example, Akhavan and co-workers investigated single and bilayer GO sheets with 2D/G ratios in the ranges of 1.53–1.68 and 0.82–0.89, respectively.41 In particular, the D/G ratio peak intensity can act as a characteristic factor of the sp2 area size of graphene sheets containing sp3 and sp2 bonds.42,43 The corresponding values for D@G, D@GO and D@GO@AuNPs were calculated to be from 0.22 to 1.27, as presented in Fig. 3c. The value for the D@GO@AuNPs was larger than that for the D@G and D@GO composites, indicating more defect layers due to the reduction of NaBH4. As for the 2D/G ratios shown in Fig. 3d, the value for the D@GO@AuNPs was 0.47, which was equal to the value for D@G, indicating the presence of three layers of GO sheets. The 2D/G ratio of D@GO was about 0.13, which suggested that multilayer GO structures had been formed in the obtained composites.
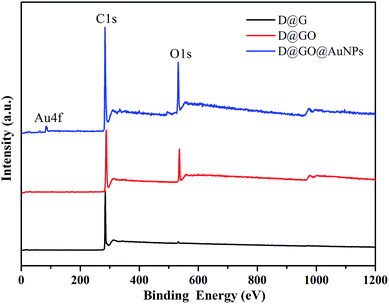
The surface compositions of the as-obtained D@GO@AuNPs were characterized using the XPS method, which is important to inspect the successful preparation of the nanocomposites. Fig. 4 demonstrates the characteristic peaks, such as C(1s), O(1s), and Au(4f), for the surface elemental composition of the D@G, D@GO and D@GO@AuNPs.
The curve presented three peaks, Au(4f), C(1s) and O(1s), indicating the composition of the D@GO@AuNP nanocomposite. The composition percentage for gold nanoparticles in the D@GO@AuNPs was about 0.33%, which corresponded to an atomic percentage of 0.28%. The spectrum of D@GO showed strong peaks of carbon and oxygen elements. D@G was composed mainly of the element carbon. The trace oxygen content in the D@G material may originate from moisture or background of the measurement environment.
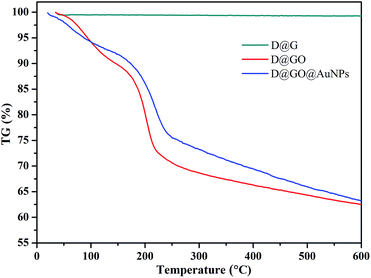
After the diamond-based composites modified with gold nanoparticles had been designed and prepared for the catalytic experiments, the thermal stability of the lyophilized as-synthesized D@G, D@GO and D@GO@AuNP composites were analyzed via thermograms (TG) under argon atmosphere, as presented in Fig. 5. The D@G material showed good thermal stability and demonstrated 99.3% quality preservation at 600 °C. For the cases of the D@GO and D@GO@AuNP materials, the quality preservation values at 130 °C were 91.3% and 92.7%, respectively, which seemed to be mainly due to evaporation of physisorbed water. The difference between D@G and the two other materials could be reasonably explained by the mesoporous structures of the GO layers on the material surface, which can easily absorb the moisture in the air. With an increase in temperature, the quality declined until 63.6% and 62.4% quality preservation was observed for the D@GO and D@GO@AuNPs materials at 600 °C, which could be due to the decomposition of oxygen-containing components in the composite materials.44 It is possible for amorphous carbon to form at the material interface during annealing of the D@GO and D@GO@AuNPs. The quality preservation of the D@GO@AuNPs is slightly larger than that of D@GO, which suggests the existence of gold nanoparticles on the surface of the D@GO@AuNP material.
Fig. 6 shows the Barrett–Joyner–Halenda (BJH) measurements, which were carried out using N2 adsorption–desorption isotherms to further investigate the microstructural characteristics, including specific surface area and pore volume, of the as-prepared D@G, D@GO and D@GO@AuNP composites. The isotherms of both D@GO and the D@GO@AuNPs exhibited hysteresis loops of type IV isotherms as presented in Fig. 6a, with adsorption and desorption jumps at 0.30 and 0.95, which were characteristic of mesoporous materials. For the D@G nanocomposites, a significant hysteresis loop could be observed at the pressure P/P0 = 0.45–0.95, thereby indicating the mesoporous structure of the prepared materials. The D@GO composite showed more pores and a larger specific area than the D@G structure. According to the BET measurements presented in Fig. 6b, the pore size distribution of D@GO showed a larger mesoporous size of 16.03 nm, compared to 15.21 nm for D@G, assigned to the successful preparation of graphene oxide. However, the pore size distribution of the D@GO@AuNPs was about 15.80 nm, which was smaller than that of D@GO on account of the presence of gold nanoparticles in the pores. The BET surface area and total pore volume data are presented in Table 2. The specific surface area of the diamond-based mesoporous D@GO@AuNPs was calculated to be 22.37 m2 g−1, which was smaller than the specific surface area of 25.98 m2 g−1 for the D@GO nanocomposite. According to the preparation process of the D@GO@AuNPs, the graphene oxide was reduced to reduced graphene oxide in the presence of NaBH4 causing a decrease in the specific surface area. Furthermore, the specific surface of D@G was about 16.66 m2 g−1, which was smaller than that of D@GO, due to the formation of GO layers on the surface of the support. On account of the appearance of gold nanoparticles in the stratum pores, the pore volume of D@GO (0.078 cm3 g−1) was larger than that of the D@GO@AuNPs (0.072 cm3 g−1), and the pore volume of D@G was clearly smaller than that of D@GO, which was also in good agreement with the average pore diameter presented in Table 2. Higher specific surface areas can be expected to increase the absorption capacity of the gold nanoparticles, and larger pore diameters and pore volumes indicate a large number of micro/nanoscale channels for the gold nanoparticles to transfer into the composites, thereby making them effective for catalytic reactions.
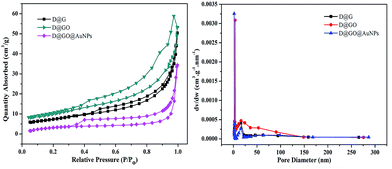 | ||
| Fig. 6 (a) N2 adsorption–desorption isotherms and (b) pore size distribution of D@G, D@GO and D@GO@AuNPs. | ||
| Sample | Specific surface area (m2 g−1) | Average pore diameter (nm) | Pore volume (cm3 g−1) |
|---|---|---|---|
| D@G | 16.66 | 15.21 | 0.070 |
| D@GO | 25.98 | 16.03 | 0.078 |
| D@GO@AuNPs | 22.37 | 15.80 | 0.072 |
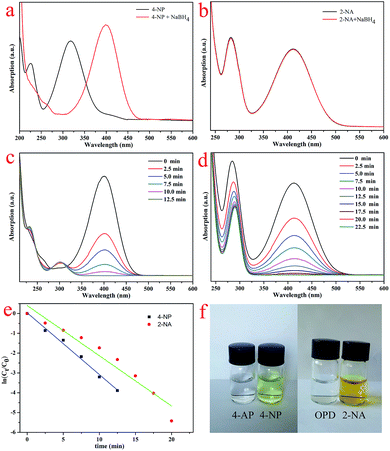
With the purpose of catalyzing the reduction of 4-NP and 2-NA solutions using NaBH4, D@GO nanocomposites modified with gold nanoparticles were designed and synthesized. The UV-vis spectra of the catalytic experiments are shown in Fig. 7. Fig. 7a presents the characteristics of the 4-NP solution after the addition of fresh NaBH4 for 10 min. There was a clear difference in that the maximum peak position was remarkably red-shifted to 401 nm. Meanwhile, the color of the mixture changed from yellow to slight yellowish-green owing to the formation of 4-nitrophenolate ions. With the addition of NaBH4 to a 2-NA solution, there was no variation in the maximum peak position with absorption, as shown in Fig. 7b. The catalytic processes were investigated to monitor the catalytic efficiency of the D@GO@AuNPs, as presented in Fig. 7c and d. The absorption curves for the mixtures were obtained during the same period of 2.5 min. When the catalyst was added into the mixture of 4-NP and NaBH4, the maximum absorbance peak at 401 nm quickly disappeared within 12.5 min because the 4-NP reacted to produce 4-AP. At the same time, a new peak appeared at 295 nm, which can be assigned to the characteristic absorption of the product 4-aminophenol. On the other hand, the catalytic experiment with 2-NA was also accomplished as illustrated in Fig. 7d and the maximum absorbance peak at 413 nm completely disappeared within 22.5 min, indicating that all of the 2-NA reacted to produce OPD and the color of the solution changed from yellow to colorless. In view of the above-mentioned analysis results, it can be concluded that the D@GO@AuNP composites had excellent catalytic activity. On account of the much higher concentration of NaBH4 solution relative to that of 4-NP (CNaBH4/C4-NP = 400), the whole catalytic process could be regarded as a pseudo-first-order reaction with respect to the reactant 4-NP, which indicated that the concentration of NaBH4 was assumed to be constant. The present experiments show the same rule of pseudo-first-order reaction compared with other catalysts with AuNPs mentioned in the introduction part. A similar conclusion could also be applied for the catalytic experiment of 2-NA. For the above-mentioned conditions, the ratio of Ct/C0 was proportional to the relative absorbance ratio (At/A0) according to the Lambert–Beer law. More specifically, Ct is the concentration at time t and C0 represents the initial concentration. Simultaneously, At and A0 represent the absorbance of the maximum peak at time t and the initial point. The linear relationship between ln(Ct/C0) and time (t) for the D@GO@AuNP catalyst presented in Fig. 7e demonstrates that the catalytic reaction could well be considered as a pseudo-first-order reaction. The calculated first-order rate constant for the 4-NP solution was 0.312 min−1, which was higher than the constant (0.254 min−1) for 2-NA, indicating the better catalytic effect due to the porosity and large surface area of the presently obtained nanocomposite catalysts. Furthermore, the presently obtained results show good accordance with previous reports about the catalysis of 4-NP and 2-NA.5,22,45,46 The images of the catalytic solutions of 4-NP and 2-NA presented in Fig. 7f illustrate the color change from slight yellow-green to colorless for the 4-NP mixture, and from rich yellow to colorless for the 2-NA solution, indicating the totally finished catalytic processes.
Furthermore, it is well-known that excellent catalysts with extensive applications have the advantages of good reutilization and stability.47–54 On account of these conditions, the catalytic experiments were repeated for eight consecutive cycles with the 4-NP and 2-NA solutions, as presented in Fig. 8. The obtained results demonstrated that the catalytic activity remained at about 95% for the 4-NP solution and 91% for the 2-NA solution, which indicated the excellent stability and reutilization of the synthesized nanocomposites. In comparison with other kinds of composites with AuNPs mentioned in the introduction part, the presently obtained D@GO@AuNP catalyst shows an acceptable effect for the present model reaction and demonstrates potential industrial applications. Due to the loss of gold nanoparticles during the washing steps, there was a slight decrease in the catalytic efficiency. At the same time, the diamond used as the core of the nanocomposites provided good conditions for separation from the solution. Given all of the above results, the as-prepared nanocomposites introduce a new field for the investigation of new diamond-based composite catalyst materials.
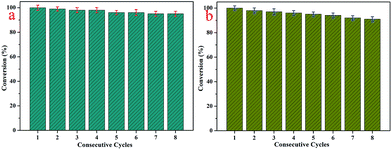 | ||
| Fig. 8 (a) Reusability test of D@GO@AuNP nanocomposites as catalysts for the reduction of 4-nitrophenol; (b) repeated experiments with the D@GO@AuNP catalyst for 2-NA. | ||
4. Conclusions
To summarize, we have successfully prepared diamond-based nanocomposites modified with gold nanoparticles. The obtained D@GO@AuNP nanocomposites were used as a new catalyst material due to their high surface area and mesoporous nanostructure. The gold nanoparticles with an appropriate diameter were synthesized via reduction by NaBH4. In addition, the diamond as the core of the D@GO@AuNP material makes the catalyst easy to separate from the complicated catalytic solution. At the same time, the mesoporous structure of the composite material could successfully prevent the agglomeration of the gold nanoparticles and retain a well dispersed state. 4-NP and 2-NA solutions were catalyzed using the synthesized innovative nanocomposites, and the results showed efficient catalytic capacity, demonstrating the excellent catalytic performance of the prepared D@GO@AuNPs. Furthermore, 8 cycles of repeated experiments were carried out to demonstrate the excellent stability and reutilization of the present composites, and the obtained results showed that the catalytic activity of the diamond-based nanocomposites still remained high at about 95% for the 4-NP solution and 91% for the 2-NA solution. The as-prepared catalytic composite materials demonstrated many advantages, such as high catalytic activity, good water stability and excellent recyclability, and are expected to open a new avenue for the design and preparation of diamond functionalized and AuNP-modified composites.Conflicts of interest
There are no conflicts to declare.Acknowledgements
We greatly acknowledge the financial support from the National Natural Science Foundation of China (No. 21473153 and 51402253), Support Program for the Top Young Talents of Hebei Province, Post-Graduate's Innovation Fund Project of Hebei Province (No. CXZZSS2017058), China Postdoctoral Science Foundation (No. 2015M580214), Undergraduate Training Programs for Innovation and Entrepreneurship of Yanshan University (No. CXXL2017227), and Scientific and Technological Research and Development Program of Qinhuangdao City (No. 201701B004).Notes and references
- L. Y. Ruan, E. B. Zhu, Y. Chen, Z. Y. Lin, X. Q. Huang, X. F. Duan and Y. Huang, Angew. Chem., Int. Ed., 2013, 52, 12577–12581 CrossRef CAS PubMed.
- Y. H. Zhang, F. Chen, J. H. Zhuang, Y. Tang, D. J. Wang, Y. J. Wang, A. G. Dong and N. Ren, Chem. Commun., 2002, 23, 2814–2815 RSC.
- R. R. Xing, K. Liu, T. Jiao, N. Zhang, K. Ma, R. Zhang, Q. Zou, G. Ma and X. Yan, Adv. Mater., 2016, 28, 3669–3676 CrossRef CAS PubMed.
- Y. Wu, D. S. Wang and Y. D. Li, Chem. Soc. Rev., 2014, 43, 2112–2124 RSC.
- W. C. Guo, Q. Wang, Y. Luan, G. Wang, W. J. Dong and J. Yu, Chem.–Asian J., 2015, 10, 701–708 CrossRef CAS PubMed.
- Z. W. Zhao, J. Liu, F. Y. Cui, H. Feng and L. L. Zhang, J. Mater. Chem., 2012, 22, 9052–9057 RSC.
- C. L. Hou, K. Ma, T. F. Jiao, R. R. Xing, K. K. Li, J. X. Zhou and L. X. Zhang, RSC Adv., 2016, 6, 110799–110807 RSC.
- A. N. Wang, Q. Peng and Y. D. Li, Chem. Mater., 2011, 23, 3217–3222 CrossRef CAS.
- Y. Chi, Q. Yuan, Y. J. Li, J. C. Tu, L. Zhao, N. Li and X. T. Li, J. Colloid Interface Sci., 2012, 383, 96–102 CrossRef CAS PubMed.
- S. Baek, K. H. Kim, M. J. Kim and J. J. Kim, Appl. Catal., B, 2017, 217, 313–321 CrossRef CAS.
- S. Kamyar, M. B. Ahmad, W. M. Z. Wan Yunus, N. A. Ibrahim, Y. Gharayebi and S. Sedaghat, Int. J. Nanomed., 2010, 5, 1067–1077 CrossRef PubMed.
- W. C. Liu, W. T. Ralston, G. Melaet and G. Somojai, Appl. Catal., A, 2017, 545, 17–23 CrossRef CAS.
- S. Kamyar, B. A. Mansor, Z. Mohsen, W. M. Z. W. Yunus, N. A. Ibrahim, P. Shabanzadeh and M. G. Moghaddam, Int. J. Nanomed., 2011, 6, 271–284 CrossRef PubMed.
- M. B. Ahmad, K. Shameli, W. M. Z. W. Yunus, N. A. Ibrahim and M. Darroudi, Aust. J. Basic Appl. Sci., 2010, 4, 2158–2165 Search PubMed.
- K. Shameli, M. Bin Ahmad, S. D. Jazayeri, S. Sedaghat, P. Shabanzadeh, H. Jahangirian, M. Mahdavi and Y. Abdollahi, Int. J. Mol. Sci., 2012, 13, 6639–6650 CrossRef CAS PubMed.
- Z. U. H. Khan, A. Khan, Y. Chen, A. Ullah Khan, N. S. Shah, N. Muhammad, B. Murtaza, K. Tahir, F. Ullah Khan and P. Wan, J. Alloys Compd., 2017, 725, 869–876 CrossRef.
- S. F. Zhang, W. Wu, X. G. Xiao, J. Zhou, J. X. Xu, F. Ren and C. Z. Jiang, Chem.–Asian J., 2012, 7, 1781–1788 CrossRef CAS PubMed.
- P. P. Zhao, Y. Leng and J. Wang, Chem. Eng. J., 2012, 204, 72–78 CrossRef.
- M. M. Titirici and M. Antonietti, Chem. Soc. Rev., 2010, 39, 103–116 RSC.
- N. S. Kobotaeva, T. S. Skorokhodova and N. V. Ryabova, Russ. J. Phys. Chem. A, 2015, 89, 462–468 CrossRef CAS.
- A. Khder, H. A. Hassan and M. S. El-Shall, Appl. Catal., A, 2014, 487, 110–118 CrossRef CAS.
- T. J. Yao, T. Y. Cui, X. Fang, F. Cui and J. Wu, Nanoscale, 2013, 5, 5896–5904 RSC.
- S. Z. Hao and H. W. Zhang, J. Cleaner Prod., 2017, 167, 192–200 CrossRef CAS.
- B. B. Jiang, X. D. Wang and D. Z. Wu, Appl. Energy, 2017, 201, 20–33 CrossRef CAS.
- L. N. Fang, G. Wang and W. C. Guo, Colloids Surf., A, 2017, 533, 204–212 CrossRef CAS.
- D. F. Zhang, G. Z. Zhang and L. Zhang, Chem. Eng. J., 2017, 330, 792–803 CrossRef CAS.
- N. S. Kobotaeva, T. S. Skorokhodova, G. I. Razd'yakonova and O. K. Poleshchuk, Russ. J. Phys. Chem. A, 2017, 91, 1197–1203 CrossRef CAS.
- Q. Huang, D. L. Yu, B. Xu, W. T. Hu, Y. M. Ma, Y. B. Wang, Z. S. Zhao, B. Wen, J. L. He, Z. Y. Liu and Y. J. Tian, Nature, 2014, 510, 23 CrossRef PubMed.
- A. R. Kamali, Carbon, 2017, 123, 205–215 CrossRef CAS.
- V. N. Mochalin, O. Shenderova, D. Ho and Y. Gogotsi, Nat. Nanotechnol., 2012, 7, 11–23 CrossRef CAS PubMed.
- J. F. Pérez, J. Llanos, C. Sáez, C. López, P. Cañizares and M. A. Rodrigo, Electrochem. Commun., 2017, 82, 85–88 CrossRef.
- L. Dong, J. B. Zang, J. Su, Y. D. Jia, Y. H. Wang, J. Lu and X. P. Xu, Electrochim. Acta, 2015, 174, 1017–1022 CrossRef CAS.
- X. N. Zhao, K. Ma, T. Jiao, R. Xing, X. Ma, J. Hu, H. Huang, L. Zhang and X. Yan, Sci. Rep., 2017, 7, 44076 CrossRef PubMed.
- X. N. Zhao, T. F. Jiao, X. L. Ma, H. Huang, J. Hu, Y. Qu, J. X. Zhou, L. X. Zhang and Q. M. Peng, J. Taiwan Inst. Chem. Eng. DOI:10.1016/j.jtice.2017.08.038.
- Y. J. Wang, J. B. Zang, L. Dong, H. Pan, Y. G. Yuan and Y. H. Wang, Electrochim. Acta, 2013, 113, 583–590 CrossRef CAS.
- X. Du, P. Guo, H. H. Song and X. H. Chen, Electrochim. Acta, 2010, 55, 4812–4819 CrossRef CAS.
- A. C. Ferrari, J. C. Meyer, V. Scardaci, C. Casiraghi, M. Lazzeri, F. Mauri, S. Piscanec, D. Jiang, K. S. Novoselov, S. Roth and A. K. Geim, Phys. Rev. B: Condens. Matter, 2006, 97, 187401 CAS.
- L. M. Malard, M. A. Pimenta, G. Dresselhaus and M. S. Dresselhaus, Phys. Rep., 2009, 473, 51–87 CrossRef CAS.
- T. Balashov, A. F. Takács, W. Wulfhekel and J. Kirschner, Phys. Rev. Lett., 2006, 97, 187201 CrossRef CAS PubMed.
- I. Calizo, A. A. Balandin, W. Bao, F. Miao and C. N. Lau, Nano Lett., 2007, 7, 2645–2649 CrossRef CAS PubMed.
- O. Akhavan, Carbon, 2015, 81, 158–166 CrossRef CAS.
- K. S. Kim, Y. Zhao, H. Jang, J. M. Kim, K. S. Kim, J. H. Ahn, P. Kim, J. Y. Choi and B. H. Hong, Nature, 2009, 457, 706–710 CrossRef CAS PubMed.
- K. N. Kudin, B. Ozbas, H. C. Schniepp, R. K. Prud'Homme, I. A. Aksay and R. Car, Nano Lett., 2008, 8, 36–41 CrossRef CAS PubMed.
- S. Konwer, R. Boruah and S. K. Dolui, J. Electron. Mater., 2011, 40, 2248–2255 CrossRef CAS.
- W. Guo, Q. Wang, G. Wang, M. Yang, J. W. Dong and J. Yu, Chem.–Asian J., 2013, 8, 1160–1167 CrossRef CAS PubMed.
- R. Guo, T. Jiao, R. Xing, Y. Chen, W. Guo, J. Zhou, L. Zhang and Q. Peng, Nanomaterials, 2017, 7, 317 CrossRef PubMed.
- H. Y. Guo, T. F. Jiao, Q. R. Zhang, W. F. Guo, Q. M. Peng and X. H. Yan, Nanoscale Res. Lett., 2015, 10, 272 CrossRef PubMed.
- R. Xing, W. Wang, T. Jiao, M. Kai, Q. Zhang, W. Hong, H. Qiu, J. Zhou, L. Zhang and Q. Peng, ACS Sustainable Chem. Eng., 2017, 5, 4948–4956 CrossRef CAS.
- S. W. Huo, P. F. Duan, T. F. Jiao, Q. M. Peng and M. H. Liu, Angew. Chem., Int. Ed., 2017, 56, 12174–12178 CrossRef CAS PubMed.
- R. Y. Zhang, R. R. Xing, T. F. Jiao, K. Ma, C. J. Chen, G. H. Ma and X. H. Yan, ACS Appl. Mater. Interfaces, 2016, 8, 13262–13269 CAS.
- Y. M. Liu, K. Ma, T. F. Jiao, R. R. Xing, G. Z. Shen and X. H. Yan, Sci. Rep., 2017, 7, 42978 CrossRef CAS PubMed.
- R. R. Xing, T. F. Jiao, Y. M. Liu, K. Ma, Q. L. Zou, G. H. Ma and X. H. Yan, Polymers, 2016, 8, 181 CrossRef.
- Z. Chen, Z. Ma, J. Song, L. Wang and G. Shao, J. Power Sources, 2016, 324, 86–96 CrossRef CAS.
- W. Yang, W. Yang, A. Song, L. Gao, G. Sun and G. Shao, J. Power Sources, 2017, 348, 175–182 CrossRef CAS.
| This journal is © The Royal Society of Chemistry 2017 |

