 Open Access Article
Creative Commons Attribution 3.0 Unported Licence
A first-principles study of titanium oxide clusters formation and evolution in a steel matrix
Wenqiang Bao a,
Wei Zhangb,
Huigai Li*a,
Shaobo Zhenga and
Qijie Zhaia
aState Key Laboratory of Advanced Special Steel, Shanghai Key Laboratory of Advanced Ferrometallurgy, School of Materials Science and Engineering, Shanghai University, Shanghai 200072, China. E-mail: lihuigai@shu.edu.cn
bShanghai Institute of Applied Physics, Chinese Academy of Sciences (CAS), Shanghai 201800, China
First published on 10th November 2017
Abstract
The structures and evolution law of TimOn clusters in a bcc Fe matrix are studied by using first-principles calculations. In a bcc lattice, the Ti and O atoms attract each other strongly when the second nearest neighbor site to interstitial O has been replaced by Ti. The Ti–O and Ti–Ti bonds are two dominating factors affecting the stability of clusters. Ti–O bonds have more contributions to the stability of clusters than Ti–Ti bonds. The stoichiometric ratio of Ti to O tends to stay 1![[thin space (1/6-em)]](https://www.rsc.org/images/entities/char_2009.gif) :
:![[thin space (1/6-em)]](https://www.rsc.org/images/entities/char_2009.gif) 1 in titanium oxide clusters by absorbing Ti/O atoms and then the cluster tends to absorb O atoms. The stable rhombus-shaped structure Ti2O2 is suggested to be the smallest unit of titanium oxide inclusions in steel. This work provides practical information for further study of oxide inclusion nucleation.
1 in titanium oxide clusters by absorbing Ti/O atoms and then the cluster tends to absorb O atoms. The stable rhombus-shaped structure Ti2O2 is suggested to be the smallest unit of titanium oxide inclusions in steel. This work provides practical information for further study of oxide inclusion nucleation.
Introduction
Fine titanium oxides such as TiO, TiO2, Ti2O3 and Ti3O5 can serve as heterogeneous nucleation sites for intragranular ferrite (IGF) in low-alloy steels, which could improve the toughness of steel.1–3 It is difficult to study the nucleation mechanism of titanium oxide in experiments due to the high temperature of melt (1400–1500 °C). It has been confirmed that first-principles calculation provides a practicable and predictive approach for studying the mechanism of nucleation from the view of atomic crystal structures. Normally, to acquire fundamental insight into titanium oxides nucleation, it is necessary to understand the interaction between Ti and O solute elements, the formation of a titanium oxide cluster, and the evolution of the cluster in the bcc Fe matrix.Previous first-principles calculation studies were focused on the formation and stability of TiOx clusters without a matrix. Y. Guo et al. found that (TiO2)n was the most stable structure among the investigated titanium oxygen species.4 Compact structures preferred to form among (TiO2)n clusters with increasing cluster size.5 D. A. Dixon et al. investigated some equilibrium geometries of defect-free (TiO2)n (n = 1–4) clusters showing a structural similarity to the natural anatase phase.6 W. W. Zhang et al. summarized several structural rules of (TiO2)n clusters from the perspective of bonding properties and bonding number.7 In these previous studies, the influence of the steel matrix on the formation and stability of TiOx clusters was not taken into consideration. Y. Jiang et al. studied the formation mechanism of Y–Ti–O nanoclusters in bcc Fe lattice, showing that the matrix affected the subsequent precipitations of (Y–Ti–O) nanoclusters by providing limited candidate locations for dissolved solutes.8 However, these studies mostly focused on free-standing titanium oxide cluster. The interaction between solute atoms, the structure of titanium oxide clusters in bcc Fe and even their evolution law keep unknown.
In the present work, the interactions between Ti, O and Fe matrix, the structure of TimOn clusters with m, n ranging from 1 to 4 in bcc-Fe lattice and its possible evolution pathways have been explored using first-principles calculation. The binding energy of different TimOn clusters was calculated to find the relative stability of the clusters in bcc Fe lattice. The structural evolution pathways were speculated, which was helpful to understand the nucleation of titanium oxides.
Calculation details
The calculations were carried out using the Vienna Ab initio Simulation Package (VASP)9 based on the density functional theory (DFT).10 To describe the interactions between ions and electrons, standard projector augmented wave pseudopotential (PAW)11 were used for Fe, Ti, and O with 8 (3d64s2), 4 (3d4), and 6 (2s22p6) valence electrons, respectively. Exchange and correlation energy was treated by a generalized gradient approximation with the Perdew–Burke–Ernzerhof functionals (PBE-GGA).12 At 0 K, the optimal lattice constant of bcc-Fe was calculated to be 2.83 Å which was consistent with experimental value of 2.85 Å (ref. 13) and other DFT calculations.14,15 The cutoff energy for the wave expansion was set to be 310 eV. A 4 × 4 × 4 supercell of 128 (±1, ±2, …) atoms was used in calculations. All the calculations were spin polarized. In structural optimizations, the shape and size of the supercell and atomic configuration were fully relaxed until the Hellman–Feynman force on all atoms had fallen below 0.01 eV Å−1, while the electronic degrees of freedom were converged to at least 10−6 eV per atom. The standard conjugate-gradient algorithm implemented in the VASP code was used to relax the ions. A finite-temperature smearing method of first-order (N = 1) Methfessel–Paxton was used throughout with the smearing width, σ, setting to 0.2 eV to keep the difference between the free energy and the total energy negligible (less than 1 meV per atom). Brillouin zone integration was performed with a 3 × 3 × 3 k-point mesh by Monkhorst–Pack scheme for energy calculation.To describe the chemical stability of interstitial oxygen atoms and titanium oxide clusters in Fe lattice, two energetic quantities were defined: the equilibrium formation energy and binding energy.
The equilibrium formation energy, ΔEeqf(Fen/O) was given by the following formula:
| ΔEeqf(Fen/O) = E(Fen/O) − nE(Fe) − E(O) | (1) |
The binding energy of titanium oxide clusters in Fe lattice, Etb(TimOn), was defined as follows:20
| Etb(TimOn) = {mEt(FeN−1Ti) + nEt(FeNO)} − {Et(FeN−mTimOn) + (m + n − 1)Et(FeN)} | (2) |
The binding energy can be decomposed into distortion and electronic binding energy, (Edb(TimOn), and Eeb(TimOn), respectively:
| Etb(TimOn) = Edb(TimOn) + Eeb(TimOn) | (3) |
 | (4) |
 were the total energy of the configuration without Ti, O, and TimOn, respectively. They could be calculated by removing Ti, O and TimOn from fully relaxed Fe supercell containing Ti, O and TimOn, respectively. Then the total energy could be calculated without relaxation. The electronic binding energy can be obtained by eqn (3) and (4). The incremental binding energy, EXI(TimOn), was defined and calculated as:
| EXI(TimOn) = Etb(TimOn + X) − Etb(TimOn) | (5) |
The formation energies of O atoms in the substitutional site (S-site), octahedral interstitial site (O-site), and tetrahedral interstitial site (T-site) were calculated. It was found that O preferred the O-site over the T-site and S-site (see Table 1), which is in agreement with the previously findings.21–23
| Configuration | Eeqf | (% Δr1/r01) | (% Δr2/r02) | (% Δε) |
|---|---|---|---|---|
| Fe128O(oct) | −2.50 | +27.31 | +0.97 | 1.02 |
| Fe128O(tet) | −1.77 | +13.35 | +1.23 | 1.46 |
| Fe127O(sub) | −0.90 | +2.34 | −2.36 | 0.24 |
Results and discussion
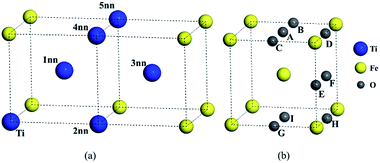
Unlike independent atoms, Ti and O as solute atoms are confined by the Fe matrix. The interaction between solutes were analyzed from the perspective of binding energy and the differential charge density distributions.The configurations for the pairs in bcc Fe were shown in Fig. 1. The binding energy of Ti–Ti and O–O pairs and distance between two atoms were calculated and listed in Table 2. The substitutional site inn stands for the first to the fifth nearest neighbors (1nn to 5nn) relative to a substitutional solute or an octahedral interstitial in this study. The binding energy between Ti solutes in bcc Fe lattice is negative at the 1nn, 2nn, 3nn, and 4nn sites and close to 0 at 5nn site, which means that Ti solute atoms are not liable to aggregate in bcc Fe. The interaction of O–O pairs appears strongly attractive in the configuration BC with a positive binding energy of 0.239 eV, (0.24 eV by C. Barouh et al.22).
| Different configuration | Etb (eV) | Distance (Å) | Different configuration | Etb (eV) | Distance (Å) |
|---|---|---|---|---|---|
| Ti–Ti | O–O | ||||
| Cfg (1nn) | −0.360 | 2.648 | Cfg (AF) | −0.382 | 2.351 |
| Cfg (2nn) | −0.251 | 2.912 | Cfg (AI) | −1.457 | 3.441 |
| Cfg (3nn) | −0.183 | 4.031 | Cfg (AE) | 0.149 | 2.501 |
| Cfg (4nn) | −0.012 | 4.726 | Cfg (AH) | −0.152 | 3.369 |
| Cfg (5nn) | 0.030 | 4.924 | Cfg (BC) | 0.239 | 2.758 |
| Cfg (BD) | −0.380 | 2.347 | |||
| Cfg (BE) | −0.050 | 3.502 | |||
| Cfg (BG) | 0.064 | 3.872 |
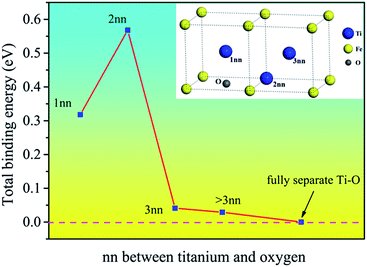
The binding energies of Ti–O pairs at different nearest neighbor positions were presented in Fig. 2. The results show that the Ti and O atoms will attract each other to form Ti–O pairs in bcc Fe. The first and second nearest neighboring Ti–O pairs have quite large positive binding energy, but the value decreases quickly after the second nearest neighbor and is near to zero at the third nearest neighbor, indicating that the interaction is negligible at third nearest neighbor distance. The Ti–O pairs are especially stable when Ti and O atoms are at the second nearest neighbor distance. The attractive interaction between Ti and O can promote the formation of Ti–O clusters in bcc Fe. Nanoscale clusters enriched in O and Ti had been detected in steel matrix.24,25
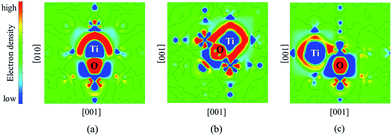
The differential charge density distributions were calculated to analyze the electronic structures of Ti–O pairs in bcc Fe. It can be seen from Fig. 3 that significant charges transfer from Ti atoms to O atoms. The interaction between Ti and O presents ionic binding characteristics. There exists certain amount of charges around the Ti–O pair, which means that the pair and the bcc Fe matrix share an amount of charges. Moreover, 2nn Ti–O pair shares the most amount of charges with bcc Fe compared to 1nn and 3nn pairs (details see Fig. 3). The result indicated that Fe matrix contributes to the strong interactions of 2nn.
As a next step, we performed calculations of a number of small TimOn clusters, (m and n ranged from 1 to 4) to find the most stable structures by comparing total energies among their isomers. Furthermore, we also explored the key factors that influence the stability of structures. The initial nanostructures of titanium oxide clusters were generated according to the following rules: (i) Ti exists as a substitutional atom, and O atom prefers to be at an octahedral interstitial site in bcc Fe lattice. (ii) The new structures were constructed by successively adding Ti atom or O atom to an existed small optimized cluster. (iii) Newly inserted O atoms and O atoms in the cluster form the most stable BC configuration. (iv) The Ti–O and Ti–Ti bonds are supposed to form if the distances are smaller than 2.15 Å and 3.00 Å, respectively, which are reasonable values compared to the shortest Ti–O distance (1.95 Å) and Ti–Ti distances (2.96 Å) in rutile.26 (v) Only the first and second nearest neighbor sites to O atom are replaced by Ti atom to form so-called “compact clusters”. Similar rules have also been found in the investigation of stable VacnAlm clusters in α-Fe,27 Vac-Asn clusters in Ge28 and X-Pbn(Bin) complex (X = He, Vac, Div) in Fe.29
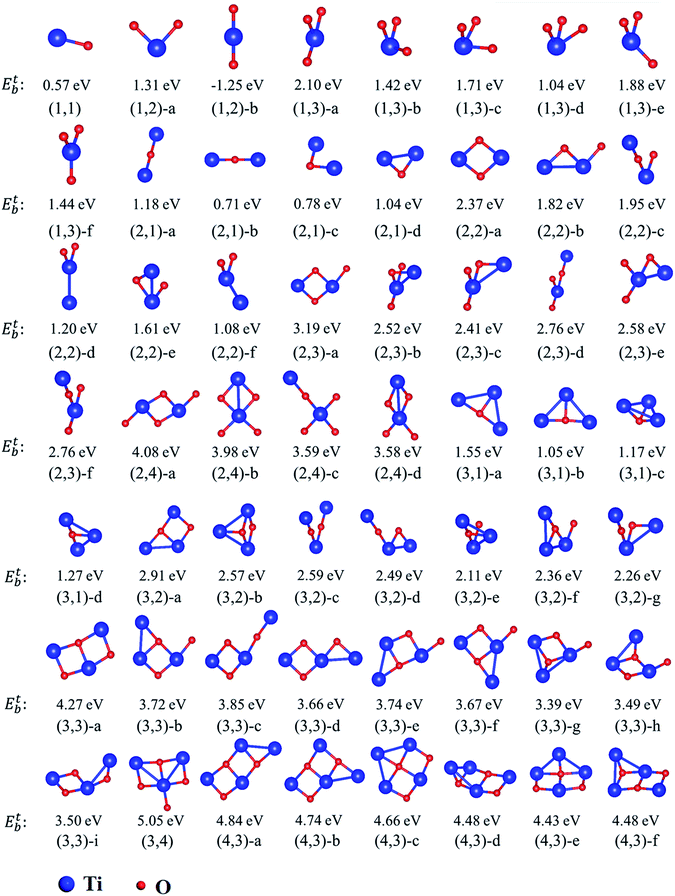
The equilibrium geometries of investigated TimOn clusters as well as some of their isomers are shown in Fig. 4. Their energetic and bonding properties are summarized in Table 3. Here, we may reveal several characteristics which can serve as guiding factors to investigate larger clusters by analyzing only a selection of the possible initial clusters. The stability of isomers can be characterized by the total energy.
| Cluster | E (eV) | N(Ti–O) | N(Ti–Ti) | N(Ti–O)-1nn | Cluster | E (eV) | N(Ti–O) | N(Ti–Ti) | N(Ti–O)-1nn |
|---|---|---|---|---|---|---|---|---|---|
| (1,1) | 0 | 1 | 0 | 0 | (2,4)-d | 0.498 | 6 | 1 | 0 |
| (1,2)-a | 0 | 2 | 0 | 0 | (3,1)-a | 0 | 3 | 2 | 0 |
| (1,2)-b | 2.563 | 2 | 0 | 2 | (3,1)-b | 0.497 | 3 | 2 | 2 |
| (1,3)-a | 0 | 3 | 0 | 0 | (3,1)-c | 0.383 | 3 | 3 | 1 |
| (1,3)-b | 0.685 | 3 | 0 | 0 | (3,1)-d | 0.285 | 3 | 2 | 1 |
| (1,3)-c | 0.394 | 3 | 0 | 1 | (3,2)-a | 0 | 5 | 1 | 0 |
| (1,3)-d | 1.060 | 3 | 0 | 0 | (3,2)-b | 0.341 | 5 | 2 | 1 |
| (1,3)-e | 0.217 | 3 | 0 | 0 | (3,2)-c | 0.323 | 4 | 0 | 0 |
| (1,3)-f | 0.656 | 3 | 0 | 1 | (3,2)-d | 0.425 | 4 | 1 | 0 |
| (2,1)-a | 0 | 2 | 0 | 0 | (3,2)-e | 0.798 | 4 | 2 | 1 |
| (2,1)-b | 0.466 | 2 | 0 | 2 | (3,2)-f | 0.548 | 4 | 2 | 0 |
| (2,1)-c | 0.401 | 2 | 0 | 1 | (3,2)-g | 0.649 | 4 | 1 | 1 |
| (2,1)-d | 0.139 | 2 | 1 | 0 | (3,3)-a | 0 | 7 | 0 | 0 |
| (2,2)-a | 0 | 4 | 0 | 0 | (3,3)-b | 0.548 | 6 | 1 | 0 |
| (2,2)-b | 0.547 | 3 | 1 | 0 | (3,3)-c | 0.417 | 6 | 0 | 0 |
| (2,2)-c | 0.421 | 3 | 0 | 0 | (3,3)-d | 0.612 | 6 | 1 | 0 |
| (2,2)-d | 1.173 | 2 | 1 | 0 | (3,3)-e | 0.526 | 6 | 1 | 0 |
| (2,2)-e | 0.759 | 3 | 1 | 1 | (3,3)-f | 0.597 | 6 | 1 | 0 |
| (2,2)-f | 1.290 | 2 | 1 | 0 | (3,3)-g | 0.881 | 6 | 2 | 1 |
| (2,3)-a | 0 | 5 | 0 | 0 | (3,3)-h | 0.784 | 6 | 1 | 1 |
| (2,3)-b | 0.675 | 4 | 1 | 1 | (3,3)-i | 0.768 | 6 | 1 | 1 |
| (2,3)-c | 0.780 | 4 | 1 | 1 | (3,4) | 0 | 8 | 2 | 0 |
| (2,3)-d | 0.435 | 4 | 0 | 0 | (4,3)-a | 0 | 8 | 1 | 0 |
| (2,3)-e | 0.612 | 4 | 1 | 0 | (4,3)-b | 0.097 | 8 | 1 | 0 |
| (2,3)-f | 0.429 | 4 | 0 | 0 | (4,3)-c | 0.177 | 8 | 2 | 0 |
| (2,4)-a | 0 | 6 | 0 | 0 | (4,3)-d | 0.361 | 8 | 2 | 1 |
| (2,4)-b | 0.098 | 6 | 1 | 0 | (4,3)-e | 0.414 | 8 | 2 | 1 |
| (2,4)-c | 0.491 | 5 | 0 | 0 | (4,3)-f | 0.359 | 8 | 2 | 1 |
It has been found that the formation of Ti–O bonds helps to promote the stability of clusters on account of strong attractive interactions between Ti and O. As can be seen in Table 3, the most stable structures (m,n)-a are those with the largest amount of Ti–O bonds among their isomers. However, it should be noted that the first-nearest-neighbor Ti–O bond induces the total energy to increase slightly, i.e. the total energy of the structures (3,1)-a, (3,1)-b and (3,1)-d increase sequentially as the number of first-nearest-neighbor Ti–O bonds increase. Similarly, the structure (3,2)-d is more stable than (3,2)-g due to lack of one first-nearest-neighbor Ti–O bond. The repulsive interaction between Ti–Ti influences the total energy, resulting in less stability of the structures. For example, the structure (2,4)-a, which is similar to the most stable structure predicted in previous calculations,6,30 is more stable than structure (2,4)-b due to the smaller distance between Ti atoms. The least stable structure (3,3)-g in (3,3) isomers contains two Ti–Ti bonds. For (4,3) type clusters, they all have eight Ti–O bonds. Consequently, the structure with the least Ti–Ti and first-nearest-neighbor Ti–O bonds has the lowest energy. Besides, the most stable structures such as (2,2)-a and (3,3)-a, are all ring-shaped, and are more energetically favorable to form than quasi-linear structures.
Based on the stable structures for various clusters analyzed above, next we turn to discuss the possible growth pathway of TimOn clusters in the initial stage of nucleation.
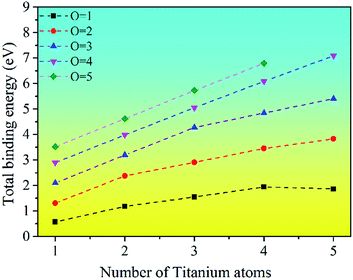
The binding energy for the stable clusters of different sizes was calculated. The results are plotted in Fig. 5. It can be seen that the binding energies of the clusters are positive, which means that the TimOn clusters are all energetically favorable to form. This indicates that small clusters may grow up by absorbing Ti or O atoms into a larger cluster, which is consistent with the previous thermodynamic calculation.31
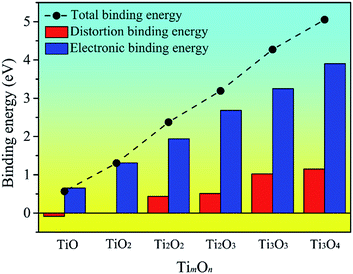
To explore the origin of the binding energy, we decomposed the binding energy into the distortion and electronic binding energy. The decomposed energy together with the binding energy for the TimOn clusters are plotted in Fig. 6. It can be seen that Edb(TimOn) increases with the size of the TimOn cluster and becomes positive when m = n = 2 (the rhombus-shaped structure forms). The result indicates that the strain in matrix caused by the cluster can be relaxed and the cluster is liable to grow up when the Ti2O2 rhombus-shaped structure forms. The electronic binding energy, Eeb(TimOn), is also positive and increases with the size of the clusters. Eeb(TimOn) is larger than the distortion binding energy, Edb(TimOn), and mainly contributes to the binding energy.
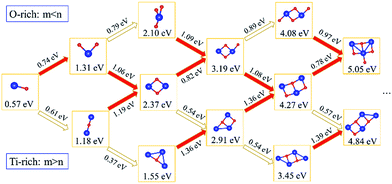
Subsequently, we explored the structural evolution of small TimOn clusters (see Fig. 7). Only the relatively stable structures of each size of clusters are discussed here. The incremental binding energy, EXI(TimOn), represents the binding energy between an X (Ti or O) atom and a TimOn cluster. TiO cluster prefers to form TiO2 for the reason that EOI(TiO) is larger than ETiI(TiO), but it is also undeniable that the structure Ti2O may exist. Both TiO2 and Ti2O preferentially form the rhombus-shaped structure, Ti2O2, by trapping one Ti atom and one O atom, respectively. The structures formed by O-rich cluster TiO3 and Ti-rich cluster Ti3O after trapping a Ti and O atom, respectively, also contain a rhombus-shaped structure Ti2O2. However, EOI(Ti2O2) is larger than ETiI(Ti2O2), indicating that the cluster Ti2O2 preferentially traps one O atom, forming a terminal Ti–O bond. The structure of Ti2O3 is similar to the structure of Ti3O2, both containing a quadrangular configuration, while these two clusters preferentially form the same cluster Ti3O3 containing two quadrangular units which in conjunction with each other by sharing one Ti–O bond. Besides, the cluster Ti2O4 and the cluster Ti4O2 prefer to bond one Ti atom and O atom, respectively, tending to make the stoichiometric ratio of the cluster approach to a value of 1![[thin space (1/6-em)]](https://www.rsc.org/images/entities/char_2009.gif) :
:![[thin space (1/6-em)]](https://www.rsc.org/images/entities/char_2009.gif) 1. This is in excellent agreement with our experimental finding that the Ti to O ratio approaches to 1
1. This is in excellent agreement with our experimental finding that the Ti to O ratio approaches to 1![[thin space (1/6-em)]](https://www.rsc.org/images/entities/char_2009.gif) :
:![[thin space (1/6-em)]](https://www.rsc.org/images/entities/char_2009.gif) 1 for clusters detected by Atom Probe Tomography (APT). It is noted that the matrix Fe atoms surrounding the constructed TimOn clusters present short-range ordered stacking, having effects on the structures of clusters. Take the process from Ti2O2 to Ti3O3 for example (see Fig. 8). Before formation of clusters, Ti and O atoms are considered distributing stochastically in forms of free atoms or Ti–O pairs in the Fe melt. One O atom firstly migrates toward an as-formed Ti2O2 and then Ti2O2 develops into Ti2O3. But the O atom is restricted by Fe matrix lattices, which are supposed to offer limited O-sites for O to select when it bonds with Ti atom. The free Ti atom afterwards occupies the lattice point to bond with two O atoms and then rhombus-shaped structure forms. So, the calculated structures of TimOn clusters are slightly different from other calculations in bonding characteristics.32–34
1 for clusters detected by Atom Probe Tomography (APT). It is noted that the matrix Fe atoms surrounding the constructed TimOn clusters present short-range ordered stacking, having effects on the structures of clusters. Take the process from Ti2O2 to Ti3O3 for example (see Fig. 8). Before formation of clusters, Ti and O atoms are considered distributing stochastically in forms of free atoms or Ti–O pairs in the Fe melt. One O atom firstly migrates toward an as-formed Ti2O2 and then Ti2O2 develops into Ti2O3. But the O atom is restricted by Fe matrix lattices, which are supposed to offer limited O-sites for O to select when it bonds with Ti atom. The free Ti atom afterwards occupies the lattice point to bond with two O atoms and then rhombus-shaped structure forms. So, the calculated structures of TimOn clusters are slightly different from other calculations in bonding characteristics.32–34
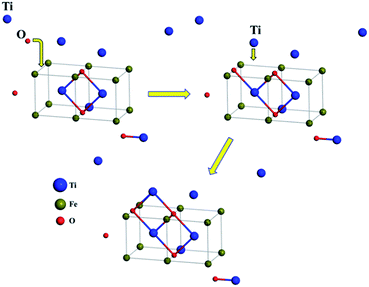 | ||
| Fig. 8 Schematic representation of structural evolution for Ti2O2 to Ti3O3 (blue, green and red spheres denote Ti, Fe and O atoms respectively). | ||
Based on the study of these small clusters, we can conclude that Ti-rich clusters, i.e. Ti2O, Ti3O, Ti3O2 and Ti4O2, are especially apt to trap O atom, while O-rich clusters, i.e. TiO2, TiO3, Ti2O3 and Ti2O4, are apt to trap Ti atom. This indicates that the clusters whose ratio of Ti to O atoms is close to 1![[thin space (1/6-em)]](https://www.rsc.org/images/entities/char_2009.gif) :
:![[thin space (1/6-em)]](https://www.rsc.org/images/entities/char_2009.gif) 1 are easily to be formed, and then these clusters evolve towards structures containing more O atoms. This tendency is consistent with the experimental results that some common titanium oxides inclusions, i.e. TiO2, Ti2O3, and Ti3O5 etc., contain more O atoms than Ti atoms.34,35 Additionally, the structure (2,2)-a was regarded as a special cluster, which may be considered as primitive or potential nuclei of stable and larger titanium oxides. For instance, we found this rhombus-shaped structure in several common natural phases, i.e. Ti2O3 and TiO2 (including three bulk structures, anatase, brookite and rutile). For the structure of Ti2O3, one Ti atom is surrounded by six O atoms, forming three rhombus-shaped structures sharing one Ti atom, (see Fig. 9a). In rutile TiO2, one Ti atom bridged two adjacent rhombus-shaped structures lying on one plane (see Fig. 9b). For brookite and anatase, the small units selected by dashed boxes were similar to the clusters of (3,3)-a and (3,4) (compare Fig. 9c, d and 4). The rhombus-shaped structure can be considered to be the basic unit of the stable TimOn structure in Fe matrix. The fact that these clusters studied theoretically may also be useful for us to understand the structural evolution further.
1 are easily to be formed, and then these clusters evolve towards structures containing more O atoms. This tendency is consistent with the experimental results that some common titanium oxides inclusions, i.e. TiO2, Ti2O3, and Ti3O5 etc., contain more O atoms than Ti atoms.34,35 Additionally, the structure (2,2)-a was regarded as a special cluster, which may be considered as primitive or potential nuclei of stable and larger titanium oxides. For instance, we found this rhombus-shaped structure in several common natural phases, i.e. Ti2O3 and TiO2 (including three bulk structures, anatase, brookite and rutile). For the structure of Ti2O3, one Ti atom is surrounded by six O atoms, forming three rhombus-shaped structures sharing one Ti atom, (see Fig. 9a). In rutile TiO2, one Ti atom bridged two adjacent rhombus-shaped structures lying on one plane (see Fig. 9b). For brookite and anatase, the small units selected by dashed boxes were similar to the clusters of (3,3)-a and (3,4) (compare Fig. 9c, d and 4). The rhombus-shaped structure can be considered to be the basic unit of the stable TimOn structure in Fe matrix. The fact that these clusters studied theoretically may also be useful for us to understand the structural evolution further.
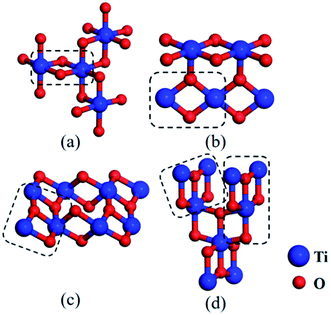 | ||
| Fig. 9 Schematic view of several common bulk structures of titanium oxides for (a) Ti2O3, (b) TiO2 (rutile), (c) TiO2 (brookite) and (d) TiO2 (anatase). Noted that the rhombus-shaped structures in the dashed boxes are similar to a selection of clusters shown in Fig. 8. They comprise these bulk structures by complicated evolving (blue and red spheres denote Ti and O atom, respectively). | ||
Conclusions
The Ti and O are known to mainly exist as solute atoms in the medium-range-order bcc Fe matrix and can be easily to aggregate and form clusters due to the strongly attractive interaction between them. The growing pathway and the origin of TimOn clusters are explored from the changes of binding energy. The detailed conclusions are as follows:(i) The interaction between a substitutional Ti and an interstitial O is strongly attractive at the second neighbor distance and presents ionic binding characteristics. A sizeable amount of charges are shared by Ti–O pairs and Fe matrix when Ti and O at second neighbor distance.
(ii) The Ti–O, Ti–Ti bonds are the main factors affecting the stability of clusters, which are more stable with increasing number of 2nn Ti–O bonds or decreasing number of Ti–Ti bonds.
(iii) The O-rich clusters are energetically favorable to trap Ti atom and the Ti-rich clusters tend to trap O, to keep the stoichiometric ratio being close to 1![[thin space (1/6-em)]](https://www.rsc.org/images/entities/char_2009.gif) :
:![[thin space (1/6-em)]](https://www.rsc.org/images/entities/char_2009.gif) 1, and then the cluster tends to absorb O atom.
1, and then the cluster tends to absorb O atom.
(iv) The rhombus-shaped structure (2,2)-a is suggested to be the smallest unit of the stable TimOn structure in Fe matrix.
Conflicts of interest
We declare that we do not have any commercial or associative interest that represents a conflict of interest in connection with this work.Acknowledgements
This work is supported by National Natural Science Foundation of China (No. U1460103), High Performance Computing Center, Shanghai University. The authors would like to express gratitude to Dr Y. P. Xie from Shanghai University for the valuable assistance during the present study.Notes and references
- J. S. Byun, J. H. Shim, Y. W. Cho and D. N. Lee, Acta Mater., 2003, 51, 1593–1606 CrossRef CAS.
- Y. Li, X. L. Wan, L. Cheng and K. M. Wu, Mater. Sci. Technol., 2016, 32, 88–93 CrossRef CAS.
- W. Z. Mu, P. G. Jönsson and K. Nakajima, J. Mater. Sci., 2016, 51, 2168–2180 CrossRef CAS.
- Y. Guo, J. F. Li, X. Niu, A. Markovits and R. Zhang, Phys. Chem. Chem. Phys., 2016, 18, 10594–10599 RSC.
- Z. W. Qu and G. J. Kroes, J. Phys. Chem. B, 2006, 110, 8998–9007 CrossRef CAS PubMed.
- S. Li and D. A. Dixon, J. Phys. Chem. A, 2008, 112, 6646–6666 CrossRef CAS PubMed.
- W. W. Zhang, Y. Han, S. Yao and H. Sun, Mater. Chem. Phys., 2011, 130, 196–202 CrossRef CAS.
- Y. Jiang, J. R. Smith and G. R. Odette, Phys. Rev. B, 2009, 79, 064103 CrossRef.
- G. Kresse and J. Hafner, Phys. Rev. B, 1994, 49, 14251 CrossRef CAS.
- P. Hohenberg and W. Kohn, Phys. Rev., 1964, 136, 864 CrossRef.
- G. Kresse and D. Joubert, Phys. Rev. B, 1999, 59, 1758 CrossRef CAS.
- J. P. Perdew, K. Burke and M. Ernzerhof, Phys. Rev. Lett., 1996, 77, 3865 CrossRef CAS PubMed.
- Y. Wang, S. Curtarolo, C. Jiang, R. Arroyave, T. Wang, G. Ceder, L. Q. Chen and Z. K. Liu, Calphad, 2004, 28, 79–90 CrossRef CAS.
- P. K. Nandi, et al., J. Phys.: Condens. Matter, 2010, 22, 345501 CrossRef PubMed.
- Y. P. Xie and S. J. Zhao, Comput. Mater. Sci., 2012, 63, 329–335 CrossRef CAS.
- W. A. Counts, C. Wolverton and R. Gibala, Acta Mater., 2010, 58, 4730–4741 CrossRef CAS.
- C. M. Fang, M. Van Huis, M. Sluiter and H. Zandbergen, Acta Mater., 2010, 58, 2968–2977 CrossRef CAS.
- C. K. Ande and M. H. Sluiter, Acta Mater., 2010, 58, 6276–6281 CrossRef CAS.
- M. Souissi and H. Numakura, Comput. Mater. Sci., 2016, 124, 249–258 CrossRef CAS.
- C. Domain, C. S. Becquart and J. Foct, Phys. Rev. B, 2004, 69, 144112 CrossRef.
- C. L. Fu, M. Krčmar, G. S. Painter and X. Q. Chen, Phys. Rev. Lett., 2007, 99, 225502 CrossRef CAS PubMed.
- C. Barouh, T. Schuler, C. C. Fu and M. Nastar, Phys. Rev. B, 2014, 90, 054112 CrossRef.
- S. L. Shang, H. Z. Fang, J. Wang, C. P. Guo, Y. Wang, P. D. Jablonski, Y. Du and Z. K. Liu, Corros. Sci., 2014, 83, 94–102 CrossRef CAS.
- M. K. Miller, et al., J. Mater. Sci. Eng. A, 2003, 353, 140–145 CrossRef.
- M. K. Miller, D. T. Hoelzer, E. A. Kenik and K. F. Russell, Intermetallics, 2005, 13, 387–392 CrossRef CAS.
- J. Muscat, V. Swamy and N. M. Harrison, Phys. Rev. B, 2002, 65, 224112 CrossRef.
- H. Amara, C. C. Fu, F. Soisson and P. Maugis, Phys. Rev. B, 2010, 81, 174101 CrossRef.
- A. Chroneos, R. W. Grimes, B. P. Uberuaga, S. Brotzmann and H. Bracht, Appl. Phys. Lett., 2007, 91, 192106 CrossRef.
- Y. Zhang, et al., Phys. Chem. Chem. Phys., 2015, 17, 12292–12298 RSC.
- T. Albaret, F. Finocchi and C. Noguera, J. Chem. Phys., 2000, 113, 2238–2249 CrossRef CAS.
- C. X. Chen, H. Xue, H. Peng, L. Yan, L. Zhi and S. Wang, J. Nanomater., 2014, 2014, 1 CAS.
- K. Jeong, C. Chang, E. Sedlmayr and D. Sülzle, J. Phys. B: At., Mol. Opt. Phys., 2000, 33, 3417 CrossRef CAS.
- S. Hamad, et al., J. Phys. Chem. B, 2005, 109, 15741–15748 CrossRef CAS PubMed.
- J. J. Pak, et al., ISIJ Int., 2007, 47, 16–24 CrossRef CAS.
- J. Y. Chen, et al., Advances in the Science and Engineering of Casting Solidification, 2015, vol. 2015, p. 147 Search PubMed.
| This journal is © The Royal Society of Chemistry 2017 |

