 Open Access Article
Creative Commons Attribution 3.0 Unported Licence
Synthesis of high rate capability N-doped carbon coated on lithium zinc titanate via a surfactant-assisted solid-state route†
Zhaohui Meng‡
*a,
Song Wang‡a,
Xinfeng Chena,
Lijuan Wang *a and
Fei Wang
 b
b
aCollege of Chemistry and Pharmaceutical Engineering, Nanyang Normal University, Nanyang 473061, China. E-mail: lijuanw123@163.com; nysymengzhaohui@126.com; Fax: +86-377-63168316; Tel: +86-377-63513540
bSchool of Chemistry and Materials Science, Huaibei Normal University, Huaibei, Anhui 235000, China
First published on 27th November 2017
Abstract
N-doped carbon coated on a Li2ZnTi3O8 (LZTO@C–N) anode has been successfully synthesized via a simple surfactant-assisted solid-state method using Tween 80 as surfactant, gelatin as nitrogen source, gelatin and Tween 80 as composite carbon source, and ammonium oxalate as pore-foaming agent. It is shown that nano-sized LZTO particles (∼30 nm) are coated with a carbon layer. The N-doped carbon greatly benefits the electrochemical performance of LZTO@C–N. The largest capacities of 205.4, 193.1, 174.8 and 164.9 mA h g−1 are delivered at 2, 3, 5 and 6 A g−1, respectively. 193.2, 183.2, 159.6 and 139.9 mA h g−1 are still kept at the 100th cycle, respectively. The good electrochemical performance of the LZTO@C–N electrode at high current densities is due to its large specific surface area and pore size, small particle size, low charge-transfer resistance, high Li+ diffusion coefficient and the existence of N-doped carbon.
Introduction
In recent years, Ti-based materials have been extensively studied as promising anode materials for lithium-ion batteries (LIBs).1–4 Lithium zinc titanate (Li2ZnTi3O8, LZTO) with the cubic spinel structure, a well-known member of the Ti-based family, has been regarded as a promising anode of LIBs due to its various advantages of low cost, environmental friendliness, good safety and relatively large theoretical capacity of 227 mA h g−1.4–31 However, its electronic conductivity is low and rate capability is not perfect.Conductive carbon coating can both effectively enhance the electronic conductivity of LZTO and suppress the particle growth during the heat treatment. In addition, porous structure can shorten the diffusion distances of Li+ ions and then benefit the rate capability of LZTO. Recently, N-doped carbon-based materials (C–N) have attracted great interest,32–35 since N-doping can modify the structure, chemical reactivity as well as electronic conductivity of carbon-based materials, and generate a large number of extrinsic defects as well as active sites.36 Therefore, if an N-doped carbon coating layer is used to modify LZTO, good electrochemical performance is expected. Gelatin is an amphoteric macromolecule, possessing amino groups (–NH2) and carboxyl groups (–COOH). Owing to its low cost, environmental friendliness and high content of carbon/nitrogen, gelatin is considered as an unexceptionable candidate precursor producing C–N materials.
So far, solid-state and liquid-state reactions are the main methods of preparing carbon-coated Li2ZnTi3O8 (LZTO@C).4,10,13,16,29 The former is simple and easy in industrialization. However, it is difficult to homogeneously disperse the raw materials and then obtain pure phase. The electrochemical performance of the final product will be adversely affected. For the latter route, although good electrochemical performance can be easily achieved, the processes are complicated. Therefore, a simple and efficient route to synthesize LZTO@C is highly necessary.
As a nonionic surfactant, polyoxyethylene-(20)-sorbitan monooleate (Tween 80, C64H124O26) with low cost and toxicity, possesses all the positive features of nonionic surfactants.37 The surfactant enables the closed combination and good dispersion of different components due to its amphiphilic nature. However, Tween 80 has not yet been used as surfactant and carbon source in the preparation of LZTO@C.
In the work, the N-doped carbon coated on LZTO (LZTO@C–N) anode is firstly synthesized via a simple surfactant-assisted solid-state method using Tween 80 as surfactant, gelatin and Tween 80 as composite carbon source. The physicochemical properties of the LZTO@C–N anode are also researched in detail.
Experimental
Synthesis of Li2ZnTi3O8@C–N
The LZTO@C–N anode was synthesized via a surfactant-assisted solid-state route. Firstly, Li2CO3 (A.R.), ZnO (A.R.) and TiO2 (anatase, A.R.) were mixed for 5 h by ball-milling using ethanol as the dispersing medium. The molar ratio of Li![[thin space (1/6-em)]](https://www.rsc.org/images/entities/char_2009.gif) :
:![[thin space (1/6-em)]](https://www.rsc.org/images/entities/char_2009.gif) Zn
Zn![[thin space (1/6-em)]](https://www.rsc.org/images/entities/char_2009.gif) :
:![[thin space (1/6-em)]](https://www.rsc.org/images/entities/char_2009.gif) Ti is 2.2
Ti is 2.2![[thin space (1/6-em)]](https://www.rsc.org/images/entities/char_2009.gif) :
:![[thin space (1/6-em)]](https://www.rsc.org/images/entities/char_2009.gif) 1
1![[thin space (1/6-em)]](https://www.rsc.org/images/entities/char_2009.gif) :
:![[thin space (1/6-em)]](https://www.rsc.org/images/entities/char_2009.gif) 3. The excess Li salt is used to compensate for the volatilization of Li. The mixture was dried at 100 °C for 12 h, and then pre-heated at 600 °C for 1 h in air. Secondly, the 1 g obtained intermediate product, 6 mL gelatin solution (0.05625 g mL−1), ammonium oxalate (0.1000 g) and Tween 80 (0.1437 g) were ball-milled for 5 h. The mixture was dried at 90 °C for 12 h, and then sintered at 700 °C for 3 h in N2. The obtained product was denoted as LZTO@C–N-3. As comparison, LZTO@C–N-2 was also fabricated by the same method without Tween 80. LZTO@C–N-1 was obtained without ammonium oxalate and Tween 80.
3. The excess Li salt is used to compensate for the volatilization of Li. The mixture was dried at 100 °C for 12 h, and then pre-heated at 600 °C for 1 h in air. Secondly, the 1 g obtained intermediate product, 6 mL gelatin solution (0.05625 g mL−1), ammonium oxalate (0.1000 g) and Tween 80 (0.1437 g) were ball-milled for 5 h. The mixture was dried at 90 °C for 12 h, and then sintered at 700 °C for 3 h in N2. The obtained product was denoted as LZTO@C–N-3. As comparison, LZTO@C–N-2 was also fabricated by the same method without Tween 80. LZTO@C–N-1 was obtained without ammonium oxalate and Tween 80.
Physical and electrochemical performance measurements
Bruker D8 Advance X-ray diffractometer with Cu Kα radiation (λ = 1.54 Å) was used to collect X-ray diffraction data in the 2θ range from 5 to 85° with 4° min−1. SU8010 scanning electron microscope (SEM) was applied to investigate the morphologies of the products. The specific surface areas and pore size distributions were measured by a specific surface area and pore size distribution analyzer (3H-2000PS2) via N2 adsorption. High-resolution transmission electron microscope (HR-TEM) (FEI Tecnai F20) was used to observe the nanoscale microstructures of the products. The carbon content was measured by the thermogravimetric analysis in air using a RD496 thermal analyzer. Element analysis was conducted on a vario EL elemental analyzer. The surface species were identified by X-ray photoelectron spectroscopy (XPS) measurements (PHI 5600 CI, mono-chromatic Al-Kα radiation).The electrochemical measurements were performed in CR2025 coin-type cells, which consisted of the working electrode for LZTO@C–N, the counter electrode for lithium metal foil, the separator for Celgard2300, and the electrolyte for 1 M LiPF6 dissolved in ethylene carbonate (EC) and dimethyl carbonate (DMC) (V/V = 1![[thin space (1/6-em)]](https://www.rsc.org/images/entities/char_2009.gif) :
:![[thin space (1/6-em)]](https://www.rsc.org/images/entities/char_2009.gif) 1). The working electrode was composed of 85 wt% LZTO@C–N as active material loading about 4.0 mg cm−2, 10 wt% acetylene black as conductive agent, and 5 wt% polyvinylidene difluoride (PVDF) as binder. The content of carbon from gelatin as well as Tween 80 was different and the content of acetylene black was 10 wt% for each electrode. The charge–discharge measurements were conducted on a Neware battery test system from 0.02 to 3.0 V. The specific capacity data were based on the mass of LZTO. Cyclic voltammograms (CVs) and electrochemical impedance spectroscopies (EIS) were performed by an electrochemical workstation (CHI660E). The CV tests were done in the potential range of 0.02–3.0 V at 0.5 mV s−1. The EIS were measured with an ac voltage of 5 mV from 10 MHz to 100 kHz.
1). The working electrode was composed of 85 wt% LZTO@C–N as active material loading about 4.0 mg cm−2, 10 wt% acetylene black as conductive agent, and 5 wt% polyvinylidene difluoride (PVDF) as binder. The content of carbon from gelatin as well as Tween 80 was different and the content of acetylene black was 10 wt% for each electrode. The charge–discharge measurements were conducted on a Neware battery test system from 0.02 to 3.0 V. The specific capacity data were based on the mass of LZTO. Cyclic voltammograms (CVs) and electrochemical impedance spectroscopies (EIS) were performed by an electrochemical workstation (CHI660E). The CV tests were done in the potential range of 0.02–3.0 V at 0.5 mV s−1. The EIS were measured with an ac voltage of 5 mV from 10 MHz to 100 kHz.
Results and discussion
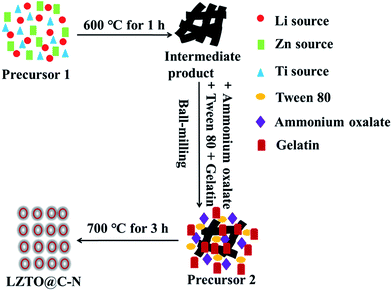
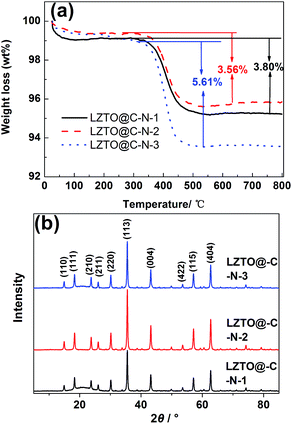
The strategy of synthesizing porous LZTO@C–N is schematically shown in Fig. 1. First of all, the precursor 1 including Li, Zn and Ti sources was heated at 600 °C for 1 h in air. Second, the obtained intermediate product was mixed with ammonium oxalate, Tween 80 and gelatin via a ball-milling process. Finally, the produced precursor 2 was sintered at 700 °C for 3 h in N2 to obtain LZTO@C–N. Ammonium oxalate used as pore-foaming agent could release a large amount of gas during the pyrolysis process. Tween 80 was surfactant to help to uniformly disperse the raw materials. Gelatin and Tween 80 were composite carbon sources.TG measurements were used to quantify the carbon content of the LZTO@C–N composites and the results are shown in Fig. 2a. The evaporation of adsorbed water (1.0–2.0 wt%) occurs from room temperature to 150 °C. The oxidation of carbon in air occurs from 300 to 480 °C. It can be seen that there is no weight loss over 480 °C, indicating that the parent LZTO is stable.38 Based on the TG results, the carbon content is 3.80, 3.56 and 5.61 wt% for LZTO@C–N-1, LZTO@C–N-2 and LZTO@C–N-3, respectively.
The XRD patterns of the LZTO@C–N composites are shown in Fig. 2b. The diffraction peaks can be assigned to the cubic spinel structure of LZTO (JCPDS#44-1037) for every sample, in line with the previous reports.4–31 Although carbon exists in the LZTO@C–N composites from the TG results, no diffraction peaks of carbon are detected from the XRD patterns. As the carbon layer is too thin or the carbon is amorphous.10,13,16,22,26,28,29 The lattice parameters are listed in Table 1 and similar to the previous reports,11,12,15,26 calculated from the XRD data for the three samples.
| Samples | a (Å) | V (Å3) |
|---|---|---|
| LZTO@C–N-1 | 8.370(8) | 586.5(5) |
| LZTO@C–N-2 | 8.370(4) | 586.4(8) |
| LZTO@C–N-3 | 8.373(2) | 587.0(6) |
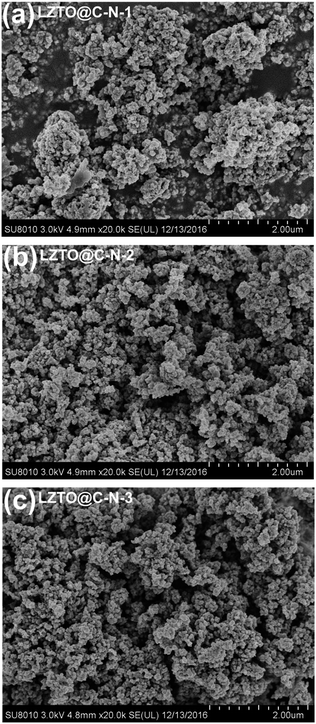
SEM images of the LZTO@C–N composites are shown in Fig. 3. Compared with the LZTO@C–N-1 sample, LZTO@C–N-2 and LZTO@C–N-3 have better dispersion, which will be advantageous to their electrochemical performance. Moreover, the specific surface areas, the total pore volumes and average pore diameters obtained from adsorption–desorption isotherms (Fig. 4) show that the introduction of ammonium oxalate greatly enhances the total pore volumes and average pore diameters of LZTO (Table 2). The pore sizes mainly concentrate on 2–5 nm for LZTO@C–N-1. When the ammonium oxalate exists, the pore sizes mainly concentrate on 2–5 and 38–110 nm for LZTO@C–N-2 and LZTO@C–N-3 materials. It is well known that the large pores are advantageous to electrolyte penetrating into the electrode materials and the quick diffusion of Li+ ions. Among the LZTO@C–N composites, LZTO@C–N-3 has the largest specific surface area, which can increase the contact areas between the active particles and electrolyte, and then be beneficial to its reversible capacity.
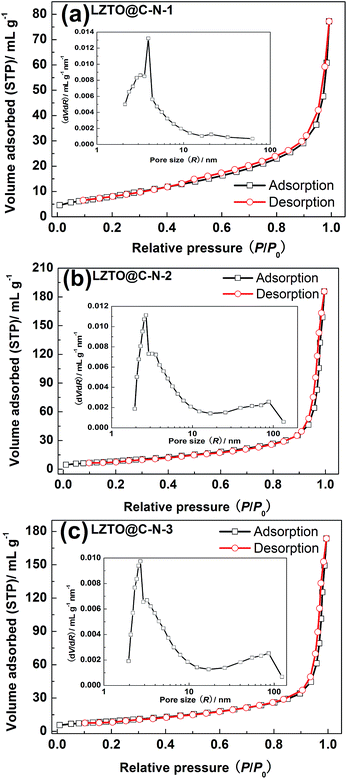 | ||
| Fig. 4 N2 adsorption–desorption isotherms of (a) LZTO@C–N-1, (b) LZTO@C–N-2 and (c) LZTO@C–N-3. The insets are the pore size distributions of the LZTO@C–N composites. | ||
| Samples | Specific surface area (m2 g−1) | Total pore volume (mL g−1) | Average pore diameter (nm) |
|---|---|---|---|
| LZTO@C–N-1 | 28.8 | 0.120 | 11.5 |
| LZTO@C–N-2 | 29.7 | 0.287 | 22.4 |
| LZTO@C–N-3 | 31.8 | 0.269 | 21.9 |
TEM images of the LZTO@C–N composites are depicted in Fig. 5. Among the three samples with nano-size, LZTO@C–N-3 has the smallest particle size (∼30 nm), which can shorten the diffusion distance of Li+ ions. The surfaces of LZTO particles are coated with carbon shown in the high-resolution TEM (HRTEM) images of the LZTO@C–N composites. Element analysis results (Table 3) show that N exists in the carbon for every sample.
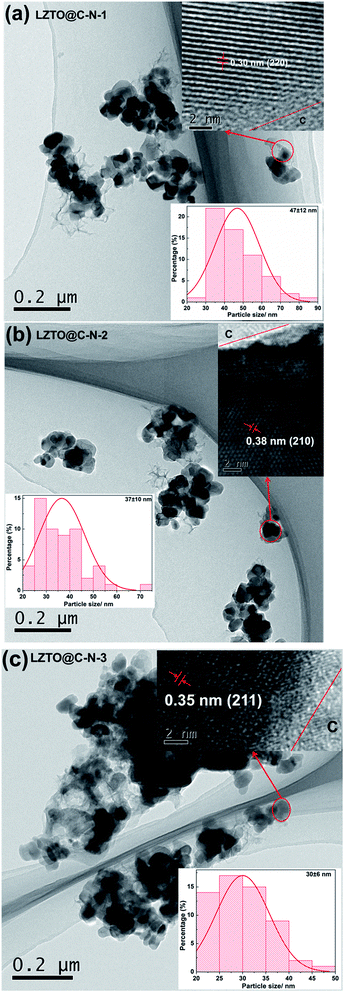 | ||
| Fig. 5 TEM images, HRTEM images (inset, upper-right corner), and histograms of particle size distribution (inset, bottom) of (a) LZTO@C–N-1, (b) LZTO@C–N-2 and (c) LZTO@C–N-3, respectively. | ||
| Samples | Content of N (%) |
|---|---|
| LZTO@C–N-1 | 0.73 |
| LZTO@C–N-2 | 0.69 |
| LZTO@C–N-3 | 0.65 |
The surface chemical compositions of LZTO@C–N composites were examined by the XPS technique. The XPS spectra (Fig. S1a–c†) indicate the existence of Zn, Ti, O, C and N elements in LZTO@C–N. Fig. S1d–f† presents the high-resolution XPS spectra of C 1s for LZTO@C–N composites, fitted into three types of C contributions, i.e., sp2 C (C–C) about 284.7 eV, sp2 C (C–N) about 285.8 eV and sp3 C (C–N) at 289.1 eV. Fig. S1g–i† shows the high-resolution XPS spectra of N 1s for LZTO@C–N composites, containing pyridinic N and pyrrolic N. The XPS results further verify successful doping of N element into the carbon. The existence of C![[double bond, length as m-dash]](https://www.rsc.org/images/entities/char_e001.gif) C and C
C and C![[double bond, length as m-dash]](https://www.rsc.org/images/entities/char_e001.gif) N could make some attribution to the form of a conducting network.
N could make some attribution to the form of a conducting network.
Fig. 6a exhibits the initial charge–discharge curves of the LZTO@C–N composites at 1 A g−1 in the voltage range of 0.02–3.0 V. For each sample, there is a pair of charge plateau (1.44 V) and a corresponding discharge plateau (0.52 V) on the curves, which agrees with the previous reports.4–31 The initial discharge specific capacities are 254.2, 271.2 and 274.0 mA h g−1 with the coulombic efficiency of 79.7%, 80.3% and 82.1% for LZTO@C–N-1, LZTO@C–N-2 and LZTO@C–N-3, respectively. Among the three samples, LZTO@C–N-3 has the largest specific capacity, which may originate from its large specific surface area, agreement with the BET results. In addition, carbon can provide capacity for the LZTO@C–N composites. Based on the TG results (Fig. 2a), the high carbon content is advantageous to its large specific capacity for LZTO@C–N-3. Moreover, the initial coulombic efficiency is not high for each sample, owing to the formation of solid electrolyte interface (SEI) layer, which can weaken the side reaction and then will benefit the cyclic performance of LZTO@C–N.11–13,15–17,26
Cyclic performance of the LZTO@C–N composites at 1 A g−1 from 0.02 to 3.0 V is shown in Fig. 6b. 200.6, 207.9 and 208.2 mA h g−1 are delivered at the 2nd cycle for LZTO@C–N-1, LZTO@C–N-2 and LZTO@C–N-3, respectively. When cycled for 200 cycles, 71.3%, 77.7% and 83.0% of the capacities for the 2nd cycle are kept, respectively. LZTO@C–N-3 exhibits the best cyclic performance due to its good dispersion and proper specific surface area. Nevertheless, the bad cyclic performance may originate from the severe agglomeration of LZTO@C–N-1.
The CV curves were recorded at 0.5 mV s−1 in the potential range of 0.02–3.0 V and are shown in Fig. 6c–f to further research the electrochemical performance of the LZTO@C–N composites. There is a pair of cathodic and anodic peaks from 1.0 to 2.0 V for each sample, corresponding to the Ti4+/Ti3+ redox couple. The cathodic peak below 0.5 V may be assigned to multiple restoration of Ti4+ as previous reports.39,40 Additionally, for each electrode, the reduction process differs between the initial and subsequent cycles, which originates from the activation and/or polarization of the electrode.7,26 The values of the CV peaks for the three electrodes at the 1st cycle are listed in Table 4. The potentials of the anodic peak and the cathodic peak, and the difference between anodic and cathodic peak potentials are denoted as φpa, φpc and φp, respectively. Compared with LZTO@C–N-1, the other two samples have smaller φp (0.44 V). That is to say, the polarization is small for the samples and the intercalation and de-intercalation of Li+ ions are highly reversible, agreement with the charge and discharge results.
| Samples | φpa (V) | φpc (V) | φp (V) = φpa − φpc |
|---|---|---|---|
| LZTO@C–N-1 | 1.56 | 1.06 | 0.50 |
| LZTO@C–N-2 | 1.54 | 1.10 | 0.44 |
| LZTO@C–N-3 | 1.54 | 1.10 | 0.44 |
For the LZTO@C–N composites, the electrochemical impedance data were collected on as assembled cells cycling for 200 cycles at 1 A g−1 and are presented in Fig. 7. The anodes were charged to 3.0 V in the tests. The curve is composed of a small intercept, two semicircles and a straight line for every electrode. Fig. 7 (inset) is the equivalent circuit model. Rb is the combined impedance of the electrolyte and cell components; Csei and Rsei represent the capacitance and the resistance of the SEI layer for the first semicircle; Cdl and Rct, are the double layer capacitance and charge transfer resistance corresponding to the second semicircle, respectively; W represents Warburg impedance, which usually is a 45°-slope straight line. However, the straight line branches here may be due to capacitance components, as previous reports.26,41,42 For the three samples, the small intercept (Rb) is almost same, about 5–7 Ω. Among the three samples, the LZTO@C–N-3 exhibits the smallest charge transfer resistance (Rct) of 4.731 Ω and SEI layer resistance (Rsei) of 4.593 Ω (Table 5), which is advantageous to its electrochemical performance, consistent with the charge and discharge results.
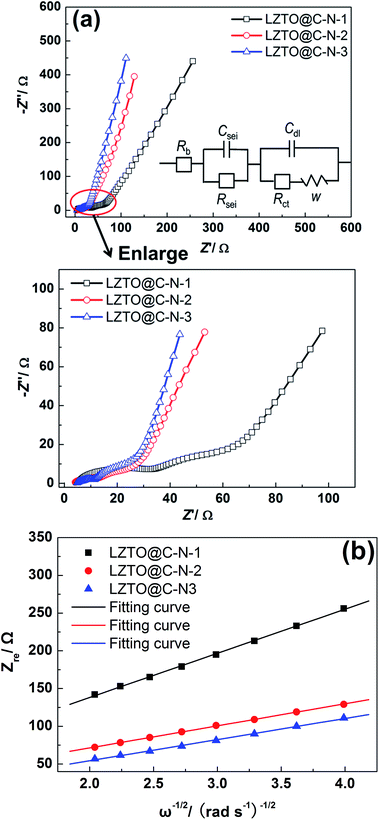 | ||
| Fig. 7 (a) Impedance spectra of LZTO@C–N-1, LZTO@C–N-2 and LZTO@C–N-3 electrodes, and corresponding equivalent circuit (inset); (b) relationship between Zre and ω−1/2. | ||
| Samples | Rb (Ω) | Rsei (Ω) | Rct (Ω) |
|---|---|---|---|
| LZTO@C–N-1 | 6.561 | 10.58 | 16.7 |
| LZTO@C–N-2 | 5.773 | 7.147 | 7.224 |
| LZTO@C–N-3 | 5.912 | 4.593 | 4.731 |
To further investigate the electrode kinetics, the diffusion coefficients of lithium ions in LZTO@C–N-1, LZTO@C–N-2 and LZTO@C–N-3 are estimated based on the Warburg diffusion in low frequency using the following equation43
| DLi+ = R2T2/(2A2n4F4C2σ2) | (1) |
![[thin space (1/6-em)]](https://www.rsc.org/images/entities/char_2009.gif) 485 C mol−1); C (8.5 × 10⁻³ mol cm−3) is the concentration of Li+ ion in the compound, and σ is the Warburg factor which obeys the following relationship:
485 C mol−1); C (8.5 × 10⁻³ mol cm−3) is the concentration of Li+ ion in the compound, and σ is the Warburg factor which obeys the following relationship:| Zre = Re + Rct + σω−1/2 | (2) |
Fig. 7b shows the relationship between Zre and ω−1/2. Based on the eqn (1) and (2), the lithium diffusion coefficients (DLi+) of LZTO@C–N-1, LZTO@C–N-2 and LZTO@C–N-3 can be calculated and the specific values are 1.4 × 10⁻¹⁵, 5.6 × 10⁻¹⁵ and 6.1 × 10⁻¹⁵ cm2 s−1, respectively. Among the three electrodes, LZTO@C–N-3 has the highest lithium ion diffusion coefficient, which is higher than the ones reported by other groups.44 As is well known, a high DLi+ value indicates a fast diffusion of Li+ ion and thus guarantees good electrochemical performance of LZTO@C–N-3.
The LZTO@C–N-3 exhibits the best electrochemical performance based on the researches above. Fig. 8 presents the cyclic performance of the LZTO@C–N-3 electrode at 2–6 A g−1 to further evaluate its rate capability. The capacities sharply decrease at the first cycles due to the increase of polarization for 2–6 A g−1. Then, the largest capacities of 205.4, 193.1, 174.8 and 164.9 mA h g−1 are reached after several cycles at 2, 3, 5 and 6 A g−1, respectively. 193.2, 183.2, 159.6 and 139.9 mA h g−1 are still delivered at the 100th cycle, respectively. The capacities are larger or the cyclic performance is better than the previous reports5–31 for the electrode, owing to its large specific surface area and pore size, small particle size, low charge-transfer resistance, high Li+ diffusion coefficient and the existence of N-doped carbon. Especially, the electrochemical performance of LZTO@C–N-3 is comparative or better than the LZTO@C previously reported with higher carbon content,29,31 which may be related to the existence of N-doped carbon or the good dispersion of LZTO@C.
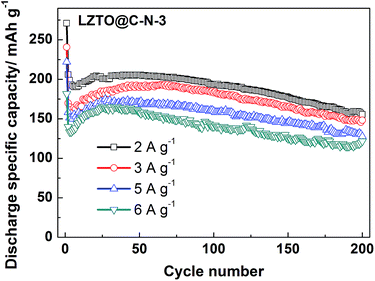 | ||
| Fig. 8 Cyclic performance of the LZTO@C–N-3 electrode at high current densities of 2–6 A g−1 in the range of 0.02–3.0 V. | ||
Conclusions
LZTO@C–N anode has been successfully prepared by a simple surfactant-assisted solid-state method using Tween 80 as surfactant, gelatin and Tween 80 as composite carbon source and ammonium oxalate as pore-foaming agent. The introduction of ammonium oxalate greatly improves the total pore volume and average pore diameter of LZTO@C–N. The large pores benefit electrolyte penetrating into the active material and the quick diffusion of Li+ ions. Tween 80 as surfactant helps to uniformly disperse the raw materials, and then enhances the electrochemical performance of LZTO@C–N. The product exhibits large specific capacities and good cycling performance at high current densities. This work may provide an efficient method of preparing electrode materials with outstanding electrochemical performance via introducing pore-foaming agent and surfactant.Conflicts of interest
There are no conflicts to declare.Acknowledgements
We acknowledge financial support from the Henan Joint Funds of the National Natural Science Foundation of China (U1504532), the National Natural Science Foundation of China (201401111 and 21401061) and the Henan Province Project Education Fund (17A150042).Notes and references
- M. Gockeln, S. Pokhrel, F. Meierhofer, J. Glenneberg, M. Schowalter, A. Rosenauer, U. Fritsching, M. Busse, L. Mädler and R. Kun, J. Power Sources, 2018, 374, 97–106 CrossRef CAS.
- Z. S. Hong, M. D. Wei, Q. X. Deng, X. K. Ding, L. L. Jiang and K. M. Wei, Chem. Commun., 2010, 46, 740–742 RSC.
- J. F. Wang, J. W. Zhang, Y. Zhang, J. H. Guo and J. W. Zhang, J. Alloys Compd., 2016, 688, 392–398 CrossRef CAS.
- C. Chen, C. C. Ai, X. Y. Liu, Y. W. He, S. Yang and Y. X. Wu, J. Alloys Compd., 2017, 698, 692–698 CrossRef CAS.
- C. Chen, C. C. Ai, X. Y. Liu, Y. W. He, S. Yang and Y. X. Wu, Electrochim. Acta, 2017, 227, 285–293 CrossRef CAS.
- W. Chen, Z. Zhou, R. R. Wang, Z. T. Wu, H. F. Liang, L. Y. Shao, J. Shu and Z. C. Wang, RSC Adv., 2015, 5, 49890–49898 RSC.
- Z. S. Hong, X. Z. Zheng, X. K. Ding, L. L. Jiang, M. D. Wei and K. M. Wei, Energy Environ. Sci., 2011, 4, 1886–1891 CAS.
- Z. S. Hong, T. B. Lan, Y. Z. Zheng, L. L. Jiang and M. D. Wei, Funct. Mater. Lett., 2011, 4, 65–69 CrossRef CAS.
- Z. S. Hong, M. D. Wei, X. K. Ding, L. L. Jiang and K. M. Wei, Electrochem. Commun., 2010, 12, 720–723 CrossRef CAS.
- Y. X. Xu, Z. S. Hong, L. C. Xia, J. Yang and M. D. Wei, Electrochim. Acta, 2013, 88, 74–78 CrossRef CAS.
- H. Q. Tang, Z. Y. Tang, C. Q. Du, F. C. Qie and J. T. Zhu, Electrochim. Acta, 2014, 120, 187–192 CrossRef CAS.
- H. Q. Tang, J. T. Zhu, Z. Y. Tang and C. X. Ma, J. Electroanal. Chem., 2014, 731, 60–66 CrossRef CAS.
- H. Q. Tang and Z. Y. Tang, J. Alloys Compd., 2014, 613, 267–274 CrossRef CAS.
- H. Li, Z. F. Li, X. Liang, Y. Ouyang, Y. H. Ma, Y. H. Cui, C. X. Ma and Z. Y. Tang, Mater. Lett., 2017, 192, 128–132 CrossRef CAS.
- H. Q. Tang, J. T. Zhu, C. X. Ma and Z. Y. Tang, Electrochim. Acta, 2014, 144, 76–84 CrossRef CAS.
- H. Q. Tang, L. X. Zan, W. F. Mao and Z. Y. Tang, J. Electroanal. Chem., 2015, 751, 57–64 CrossRef CAS.
- H. Q. Tang, Q. Weng and Z. Y. Tang, Electrochim. Acta, 2015, 151, 27–34 CrossRef CAS.
- T. Liu, H. Q. Tang, L. X. Zan and Z. Y. Tang, J. Electroanal. Chem., 2016, 771, 10–16 CrossRef CAS.
- Y. Y. Li, C. Q. Du, J. Liu, F. Zhang, Q. Xu, D. Y. Du, X. H. Zhang and Z. Y. Tang, Electrochim. Acta, 2015, 167, 201–206 CrossRef CAS.
- Z. F. Li, H. Li, Y. H. Cui, Z. G. Du, Y. H. Ma, C. X. Ma and Z. Y. Tang, J. Alloys Compd., 2017, 692, 131–139 CrossRef CAS.
- H. Q. Tang, L. X. Zan, J. T. Zhu, Y. H. Ma, N. Q. Zhao and Z. Y. Tang, J. Alloys Compd., 2016, 667, 82–90 CrossRef CAS.
- H. Q. Tang, Y. K. Zhou, L. X. Zan, N. Q. Zhao and Z. Y. Tang, Electrochim. Acta, 2016, 191, 887–894 CrossRef CAS.
- L. Wang, L. J. Wu, Z. H. Li, G. T. Lei, Q. Z. Xiao and P. Zhang, Electrochim. Acta, 2011, 56, 5343–5346 CrossRef CAS.
- B. K. Chen, C. J. Du, Y. Z. Zhang, R. X. Sun, L. Zhou and L. J. Wang, Electrochim. Acta, 2015, 159, 102–110 CrossRef CAS.
- L. J. Wang, Z. H. Meng, H. W. Wang, X. X. Li and G. Q. Zhang, Ceram. Int., 2016, 42, 16872–16881 CrossRef CAS.
- L. J. Wang, B. K. Chen, Z. H. Meng, B. M. Luo, X. J. Wang and Y. Y. Zhao, Electrochim. Acta, 2016, 188, 135–144 CrossRef CAS.
- X. X. Li, L. J. Wang, C. F. Li, B. K. Chen, Q. Zhao and G. Q. Zhang, J. Power Sources, 2016, 308, 65–74 CrossRef CAS.
- X. J. Wang, L. J. Wang, B. K. Chen, J. Yao and H. Y. Zeng, J. Electroanal. Chem., 2016, 775, 311–319 CrossRef CAS.
- Z. H. Meng, L. J. Wang, X. X. Li, G. Q. Zhang and H. Y. Li, Int. J. Hydrogen Energy, 2017, 42, 2177–2186 CrossRef CAS.
- T. F. Yi, J. Z. Wu, J. Yuan, Y. R. Zhu and P. F. Wang, ACS Sustainable Chem. Eng., 2015, 3, 3062–3069 CrossRef CAS.
- X. Li, Q. Xiao, B. Liu, H. C. Lin and J. B. Zhao, J. Power Sources, 2015, 273, 128–135 CrossRef CAS.
- X. H. Liu, J. Zhang, S. J. Guo and N. Pinna, J. Mater. Chem. A, 2016, 4, 1423–1431 CAS.
- H. W. Zhu, Y. K. Jing, M. Pal, Y. P. Liu, Y. Liu, J. X. Wang, F. Zhang and D. Y. Zhao, Nanoscale, 2017, 9, 1539–1546 RSC.
- S. W. Liu, M. Y. Tong, G. Q. Liu, X. Zhang, Z. M. Wang, G. Z. Wang, W. P. Cai, H. M. Zhang and H. J. Zhao, Inorg. Chem. Front., 2017, 4, 491–498 RSC.
- J. Kang, D. Y. Kim, J. Suk, S. S. Lee, D. W. Kim, J. Kim and Y. Kang, J. Mater. Chem. A, 2015, 3, 18843–18846 CAS.
- C. Wang, W. Shen and H. M. Liu, New J. Chem., 2014, 38, 430–436 RSC.
- M. Cheng, G. M. Zeng, D. L. Huang, C. P. Yang, C. Lai, C. Zhang and Y. Liu, Chem. Eng. J., 2017, 314, 98–113 CrossRef CAS.
- M. M. Ranhman, J. Z. Wang, M. F. Hassan, D. Wexler and H. K. Liu, Adv. Energy Mater., 2011, 1, 212–220 CrossRef.
- W. J. H. Borghols, M. Wagemaker, U. Lafont, E. M. Kelde and F. M. Mulder, J. Am. Chem. Soc., 2009, 131, 17786–17792 CrossRef CAS PubMed.
- H. Ge, N. Li, D. Li, C. Dai and D. Wang, Electrochem. Commun., 2008, 10, 719–722 CrossRef CAS.
- J. S. Gnanaraj, M. D. Levi, E. Levi, G. Salitra, D. Aurbach, E. Fischer John and A. Clayeb, J. Electrochem. Soc., 2001, 148, A525–A536 CrossRef CAS.
- L. Wang, Y. Yu, P. C. Chen, D. W. Zhang and C. H. Chen, J. Power Sources, 2008, 183, 717–723 CrossRef CAS.
- W. Chen, Z. R. Zhou, R. R. Wang, Z. T. Wu, H. F. Liang, L. Y. Shao, J. Shu and Z. C. Wang, RSC Adv., 2015, 5, 49890–49898 RSC.
- F. C. Qie and Z. Y. Tang, Mater. Express, 2014, 4, 221–227 CrossRef CAS.
Footnotes |
| † Electronic supplementary information (ESI) available. See DOI: 10.1039/c7ra10969e |
| ‡ These authors contributed equally to this work. |
| This journal is © The Royal Society of Chemistry 2017 |

