 Open Access Article
Creative Commons Attribution 3.0 Unported Licence
Integrated analysis of solid-state NMR spectra and nuclear magnetic relaxation times for the phenol formaldehyde (PF) resin impregnation process into soft wood†
Masakazu Nishida *a,
Tomoko Tanakaa,
Tsunehisa Miki
 a,
Yoshio Hayakawa
 a and
Kozo Kanayamab
aNational Institute of Advanced Industrial Science and Technology (AIST), 2266-98 Shimoshidami, Moriyama-ku, Nagoya, 463-8560 Japan. E-mail: m-nishida@aist.go.jp; Fax: +81 52 736 7406; Tel: +81 52 736 7493
bResearch Institute for Sustainable Humanosphere, Kyoto University, Gokanosho, Uji, Kyoto, 611-0011 Japan
First published on 28th November 2017
Abstract
The effects of phenol formaldehyde (PF) resin impregnation into Japanese cedar plates were studied by the integrated analysis of solid-state NMR spectra and relaxation times. 13C cross-polarization/magic angle spinning (CP-MAS) NMR spectra showed that PF resin permeated near carbohydrate polymers as well as lignin regions, providing hydrophobicity in a woody material. Additionally, 13C pulse saturation transfer/magic angle spinning (PST-MAS) NMR spectra revealed that the molecular mobility of cellulose endocyclic groups was suppressed by the PF resin impregnation. Spin-lattice relaxation times in the laboratory frame, T1H and T1C, for both untreated and impregnated woods decreased in humid conditions while they were increased by the PF resin impregnation. Meanwhile, spin-lattice relaxation in the rotation frame, T1ρH, decreased in humid conditions as well as being a result of the PF resin impregnation. According to the tendencies of the T1H, T1C, and T1ρH values associated with the PF resin impregnation, although faster molecular motions of lignin OCH3 group were increased in the MHz frequency range, slower molecular motions of the cellulose ring were suppressed in the kHz frequency range, which confirmed the result from the 13C PST-MAS NMR spectra.
Introduction
Effective utilization of natural biomass resources for promoting a recycle-oriented society demands an evaluation method for quality control from the viewpoint of molecular structure and mobility. Solid-state NMR is a useful analytical method for woody materials, to investigate not only the structure of each biomass constituent but also the interactions between them.1 Solid-state NMR could be applied to a manufacturing process using woody materials; as recent examples, pre-treatment by dilute sulfuric acid,2 modification with reactive extrusion,3 dynamic torrefaction of biomasses,4 and composite formation with a biodegradable polymer.5 Furthermore, the dynamics of the interaction of moisture have been studied by solid-state NMR not only for soft woods6 but also for soil organic matter.7 Although a number of reports have addressed solid-state NMR of woody materials in this manner, few reports have been published that deal with quality control in a modification process of woody materials using the solid-state NMR method.In this study, for the purpose of expanding applications of solid-state NMR to biomass resources oriented towards quality control in industrial fields, the impregnation process of phenol formaldehyde (PF) resin into soft wood is analysed by integrating solid-state NMR spectral data and magnetic relaxation times. Here, we targeted Japanese cedar as the soft wood because of its broad range of use in Japan. PF resin impregnation is the most significant chemical process used for adhesives, binders, reinforcing agents etc., not only for Japanese cedar but also for other woody materials. Solid-state NMR is also used for analysing modification processes using the PF resin; for example, the dynamics and interaction of a wood/PF resin8 and the water resistance of PF resins for plywood production.9 In addition, 13C cross-polarization/magic angle spinning (CP-MAS) NMR could be applied to newly manufactured lignin–phenol-formaldehyde resins.10,11 Information about PF resin obtained by solid-state NMR, however, is relatively limited compared with that from multi-dimension solution NMR12 and synchrotron-based X-ray fluorescence.13 In many cases, the investigation of PF resin will need to combine solid state NMR with other analytical methods. Moreover, the actual impregnation process for PF resin before curing, which is significant for the quality control of the modified materials, has not yet been studied using solid-state NMR.
In developing an evaluation method for natural biomass resources, we have accomplished multi-scale instrumental analyses mainly using solid-state NMR for studying not only the removal of biomass constituents from bamboo14 but also steam treatments of bamboo.15 We have also revealed nanostructures of denatured Japanese cypresses and their magnetic relaxation processes with/without water molecules using multi-scale instrumental analyses.16 Moreover, as examples of magnetic relaxation analysis of biomass polymers, we have also produced a correlational analysis between the mechanical properties and relaxation time for poly(lactic acid)/poly(ε-caprolactone) alloys17 as well as a morphological analysis of poly(lactic acid)/nano-clay composite using variable temperature relaxation time analysis.18 Based on our previous knowledge of solid-state NMR of biomass polymers, we show here a new approach using this technique for studying quality control of PF resin impregnated soft wood we have previously reported on.19
As an example of the expanded use of solid-state NMR methods into natural biomass resources in industrial fields, we carried out an integrated analysis, which was studied for the effects of resin content and moisture content at molecular- to nano-scale in the PF resin impregnation process. The integrated analysis, consisting of four spectral analyses and three relaxation time analyses, was used for studying the impregnation of the PF resin, especially the interaction between biomass constituents before curing, knowledge which has been difficult to obtain until now.
Experimental
Materials
From a sapwood of Japanese cedar (Sugi) (Cryptomeria japonica), consecutive 3.5 mm thick discotic plates of 40 mm diameter were cut for matching fiber directions using NC milling machine. The soft wood plate was pre-treated by drying at 105 °C and 2 h to measure its dry weight. The pre-treated soft wood plate was impregnated with 10% or 20% phenol formaldehyde (PF) resin solution using a combination reduced and pressurized injection method as follows. The pre-treated soft wood plate in a pressure can was decompressed to about 130 hPa in order to remove inside air. After maintaining a reduced pressure for 12 h, the PF resin solution was introduced to the pressure can and allowed to soak into the whole of the soft wood plate and then the system was pressurized from atmospheric pressure to 0.85 MPa without delay. After the inside pressure of the can was kept at this pressure for 24 h, it was then returned to atmospheric pressure and the soft wood plate was removed. The soft wood plate was dried at 35 °C using an air dryer until its weight was constant (35 °C_dried). This dried wood plate was placed in 30–33% and 55–65% relative humidity (RH) at 20 °C until attaining a constant weight. The moisture content of each specimen is summarized in Table 1, together with weight percent gain (WPG) by phenol. Each specimen is labelled by the phenol solid content in solution and RH in several figures, for example, 0PF-33RH and 20PF-Dry corresponding to 0% PF resin/20 °C_33% RH and 20% PF resin/35 °C_dried, respectively. We also used untreated and dried Japanese cedar powders (35–53 μm) as reference specimens. These specimens are also labelled as Powder-UT and Powder-Dry, respectively.| Phenol solid content in solution (%) | 0 | 10 | 20 |
| Weight percent gain (WPG) by phenol (%) | 0 | 33 | 65 |
| Moisture content (MC) (%) at 33% RH | 2.8 | 1.5 | 1.4 |
| Moisture content (MC) (%) at 65% RH | 8.5 | 6.4 | 6.7 |
Solid-state NMR spectrum measurements
Magic angle spinning (MAS) nuclear magnetic resonance (NMR) spectra were measured on a Varian 400 NMR system spectrometer (Palo Alto, CA) with a Varian 4 mm double-resonance T3 solid probe. Samples were placed in a 4 mm ZrO2 rotor spun at 15 kHz over a temperature range of 20 to 24 °C. 1H MAS NMR spectra were collected with a 2.9 μs π/2 pulse at 399.86 MHz for the 1H nuclei, a 40 ms acquisition period over a 30.5 kHz spectral width in 16 transients, and a 3 s recycle delay. 13C MAS NMR spectra were collected with 2.6 μs π/2 pulse at 100.56 MHz for the 13C nuclei and a 40 ms acquisition period over a 30.7 kHz spectral width. Proton decoupling was performed with an 86 kHz 1H decoupling radio frequency with a small phase incremental alteration (SPINAL) decoupling pulse sequence.20 Cross-polarization/magic angle spinning (CP-MAS) NMR spectra were measured with a 5.0 s recycle and 1024 transients delay, using a ramped-amplitude pulse sequence21 with a 2 ms contact time and a 2.5 μs π/2 pulse for the 1H nuclei. The amplitude of the 1H nuclei was ramped up linearly from 90.5% of its final value during the cross polarization contact time. The contact time was optimized by the measurements of several selected samples with variable contact times (100–8000 μs). Dipolar decoupling/magic angle spinning (DD-MAS) spectra were measured used the single π/2 pulse for the 13C nuclei with a 60 s recycle delay in 1024 transients. Pulse saturation transfer/magic angle spinning (PST-MAS) NMR was measured used the single π/2 pulse for the 13C nuclei with a 3 s recycle delay in 2048 transients after saturation of 1H nuclei with 14 consecutive 2.5 μs pulses and a 27.5 μs delay.Nuclei magnetic relaxation time analysis
The 1H spin-lattice relaxation time in the laboratory frame (T1H) was indirectly measured via the detection of the 13C resonance and enhanced by the cross-polarization applied after a π pulse to the 1H nuclei with the inversion recovery method. The 13C spin-lattice relaxation time in the laboratory frame (T1C) was measured with the conventional Torchia's pulse sequence.22 The 1H spin-lattice relaxation time in the rotation frame (T1ρH) was indirectly measured via detection of 13C resonance enhanced by cross-polarization applied after a π/2–τ-spin lock pulse (63 kHz of radio frequency) with variable spin lock times over a range of 100–15![[thin space (1/6-em)]](https://www.rsc.org/images/entities/char_2009.gif) 000 μs. The relaxation time analyses were performed with the same solid-state probe with the same contact time and acquisition period used for the 13C CP-MAS NMR spectrum.
000 μs. The relaxation time analyses were performed with the same solid-state probe with the same contact time and acquisition period used for the 13C CP-MAS NMR spectrum.
Results and discussion
1H MAS NMR spectra of Japanese cedar – changes with PF resin impregnation and moisture
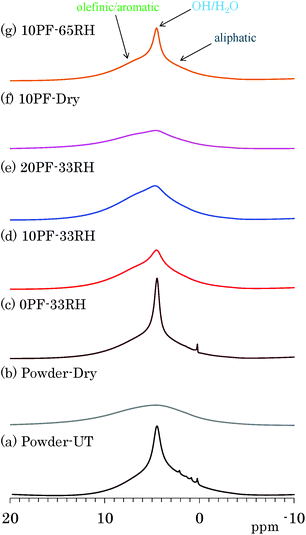
The effects of water molecules and PF resin were directly examined by changes of signal intensity and line width in 1H MAS NMR spectra. Fig. 1 shows 1H MAS NMR spectra of selected Japanese cedar plates treated in various humidity and PF resin concentrations, compared with those from untreated and dried Japanese cedar powders (35–53 μm). All 1H MAS NMR spectra of Japanese cedar plates measured are also shown for each dried and RH condition in Fig. S1 (ESI†). One can see a large sharp signal at 5 ppm overlapped with broader signals around 0–10 ppm in the 1H MAS NMR spectrum of untreated wood powder [Fig. 1(a)]. The former signal could be assigned as bound water and the latter as woody protons, respectively. In the 1H MAS NMR spectrum of dried wood powder [Fig. 1(b)], the signal of bound water disappeared and the remained woody proton signal became broader. At the same time, trace but relatively sharp signals around 0–3 ppm also disappeared. These signals were assigned as volatile aliphatic extractives because of their easily removal by oven drying.The signal intensity of bound water was greatly affected not only by the humidity but also by the PF resin concentration. Understandably, for the same PF resin concentration (10%), the bound water signal intensity increased with increasing relative humidity [Fig. 1(d), (f) and (g)]. For the same relative humidity (33% RH), the signal intensity of bound water decreased with increasing the phenol solid content in solution [Fig. 1(c)–(e)]. Furthermore, the intensity of bound water in the 1H MAS NMR data ordered corresponding to moisture content (Table 1). An effect of the PF resin impregnation also appeared as an increase of aromatic proton signal; however, its degree was relatively small because of the very wide line width as well as the presence of woody proton signals. The signal of woody protons and phenolic protons broadens due to the decrease of water molecules [Fig. 1(f)], similarly to the dried wood powder [Fig. 1(b)]. The signal broadening of woody protons indicated that the removal of water molecules enhanced the spin–spin relaxation (T2) of both woody and phenolic protons.
13C CP-MAS NMR spectra of Japanese cedar – changes with PF resin impregnation and moisture
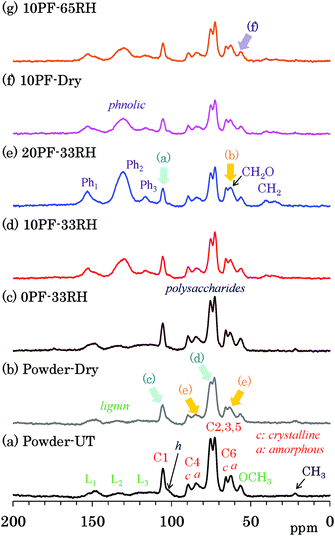
Changes of each biomass constituents due to the PF resin impregnation were examined by 13C CP-MAS NMR, which is the most common solid-state NMR method used for woody materials. Fig. 2 shows selected 13C CP-MAS NMR spectra corresponding to 1H MAS NMR spectra presented in the previous subsection. All 13C CP-MAS NMR spectra of Japanese cedar plates measured are also shown in Fig. S2 (ESI†). Signals for biomass constituents in the spectra were assigned based on our previous reports about modified bamboos and cypresses.14–16 The assignments of cellulose signals are shown over the 13C CP-MAS NMR spectrum of untreated cedar powder [Fig. 2(a)]. The largest doublet-like signals (73, 75 ppm) were attributed to overlapped signals derived from three cellulose endocyclic carbons (C2, 3, 5). The cellulose carbons bearing the glycosidic linkage appeared at relatively lower field [C1: 105 ppm; C4 (crystalline): 89 ppm; C4 (amorphous): 84 ppm] while the cellulose exocyclic carbon appeared at higher field [C6 (crystalline) 66 ppm; C6 (amorphous) 62 ppm]. Note that distinction between crystalline and amorphous carbons was possible for C4 and C6 carbons; the crystalline carbons resonate at a slightly higher field than the amorphous carbons. In contrast, the lignin carbons showed relatively sharp OCH3 signal at higher field (56 ppm) and broad aromatic/olefinic signals around 110 to 160 ppm. The latter was classified as the following three regions, L1 (aromatic/olefinic carbons with OH/OR substituents, 142–162 ppm), L2 (quaternary aromatic/olefinic carbons, 124–142 ppm), and L3 (unsubstituted aromatic/olefinic carbons, 110–124 ppm). In comparison with cellulose and lignin, signals of hemicellulose in the untreated cedar were obscure because of the overlap with cellulose signals; only the C1 signal of xylan (mark h) was distinguishable on the shoulder of the C1 signal of cellulose. Furthermore, a small signal at the highest field (22 ppm) was assigned to the CH3 of acetyl groups in lignin carbohydrate complex (LCC).The assignments of PF resin signals are also presented over the CP-MAS NMR spectrum of 20% PF resin impregnated cedar plate [Fig. 2(e)]. Aromatic signals resulted from the PF resin were assigned to the following three regions, Ph1 (hydroxyl-substituted carbons, 145–160 ppm), Ph2 (unsubstituted meta aromatic/methylene-substituted aromatic/unsubstituted para aromatic carbons, 120–140 ppm), Ph3 (unsubstituted meta aromatic carbons, 110–120 ppm), by reference to the previous report about solid phenolic resins.23 These three signals, Ph1, Ph2, and Ph3 overlapped with the lignin signals in the following regions, L1 (142–162 ppm), L2 (124–142 ppm), and L3 (110–124 ppm), respectively. Although the lignin signals of cedar appeared as small and broad signals, the signals of PF resin had a relatively higher intensity, especially in the range of 120–140 ppm (Ph2). The signal intensities were observed in order as follows: Ph2 ≫ Ph1 > Ph3. Broad smaller signals that appeared at 30–40 ppm was assigned as CH2 signals, which were another characteristic signal of the PF resin in the previous report.23 With increasing PF resin concentration [Fig. 2(c)–(e)], these PF resin aromatic signals increased without changing the signal intensity ratio, although the unsubstituted meta aromatic carbons (Ph3) could not be detected in the wood–PF resin treated at 80 °C.24
The impregnation of PF resin produced obvious changes in the cedar signals. Although the CH3 of acetyl groups could be observed in the samples without the PF resin [Fig. 2(a)–(c)], this signal disappeared after the impregnation of PF resin [Fig. 2(d)–(g)]. With increasing concentration of PF resin for the impregnated cedar at 33% RH [Fig. 2(c)–(e)], the cellulose carbons bearing the glycosidic linkage (C1, C4) decreased [arrow (a)] and the exocyclic (C6) signals increased [arrow (b)], based on the signal intensities of cellulose endocyclic carbons (C2, 3, 5). Both the decrease of the glycosidic linkage signals (C1, C4) and the increase of the exocyclic signals (C6) were also observed both in dried and 65% RH cedars [Fig. S2†]. The previous NMR study concerning resol phenol-formaldehyde prepolymer resin, however, showed that methylol (CH2OH) signals appeared in the range of 61–65 ppm.25 According to this assignment, the exocyclic signals would overlap with the methylol signal of the PF resin. That is, the increase of the exocyclic signals could be was attributed to the increase of methylol signal intensity depending on the phenol solid content in solution.
Meanwhile, in the heat-dried cedar powder [Fig. 2(b)], the 13C CP-MAS signals of the carbohydrates became smaller and broader. Although the lignin signals remained almost unchanged, the C1 signal of cellulose decreased at the largest rate [arrow (c)]. The signal shape particularly changed for three cellulose endocyclic carbons (C2, 3, 5), that is, the lower field signal (75 ppm) decreased [arrow (d)]. A signal shape change also appeared in the C4 and C6 signals of cellulose: amorphous carbons [arrow (e)] were more broadened than crystalline carbons. As shown in Fig. S2,† the signal intensities of both 10% and 20% PF resin impregnated cedars increased in the humid conditions, although those of 0% PF resin impregnated cedars stayed almost unchanged regardless of the relative humidity. The 13C CP-MAS signal increase of PF resin impregnated cedars in the humid conditions was caused by an enhancement of the cross-polarization efficiency in the presence of water molecules. In the PF resin impregnated cedar plates, the signal ratios of amorphous cellulose C6 increased with the relative humidity [Fig. 2(g), arrow (f)]; however, the signal ratio between each type of carbohydrate carbon remained almost unchanged.
13C DD-MAS NMR spectra of Japanese cedar – changes with PF resin impregnation and moisture
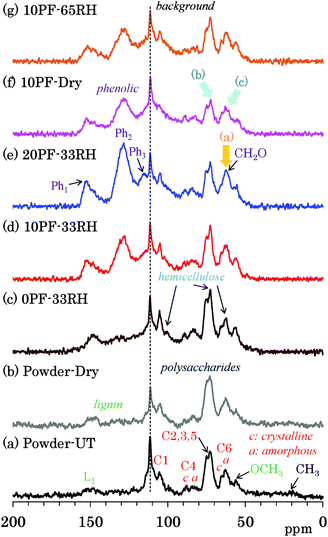
Because 13C CP-MAS NMR is a method that uses the cross-polarization from 1H nuclei to 13C nuclei, the signal intensity of carbon atoms that are not connected to any protons can possibly become very low. Because 13C DD-MAS NMR is a direct observation method for 13C nuclei that does not require the use of an interaction between 13C and 1H, all 13C signals could be quantitatively detected using a sufficiently long recycle delay time to allow the nuclei to relax. Fig. 3 shows selected 13C DD-MAS NMR spectra comparing PF resin impregnated cedar plates with cedar powder while Fig. S3 (ESI†) shows all 13C DD-MAS NMR spectra of Japanese cedar plates. In all cases, a background signal due to the probe appeared at 113 ppm. In the 13C DD-MAS NMR spectrum of untreated cedar powder [Fig. 3(a)], although all signals of cellulose could be detected, these signal shapes were different from the CP-MAS spectrum because of the higher intensity of hemicellulose signals, which overlapped with the higher field cellulose endocyclic (C2, 3, 5) signals and the amorphous cellulose exocyclic (C6) signal. Furthermore, the methylol (CH2O) signals, which also overlapped with the cellulose exocyclic signals, increased with the concentration of PF resin in the DD-MAS spectra of 33% RH specimens [Fig. 3(c)–(e), arrow (a)]. In the 10% PF resin impregnated cedar dried at 35 °C [Fig. 3(f)], the ratio of carbohydrate carbons to aromatic/olefin carbons was smaller [arrows (b) and (c)] than other cedar samples because of long nuclear relaxation times for 13C nuclei in the dried PF resin impregnated cedar. The details of the relaxation times will be discussed in later sections.13C PST-MAS NMR spectra of Japanese cedar – changes with PF resin impregnation and moisture
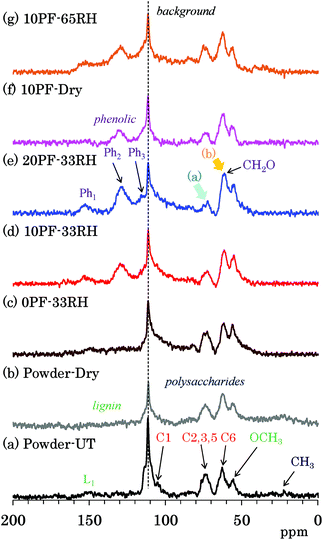
The PST-MAS NMR method uses a saturation pulse for 1H nuclei before irradiation of a single π/2 pulse for 13C nuclei. The saturation 1H pulse induces the nuclear Overhauser effect (NOE), which is effective for hydrogen-containing substituents with high mobility, resulting in an enhancement of their 13C signal intensities. Fig. 4 shows selected 13C PST-MAS NMR spectra comparing PF resin impregnated cedar plates with cedar powder while Fig. S4 (ESI†) shows all 13C PST-MAS NMR spectra of Japanese cedar plates. The background signal at 113 ppm in all the 13C PST-MAS NMR spectra was also observed in the 13C DD-MAS NMR spectra. In the 13C PST-MAS NMR spectrum of untreated cedar powder [Fig. 4(a)], the signals of cellulose exocyclic (C6) signal and lignin OCH3 carbon were effectively detected, while those of cellulose endocyclic carbons (C2, 3, 5) weakened and became one broad signal.In comparison with the PF resin impregnated cedar at 33% RH [Fig. 4(c)–(e)], the 13C PST-MAS signal intensity of cellulose endocyclic carbons further reduced [arrow (a)] depending on the phenol solid content in solution. Meanwhile, the signal intensity of methylol (CH2O) carbons increased [arrow (b)] with increasing the phenol solid content. As for the signal changes caused by the relative humidity, not only in the 10% PF resin impregnated cedars [Fig. 4(d), (f) and (g)], but also in the 0% PF and 20% PF resin impregnated cedars [Fig. S4†], the ratio of the three 13C PST-MAS signals almost unchanged. Because the increase of the 13C PST-MAS NMR signal correlates with the molecular mobility, the impregnation of PF resin suppressed the molecular motion of cellulose endocyclic carbons (C2, 3, 5), although the effect on the molecular motion of cellulose exocyclic carbon (C6) was unclear because of the overlap with the methylol groups of the PF resin.
T1H of Japanese cedar – changes with PF resin impregnation and moisture
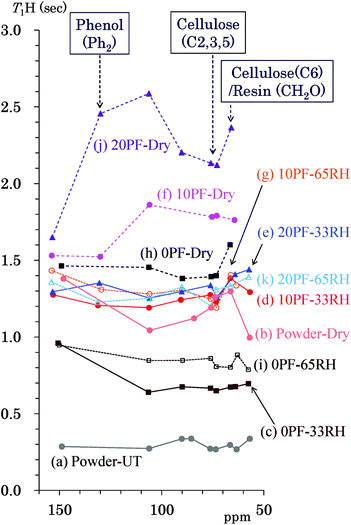
The 1H spin-lattice relaxation time in the laboratory frame (T1H) takes a specific value for each biomass constituent of woody materials14 and is changed by interactions with other biomass constituents and water molecules.16 In order to obtain information about the interactions and environment about not only the biomass constituents, but also for the phenolic additives, changes of the T1H value due to the PF resin impregnation and moisture were examined. Fig. 5 shows T1H values of the PF resin impregnated cedar plates and reference powders determined by the inversion recovery method using the 13C CP-MAS pulse sequence. The data points show the corresponding T1H value to the chemical shift of each signal appearing in Fig. 2. The data points belonging to the same specimen are shown as the same colour and are connected by lines. The data set for each specimen was obtained from the same relaxation time experiment. The untreated cedar powder [Fig. 5(a)] had the shortest T1H values (0.3 s) compared with not only the untreated bamboo but also commercially available lignin.14 The T1H values of cedar powder were lengthened to 1.0–1.5 s by heat-drying [Fig. 5(b)]. Similar to the denatured Japanese cypress,16 the 1H spin-lattice relaxation in the laboratory frame (T1H relaxation) was suppressed by removal of water molecules. Longer T1H values were also caused by the impregnation of PF resin. In the 35 °C air-dried conditions [Fig. 5(f), (h) and (j)], the T1H values increased on raising the phenol solid content in solution (0% PF: 1.4–1.6 s; 10% PF: 1.5–1.9 s; 20% PF: 1.6–2.6 s). However, in 33% RH [Fig. 5(c)–(e)] and 65% RH [Fig. 5(g), (i) and (k)] conditions, 10% PF resin and 20% PF resin impregnated cedar exhibited almost the same T1H values (1.2–1.6 s) while 0% PF resin impregnated cedar had shorter T1H values (0.6–1.0 s). The T1H relaxation was inhibited by the PF resin impregnation; however, this suppression was less in the presence of water molecules.T1C of Japanese cedar – changes with PF resin impregnation and moisture
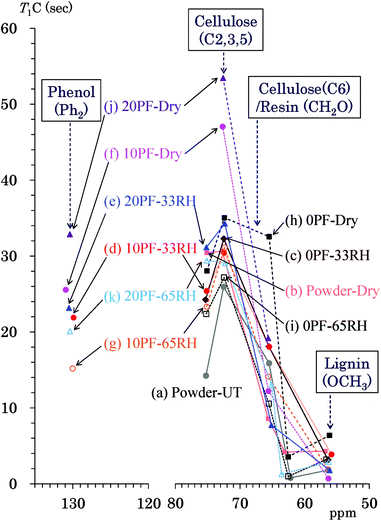
Because the T1H values are averaged by spin diffusion between each 1H nuclei, the 13C spin-lattice relaxation time in the laboratory frame (T1C) gives more information about the interactions and environment for each constituent compared with the T1H value. Fig. 6 shows T1C values of the PF resin impregnated cedar plates and reference powders determined by Torchia's method using the 13C CP-MAS pulse sequence. Similarly to Fig. 5, the data points show the corresponding T1C value to the chemical shift of each signal appearing in Fig. 2. The labels of the specimens appear from top to bottom in descending order of the relaxation time with some exceptions. The cellulose carbons bearing the glycosidic linkage (C1, C4) had T1C values with larger errors because of longer values. Thus, the endocyclic signals (C2, 3, 5: 75, 73 ppm) were targeted for the T1C value change of cellulose ring in this study. The cellulose endocyclic carbons of the untreated cedar powder had the shortest T1C values (14–26 s) [Fig. 6(a)]. Similar to the behavior of the T1H values, the heat-drying made the T1C values of endocyclic carbons longer (30–31 s) [Fig. 6(b)] compared with those for the humid conditions. In the 35 °C air-dried condition [Fig. 6(f), (h) and (j)], the T1C values of endocyclic carbons was increased by the phenol solid content in solution; the order of T1C values was as follows: 20% PF (53 s) > 10% PF (47 s) > 0% PF (28–35 s). Both in 33% RH [Fig. 6(c)–(e)] and 65% RH [Fig. 6(g), (i) and (k)], the T1C values of endocyclic signals were affected by water molecules to concentrate in a narrow range (22–34 s). Higher phenol solid content and relative humidity generally produced longer T1C values; however, there were some exceptions for the T1C values of higher field signal (73 ppm).The cellulose exocyclic carbons (C6) had shorter T1C values than the endocyclic carbons; in particular, the amorphous form (63 ppm) had very short T1C (1–6 s) values compared with those for crystalline forms (65 ppm) (8–16 s). The T1C values of lignin could be only determined for the OCH3 group (56 ppm) because the lignin signals in the aromatic/olefinic region were weak and broad. The T1C of lignin OCH3 took very similar values (1–6 s) to that of the amorphous cellulose endocyclic carbon. Tendencies of T1C changes due to the phenol solid content and relative humidity were not obvious for the cellulose exocyclic group because of signal overlap with the methylol carbons of the PF resin. The quaternary aromatic/olefinic signals (Ph2: 130 ppm), which were the largest phenolic signals, were targeted for examining the T1C changes of the PF resin unit. The T1C values of the phenolic signal in the Ph2 region changed depending on the PF resin concentration and humidity; they ordered as follows: 20% PF dried (33 s) > 10% PF dried (26 s) > 20% PF, 33% RH (23 s) > 10% PF, 33% RH (22 s) > 20% PF, 65% RH (20 s) > 10% PF, 65% RH (15 s). The T1C order of Ph2 carbons was almost same as that of the endocyclic carbons; the T1C value increased with increasing the phenol solid content and with decreasing relative humidity in a similar manner to the T1H value.
T1ρH of Japanese cedar – changes with PF resin impregnation and moisture
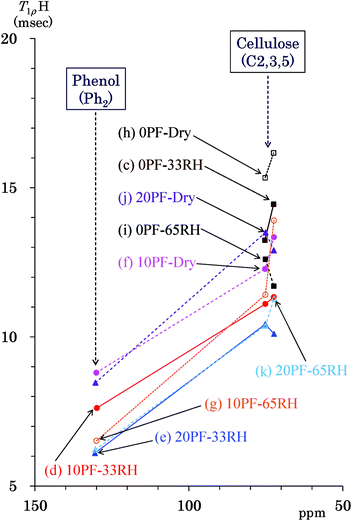
The 1H spin-lattice relaxation in the rotation frame (T1ρH relaxation) corresponds to slower molecular motions than the T1H relaxation. Thus, changes of the 1H spin-lattice relaxation time in the rotation frame (T1ρH) due to the PF resin impregnation and moisture were examined in order to obtain information on the slower molecular motions of biomass constituents and PF resin unit. Fig. 7 shows T1ρH values of the PF resin impregnated cedar plates and reference powders determined by a spin-lock method using the 13C CP-MAS pulse sequence. Similarly to Fig. 5, the data points show the corresponding T1ρH value to the chemical shift of each signal appearing in Fig. 2. The cellulose endocyclic signals (C2, 3, 5: 75, 73 ppm) and the quaternary aromatic/olefinic signals (Ph2: 130 ppm) were targeted for examining the effect of the PF resin impregnation and relative humidity because these signals had enough intensities and obvious tendencies for the T1C values. The T1ρH values of the cellulose endocyclic signals were generally reduced not only by the PF resin impregnation but also by water molecules. The 0% PF resin impregnated cedar dried at 35 °C had the longest T1ρH value (15–16 ms) [Fig. 7(h)], which decreased with increasing relative humidity (33% RH: 13–14 ms > 65% RH: 12–13 ms) [Fig. 7(c) and (i)]. The PF resin impregnation shortened the T1ρH value of endocyclic signals (10% PF: 12–13 ms, 20% PF: 13–14 ms) [Fig. 7(f) and (j)]. Water molecules also shortened the T1ρH values of the PF resin impregnated cedar (10% PF, 65% RH: 11–14 ms, 10% PF, 33% RH: 11–11 ms, 20% PF, 65% RH: 10–11 ms, 20% PF, 33% RH: 10–10 ms). The phenolic signals in the Ph2 region took shorter T1ρH values (6–9 ms) than the cellulose endocyclic signals. The T1ρH values of the Ph2 signals were also decreased by the PF resin impregnation and water molecules. Although water molecules accelerated the 1H spin-lattice relaxation both in the laboratory frame and in the rotation frame, the PF resin impregnation suppressed the 1H spin-lattice relaxation in the rotation frame contrary to the laboratory frame.Nanostructure of the PF resin impregnated Japanese cedars and relationship to results of solid-state NMR
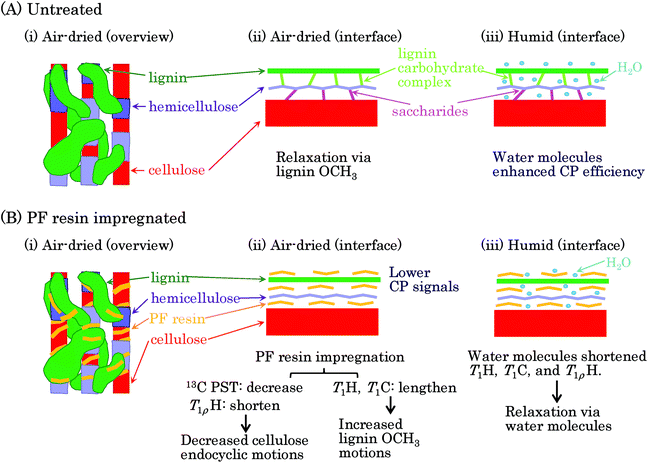
Previous reviews have proposed nanostructures consisting of biomass constituents (cellulose, hemicellulose, and lignin) for woody and herbaceous materials.26,27 Based on these hierarchic models, we present a postulated nanostructure of the PF resin impregnated Japanese cedar in Fig. 8. The cellulose–hemicellulose aggregate, which is made up of cellulose bundles connected with amorphous hemicellulose, are bridged by a three-dimensional network of lignin [Fig. 8(A)(i)]. The interface of each biomass constituent could resemble the situation presented shown in Fig. 8(A)(ii): cellulose connected with hemicellulose through saccharide while hemicellulose connected with lignin through a lignin carbohydrate complex (LCC). Since biomass constituents do not closely contact each other, water molecules can enter the interface between each biomass constituent [Fig. 8(A)(iii)]. Meanwhile, because both spectra and relaxation times in each biomass constituent were clearly affected by the PF resin impregnation, the PF resin also existed at the interface of each biomass constituent [Fig. 8(B)(i)]. The PF resin impregnation caused not only the CH3 and C![[double bond, length as m-dash]](https://www.rsc.org/images/entities/char_e001.gif) O signals of LCC to disappear in the solid-state NMR spectra but also changed the spin-lattice relaxation times of cellulose. From these results, we can surmise that the PF resin impregnation decomposed saccharide linkages between cellulose and hemicellulose as well as the LCC linking hemicellulose and lignin, resulting in the PF resin intercalating into the interfaces of the biomass constituents [Fig. 8(B)(ii)]. Although larger amounts of water molecules penetrate inside of biomass constituents depending on the relative humidity, the PF resin impregnation impedes the penetration of water [Fig. 8(B)(iii)]. In fact, the 1H MAS NMR spectra (Fig. S1†) showed that even the humid 20% PF resin impregnated specimen had a similar water content to the air-dried 0% PF specimen. The water content affected the signal intensity of the 13C CP-MAS NMR spectra (Fig. S2†) because water molecules enhanced the 1H–13C cross-polarization efficiency. Actually, the air-dried PF impregnated cedar, which had a lesser amount of water, had a lower intensity in its 13C CP-MAS signals.
O signals of LCC to disappear in the solid-state NMR spectra but also changed the spin-lattice relaxation times of cellulose. From these results, we can surmise that the PF resin impregnation decomposed saccharide linkages between cellulose and hemicellulose as well as the LCC linking hemicellulose and lignin, resulting in the PF resin intercalating into the interfaces of the biomass constituents [Fig. 8(B)(ii)]. Although larger amounts of water molecules penetrate inside of biomass constituents depending on the relative humidity, the PF resin impregnation impedes the penetration of water [Fig. 8(B)(iii)]. In fact, the 1H MAS NMR spectra (Fig. S1†) showed that even the humid 20% PF resin impregnated specimen had a similar water content to the air-dried 0% PF specimen. The water content affected the signal intensity of the 13C CP-MAS NMR spectra (Fig. S2†) because water molecules enhanced the 1H–13C cross-polarization efficiency. Actually, the air-dried PF impregnated cedar, which had a lesser amount of water, had a lower intensity in its 13C CP-MAS signals.
On the other hand, we have showed that the T1H relaxation proceeded via lignin in the heat-dried Japanese cypress because lignin-containing samples had higher molecular mobility.16 In the PF resin impregnated Japanese cedar that had been heat-dried, the T1H relaxations of biomass constituents also proceeded via lignin and they were suppressed by the PF resin because of it hindering the T1H relaxation via lignin. In the T1H relaxation process, the T1H value for each constituent was averaged by 1H–1H spin diffusion. Because the T1C values, as well as the T1H values, were lengthened by the PF resin impregnation, the T1C relaxation was dominated by the T1H relaxation. Judging from the very short T1C value of the lignin OCH3, the T1H relaxation occurred at this terminal substituent at first, and then the T1C relaxation continued by 1H–13C cross-polarization and 1H–1H spin diffusion. Meanwhile, the T1ρH relaxation was affected by the 1H–1H spin diffusion and did not follow a relaxation route via a specific substituent, such as the lignin OCH3. The T1ρH value reflected the environment of each substituent. The T1ρH values were shortened by the PF resin impregnation in opposition to the T1H and T1C values.
As shown above, the PF resin impregnation suppressed the T1H and T1C relaxations although it promoted T1ρH relaxation. Generally, the T1H, T1C, and T1ρH values shows V-shaped curves against rotational correlation time (τc). The minimum T1H and T1C values appears at the Larmor frequency (ω0) while the minimum T1ρH values appears at the spin-lock frequency (ω1) for measurement of the T1ρH value, respectively. The rotational correlation time (τc) can be rephrased as a molecular tumbling rate; thus, the T1H, T1C, and T1ρH values reflected the molecular motions near that frequency where the minimum values occurred. The T1H, T1C, and T1ρH values grew with increasing temperature in the higher temperature region (rapid molecular motions having lower τc).28 Fig. S5 (ESI†) shows the T1H changes of the dried 10% PF resin impregnated specimen with increasing temperature. Because the T1H values increased with increasing temperature according to the results shown in Fig. S5† as well as in our previous study,16 the increase of T1H value due to the PF resin impregnation meant enhancement of the molecular motions of the lignin OCH3 corresponding to the Larmor frequency (ω0 = 400 MHz) had taken place, resulting in the increases of the T1H and T1C values. Fig. S6 (ESI†) shows the T1ρH changes of the dried 10% PF resin impregnated specimen with increasing temperature. The T1ρH value also increased with increasing temperature according to the results shown in Fig. S6,† hence the decrease of the T1ρH value due to the PF resin impregnation resulted from hindrance of the molecular motion of the cellulose ring corresponding to the spin-lock frequency (ω1 = 63 kHz). The suppression of the molecular motion of the cellulose ring due to the PF resin impregnation was also supported by the suppression of the molecular motion of cellulose endocyclic carbons (C2, 3, 5) in the 13C PST-MAS NMR spectra. Meanwhile, all spin-lattice relaxation times measured in this work, such as T1H, T1C, and T1ρH values, became shorter under humid conditions than in the heat-dried condition. The reductions of relaxation times both in laboratory and rotation frames were not caused by changes of molecular mobility but were due to faster relaxation routes via water molecules [Fig. 8(A)(iii) and (B)(iii)].
The above results and discussion present an integrated analysis of solid-state NMR spectra and nuclear magnetic relaxation times for the PF resin impregnated Japanese cedar. This integrated analysis showed that PF resin could penetrate not only the lignin but also the carbohydrate polymers. The integrated analysis also revealed that PF resin enhanced the faster molecular motions of the lignin OCH3 while it suppressed the slower molecular motions of the cellulose ring. Meanwhile, we have reported that the floating extrudability of PF resin impregnated soft wood improved with increasing PF resin content, as well as with moisture content.19 In our presented impregnation model, the faster molecular motions of the lignin OCH3 in the biomass constituents are more enhanced by PF resin. In the floating extrusion process, stress further activates the interface between biomass constituents where PF resin exists because it enhances the molecular motions of the lignin OCH3 group. Because the water molecules improved the extrudability of PF resin impregnated soft wood,19 the interfaces of the biomass constituents are also activated by the reduction of internal hydrogen bonds due to new interactions with water molecules. In this way, the extrudability of PF resin impregnated soft wood could be explained by the interfacial conditions between the biomass constituents using our proposed model. As shown above, our integrated analysis revealed the changes of nanostructure and interaction with water molecules due to the PF resin impregnation, which are significant issues for quality control of the floating extrusion process. Now, we intend to perform integrated analyses of the impregnation of other chemicals into woods as well as of the effects of heat treatments on woods already impregnated with various chemicals in order to reveal significant parameters that affect the quality control of manufacturing processes. In the future, the integrated analysis will be applied to industrial processes that include not only natural biomass resources but also biomass synthetic polymers.
Conclusions
Impregnation of phenol formaldehyde (PF) resin into Japanese cedar plates was studied by the integrated analysis of solid-state NMR spectra and nuclear magnetic relaxation times. The 1H MAS NMR spectra showed that the PF resin impregnation caused less water to be bound inside of the wood at the same humidity and broadened the line width of wood signals. The 13C CP-MAS NMR spectra gave significant information about changes of each biomass component due to the PF resin impregnation. The aromatic signals of PF resin overlapped with those of lignin while the methylol signals overlapped with the cellulose exocyclic signals. Although methylene signals of PF resin appeared alone, those intensities were weaker than other PF resin signals. Because the PF resin impregnation weaken the 13C CP-MAS signals of air-dried carbohydrate polymers, PF resin must exist near not only lignin but also near carbohydrates in order for it to disturb the interaction between carbohydrates and water. The 13C PST-MAS NMR spectra enhanced signals of high vibrational amplitude substituents with hydrogen atoms. The PF resin impregnation diminished the intensities of the cellulose endocyclic signals; that is, PF resin suppressed the molecular mobility of cellulose rings. All of 13C CP-, DD-, and PST-MAS NMR datasets showed that the overlapped signals of the cellulose exocyclic and the PF resin methylol groups were increased by the PF resin impregnation. This signal increase was not due to changes of molecular mobility but due to an increase of the PF resin concentration. Meanwhile, the T1H value increased with increasing the PF resin concentration and with air-drying. The T1C value of both the cellulose endocyclic and PF resin phenyl carbons also increased with increasing the PF resin concentration and with air-drying, similar to the T1H value. Unlike these spin-lattice relaxations in the laboratory frame, the T1ρH value of both the cellulose endocyclic and PF resin phenyl groups decreased with increasing the PF resin concentration. By removing water, however, the T1ρH value increased as did the T1H and T1C values. These relaxation time analyses indicated that the PF resin impregnation did not suppress the molecular motions of the lignin OCH3 group at the Larmor frequency (MHz order) but rather corresponding molecular motions of the cellulose rings at the spin-lock frequency for 1H nuclei (kHz order). Next, we are planning to study not only the impregnation of other chemicals but also heat treatments of such impregnated wood.Conflicts of interest
There are no conflicts to declare.Acknowledgements
The authors acknowledge the research support (No. 11-17) provided by the LIXIL JS Foundation and the support of an Emachu research grant (2013-2015) provided by the Japan Wood Research Society.References
- T. Wang, P. Phyo and M. Hong, Solid State Nucl. Magn. Reson., 2016, 78, 56–63 CrossRef CAS PubMed
.
- T. Kobayashi, B. Kohn, L. Holmes, R. Faulkner, M. Davis and G. E. Maciel, Energy Fuels, 2011, 25, 1790–1797 CrossRef CAS
.
- A. A. Vaidya, M. Gaugler and D. A. Smith, Carbohydr. Polym., 2016, 136, 1238–1250 CrossRef CAS PubMed
.
- E. R. Alonso, C. Dupont, L. Heux, D. D. S. Perez, J.-M. Commandre and C. Gourdon, Energy, 2016, 97, 381–390 CrossRef
.
- S. Gårdebjer, A. Bergstrand, A. Idström, C. Börstell, S. Naana, L. Nordstierna and A. Larsson, Compos. Sci. Technol., 2015, 107, 1–9 CrossRef
.
- V.-V. Telkki, M. Yliniemi and J. Jokisaari, Holzforschung, 2013, 67, 291–300 CrossRef CAS
.
- A. Jäger, M. Bertmer and G. E. Schaumann, Geoderma, 2016, 284, 144–151 CrossRef
.
- M.-P. G. Laborie and C. E. Frazier, J. Mater. Sci., 2006, 41, 6001–6005 CrossRef CAS
.
- A. Moubarik, A. Pizzi, A. Allal, F. Charrier and B. Charrier, Ind. Crops Prod., 2009, 30, 188–193 CrossRef CAS
.
- W. Zhang, Y. Ma, Y. Xu, C. Wang and F. Chu, Int. J. Adhes. Adhes., 2013, 40, 11–18 CrossRef CAS
.
- S. Yang, Y. Zhang, T.-Q. Yuan and R.-C. Sun, J. Appl. Polym. Sci., 2015, 132, 42493 Search PubMed
.
- D. J. Yelle and J. Ralph, Int. J. Adhes. Adhes., 2016, 70, 26–36 CrossRef CAS
.
- J. E. Jakes, C. G. Hunt, D. J. Yelle, L. Lorenz, K. Hirth, S.-C. Gleber, S. Vogt, W. Grigsby and C. R. Frihart, ACS Appl. Mater. Interfaces, 2015, 7, 6584–6589 CAS
.
- M. Nishida, T. Tanaka, T. Miki, I. Shigematsu, K. Kanayama and W. Kanematsu, J. Appl. Polym. Sci., 2014, 131, 40243 CrossRef
.
- M. Nishida, T. Tanaka, T. Miki, T. Ito and K. Kanayama, Ind. Crops Prod., 2017, 103, 89–98 CrossRef CAS
.
- M. Nishida, T. Tanaka, T. Miki, Y. Hayakawa and K. Kanayama, Cellulose, 2017, 24, 5295–5312 CrossRef CAS
.
- M. Nishida, Y. Nishimura, T. Tanaka, M. Oonishi and W. Kanematsu, J. Appl. Polym. Sci., 2012, 123, 1865–1873 CrossRef CAS
.
- M. Nishida, T. Tanaka, T. Yamaguchi, K. Suzuki and W. Kanematsu, J. Appl. Polym. Sci., 2012, 125, E681–E690 CrossRef CAS
.
- M. Seki, T. Kiryu, T. Miki, S. Tanaka, I. Shigematsu and K. Kanayama, BioResources, 2016, 11, 7697–7709 CAS
.
- B. M. Fung, A. K. Khitrin and K. Ermolaev, J. Magn. Reson., 2000, 142, 97–101 CrossRef CAS PubMed
.
- G. Metz, X. L. Wu and S. O. Smith, J. Magn. Reson., Ser. A, 1994, 110, 219–227 CrossRef CAS
.
- D. A. Torchia, J. Magn. Reson., 1978, 30, 613–616 CAS
.
- R. L. Bryson, G. R. Hatfield, T. A. Early, A. R. Palmer and G. E. Maciel, Macromolecules, 1983, 16, 1669–1672 CrossRef CAS
.
- M.-P. G. Laborie, L. Salmén and C. E. Frazier, J. Adhes. Sci. Technol., 2006, 20, 729–741 CrossRef CAS
.
- T. H. Fisher, P. Chao, C. G. Upton and A. J. Day, Magn. Reson. Chem., 1995, 33, 717–723 CrossRef CAS
.
- D. M. Alonso, S. G. Wettstein and J. A. Dumesic, Chem. Soc. Rev., 2012, 41, 8075–8098 RSC
.
- R. Vanholme, R. Van Acker and W. Boerjan, Trends Biotechnol., 2010, 28, 543–547 CrossRef CAS PubMed
.
- R. Kimmich and E. Anoardo, Prog. Nucl. Magn. Reson. Spectrosc., 2004, 44, 257–320 CrossRef CAS
.
Footnote |
| † Electronic supplementary information (ESI) available. See DOI: 10.1039/c7ra11295e |
| This journal is © The Royal Society of Chemistry 2017 |

