 Open Access Article
Creative Commons Attribution 3.0 Unported Licence
Large-scale synthesis of polyhedral Ag nanoparticles for printed electronics
Shlomi Polania,
Semyon Melamedb,
Luba Burlakaa,
Fernando De La Vegab and
David Zitoun *a
*a
aDepartment of Chemistry, Bar Ilan Institute of Nanotechnology and Advanced Materials (BINA), Ramat Gan 52900, Israel. E-mail: David.Zitoun@biu.ac.il
bPV Nano Cell Ltd., 8 Hamasger st. P.O. Box 236, Migdal Ha'Emek, 2310102, Israel
First published on 27th November 2017
Abstract
Printed electronics mainly use ink that contains silver with a high weight fraction to print conductive patterns. The synthesis of polyhedral Ag nanoparticles has been previously reported for lab-scale batches with a low weight fraction. The clean synthesis of large batches with homogeneous size and shape and high-volume fraction and conductivity is still challenging. Here, we report an original pathway to yield large batches of high weight fraction (typically 60 g of 50 wt% ink). The synthetic route goes through the formation of Ag2O, which is then reduced by H2O2 in the presence of a stabilizing polymer. The mechanism is discussed in view of the phase and composition analysis of the samples during the reaction. After printing lines of Ag NPs, the electrical properties of the Ag lines were measured, and the results are discussed along with the microstructure. The electrical resistivity reached values as low as 6.6 times the bulk value after mild annealing at 200 °C for 45 minutes.
Introduction
A variety of methods have been reported for the synthesis of silver polyhedral nanoparticles (NPs) with a range of different shapes and controllable sizes, including cubes, rods, wires, and octahedra.1–4 To use silver polyhedral NPs in applications such as printed electronics,5,6 the synthesis must yield large batches with a high volume fraction (20–60%) of homogeneously distributed (size and shape) Ag polyhedral NPs, even if polydispersity could also be beneficial to reach a high metallic ratio in the printed features. Nevertheless, many protocols found in the literature are based on very low concentrations and small volumes of reagents, and the scale-up is often not straightforward. As a consequence, most of the NPs described in the literature are not commercially available due to the lack of large batches (mass per batch) or their excessive cost.At the research lab-scale, various reducing agents were used to form metallic silver (Ag0) by the reduction of silver ions (Ag+) in aqueous or non-aqueous solutions,7,8 followed by stabilization and growth, including sodium borohydride (NaBH4),9 ascorbic acid,10 tannic acid,11 and polyols.12,13 Microwave-assisted synthetic methods were found to be efficient, environmentally friendly, and economically viable.14 In the polyol synthesis, diols such as ethylene glycol reduce Ag+ to metallic silver in the presence of poly(vinyl pyrrolidone) (PVP), which acts not only as a stabilizer, but also as a shaping agent. Face-centered cubic (FCC) silver exhibits different crystallographic planes, and the selective interaction of PVP with the different planes can largely reduce or enhance the growth rate along the (100) direction. The PVP molar ratio (in terms of repeating unit) relative to the silver precursor has an important role in determining the morphology and size of the NPs.9,13–15
A rather less known and very original synthetic route to produce metallic silver involves a particle-mediated pathway in which silver(I) oxide (Ag2O) usually serves as a sacrificial template, and NaBH4 or H2O2 act as the reducing agent. First, Ag+ is converted to silver(I) oxide by significantly raising the pH of the medium. The resultant oxide phase is then reduced to metallic silver. The use of NaOH to produce a solid Ag2O phase, Ag2O(s), is known in the literature; silver ions in the presence of OH− ions form AgOH(aq), which quickly decomposes and precipitates to form the desired Ag2O(s):16–18
| 2Ag(aq)+ + 2OH(aq)− → Ag2O(s) + H2O(l) |
Silver(I) oxide reacts with hydrogen peroxide to form metallic silver. The reaction takes place on the surface of the silver oxide structure:19
| Ag2O(s) + H2O2(aq) → 2Ag(s) + H2O(l) + O2(g) |
NaBH4 can also reduce silver oxide to metallic silver.20,21 The final product morphology and size depend strongly on the crystallographic nature of the sacrificial template.17
Here, we leverage the synthesis of Ag from Ag2O to produce inks of polyhedral silver NPs in large batches (60 g) of 50% weight fraction through an aqueous procedure, more sustainable and green than the common polyol synthesis. The mechanism was studied by the phase analysis of the products at different quenching times by powder X-ray diffraction, transmission electron microscopy, and scanning electron microscopy. The silver ink displays a very high conductivity only 6.6 times lower than the bulk value after a mild annealing.
Results and discussion
Synthesis and structural characterization
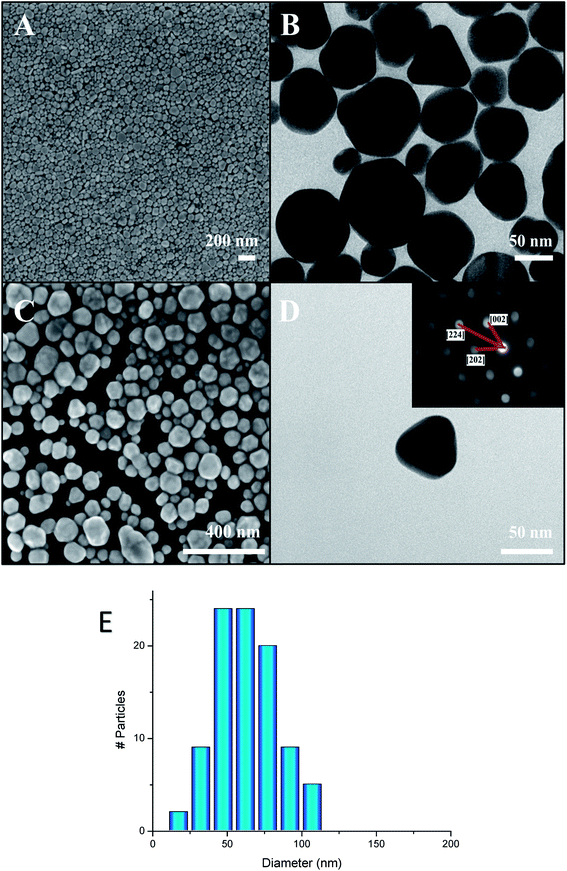
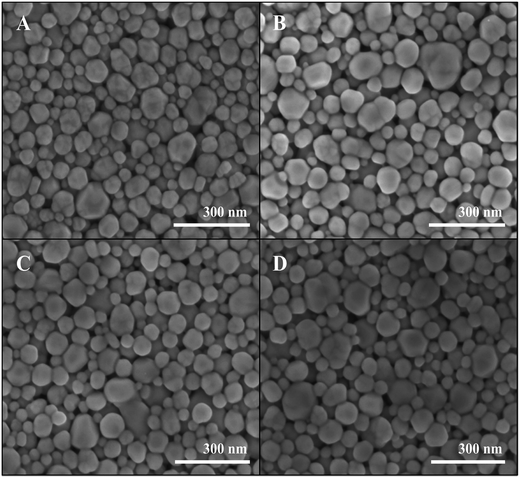
The synthesis yielded large batches of high volume fraction Ag polyhedral NPs. The particle size distribution (PSD) was centered on 64 nm with a standard deviation of 20 nm, as obtained from averaging each particle to a sphere and counting 100 nanoparticles randomly from the SEM images. This result is in good agreement with dynamic light scattering analysis (not reported here). The reaction was complete based on the utilization of AgNO3, and the batches comprised exclusively of faceted polyhedral Ag NPs (Fig. 1A–D). The electron diffraction pattern of a single particle reveals its single crystalline nature with a face-centered cubic (FCC) pattern (inset, Fig. 1D).The X-ray diffractogram of the dried Ag polyhedral NPs shows the exclusive formation of FCC silver (JCPDS 04-0783, Fig. 2C). The reaction mechanism was investigated by the addition of a sub-stoichiometric amount of the reducing agent H2O2 (Fig. 2A and B). In the first experiment, only 10% of the typical amount of H2O2 was added to the colloidal dispersion (Fig. 2A), and the XRD showed a major phase of Ag2O (JCPDS 00-041-1104) with a minor phase of FCC Ag. When the amount of hydrogen peroxide was increased up to 50%, the ratio between the Ag and Ag2O phases increased (Fig. 2B) until the completion of the reaction with the presence of a single FCC Ag phase (Fig. 2C).
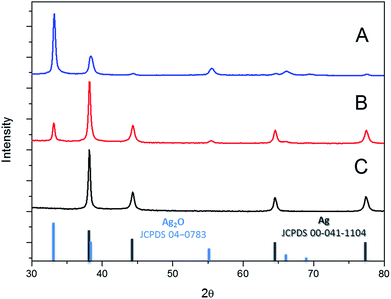 | ||
| Fig. 2 Powder X-ray diffractograms (PXRD) of the reaction intermediates (A and B) and the product of the completed reaction (C). | ||
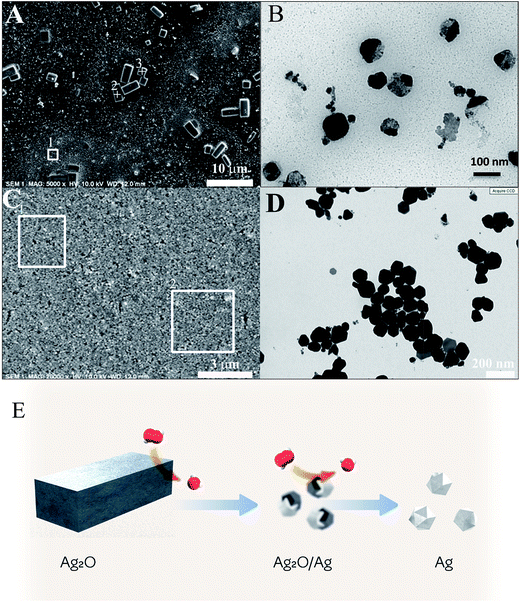
A SEM analysis was performed on the two samples. In the first case (10% hydrogen peroxide) the SEM shows large micron-scale rectangular-shaped particles, which could not be found in the typical synthesis (Fig. 3A). Apart from these large particles, the sample consists of a film of NPS with a size below 100 nm, corresponding to the typical size of the Ag polyhedral NPs (Fig. 3A, area 1). Energy dispersive X-ray spectroscopy (EDS) was performed on several areas of the film. In area 1, a representative area of the Ag NPs film, the only element found was Ag, with a level of C and O below the detection limit. On the other hand, the EDS spectra from the rectangular shape microparticles, spots 2 & 3, agree quantitatively with an atomic Ag/O ratio of 2![[thin space (1/6-em)]](https://www.rsc.org/images/entities/char_2009.gif) :
:![[thin space (1/6-em)]](https://www.rsc.org/images/entities/char_2009.gif) 1, corresponding to the Ag2O oxide observed by XRD (Fig. 3A). A low level of potassium was detected in those crystals, which could arise from the presence of a minute amount of KOH. TEM also shows a bimodal distribution of large Ag2O particles and Ag NPs (Fig. 3B). The largest rectangular-shaped microparticles are excluded from the TEM grid. Interestingly, the mid-size particles show a Z-contrast. This Z-contrast could be due to the chemical composition (Ag or Ag2O, Fig. 3B), meaning that the reaction goes through an intermediate step with biphasic Ag/Ag2O NPs. When we increased the stoichiometric amount of H2O2 to 100%, the SEM images showed a film of Ag polyhedral NPs (Fig. 3C) with EDS spectra corresponding to pure Ag (Fig. 3C, squares 1 and 2). TEM images show the typical product — polyhedral Ag NPs (Fig. 3D).
1, corresponding to the Ag2O oxide observed by XRD (Fig. 3A). A low level of potassium was detected in those crystals, which could arise from the presence of a minute amount of KOH. TEM also shows a bimodal distribution of large Ag2O particles and Ag NPs (Fig. 3B). The largest rectangular-shaped microparticles are excluded from the TEM grid. Interestingly, the mid-size particles show a Z-contrast. This Z-contrast could be due to the chemical composition (Ag or Ag2O, Fig. 3B), meaning that the reaction goes through an intermediate step with biphasic Ag/Ag2O NPs. When we increased the stoichiometric amount of H2O2 to 100%, the SEM images showed a film of Ag polyhedral NPs (Fig. 3C) with EDS spectra corresponding to pure Ag (Fig. 3C, squares 1 and 2). TEM images show the typical product — polyhedral Ag NPs (Fig. 3D).
Reaction mechanism
The phase and composition analysis of the reaction intermediates shows the formation of a silver(I) oxide Ag2O crystalline phase. Ag2O is the best-known oxide of silver, which is usually produced from the anodic oxidation of Ag; it is amphoteric and can be reduced by hydrogen peroxide (H2O2, a redox compound that is also amphoteric) to yield Ag.22 The Ag2O solid phase mediates the formation of silver in a particle-mediated mechanism. The Ag2O particles are reduced by H2O2, and the TEM analysis of a sub-stoichiometric reaction (Fig. 3B) shows the formation of a biphasic Ag2O/Ag Janus particle as an intermediate.The reaction follows a surface driven mechanism where H2O2 chemisorbs and reacts on the surface of Ag2O particles followed by reduction and growth of the pure Ag phase, like a reaction with a reducing gas.23 On a broader view, the reaction proceeds through the following three stages:
| Ag+ reaction with PVP (complexation + slight reduction) | (1) |
| 2Ag(aq)+ + 2OH(aq)− → Ag2O(s) + H2O(l) | (2) |
| Ag2O(s) + H2O2(aq) → 2Ag(s) + H2O(l) + O2(g) (formally but with a large excess of H2O2) | (3) |
The third step of the mechanism is coined in the scheme in Fig. 3E. After formation of Ag2O(s) which forms the large particle observed by SEM, hydrogen peroxide H2O2 reduces the Ag2O on their surface, as demonstrated by the presence of binary biphasic Ag2O/Ag Janus particle. The reaction continues until completion of the reduction process to yield pure Ag NPs.
The mediated-particle mechanism described above presents a significant departure from the mainstream mechanism, which involves the formation of an intermediate phase of AgCl24–27 or AgBr.28 The most popular reaction involves the formation of AgCl, which rapidly precipitates and stays in equilibrium with Ag+ ions that are further reduced to Ag. This mechanism allows to control the shape of the nanocrystals, especially for the formation of Ag nanowires.29 In the case of Ag2O formation, this competitive mechanism is very unlikely, and the TEM provides evidence only for a surface driven mechanism.
The two mechanisms, halogenide- or oxide-based, involve markedly different kinetics of reaction. As the intermediate phase Ag2O reacts directly with H2O2 to form the Ag nanocrystals, the reaction is much faster than in the case of AgCl (Ksp = 1.8 × 10⁻¹⁰) or AgBr (Ksp = 5.0 × 10⁻¹³) intermediates where only a very low concentration of Ag+ ions is available for the nanocrystal growth. The slow kinetics allows an excellent shape control with relatively long reaction time even on small batches. Such a sluggish reaction can impede the industrial production of Ag inks. On the contrary, the mechanism described here is compatible with a scale-up, and batches of 100–1000 g of Ag nanocrystals were produced on a routine basis.
Application to printed electronics
The polyhedral Ag NPs display a high purity and volume fraction with a very low content of stabilizer (PVP). When formulated as an ink (60% wt in tripropylene glycol methyl ether (TPM)), the NPs can be easily coated on a glass to form silver lines with a dispenser (Fig. 4 inset and experimental part). The four-probe resistivity of the pristine lines (1600 μΩ cm) is about 1000 times greater than the bulk Ag resistivity (1.59 μΩ cm, Fig. 4). A gentle annealing under air at 200 °C for 15 minutes brought the resistivity down to 15 μΩ cm (9.4 times the bulk value). A further annealing for 45 minutes brought the resistivity down to 10.5 μΩ cm, 6.6-fold greater than the bulk resistivity. These results are remarkable and fit the needs of conductive inks in printed electronics. The very low annealing temperature is compatible with polymer substrate and packaging.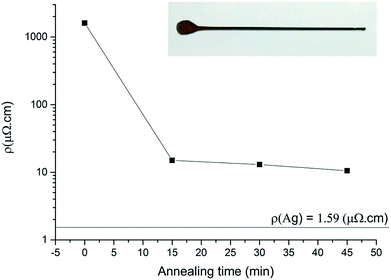 | ||
| Fig. 4 Resistivity vs. annealing time curves while heating at 200 °C. Photograph of the Ag line (inset). | ||
The high conductivity of the Ag lines reveals the high density of the Ag NPs assembly. SEM images of the lines (pristine and annealed) show the dense packing of polyhedral NPs (Fig. 5). The HRSEM shows no detectable change during the annealing process, hence the annealing does not lead to any coarsening or shape evolution of the NPs. Nevertheless, the resistivity decreases by two orders of magnitude during the annealing. This spectacular enhancement does not result from any change in size (64 ± 20 nm), density, shape, or grain boundaries, and therefore results from the interface between the polyhedral Ag NPs. Such a mechanism underlines the high importance of the shape of the Ag NPs. Indeed, an extensive interface between the particles is only achieved with polyhedral NPs and not with spherical ones.
 | ||
| Fig. 5 HRSEM micrographs of Ag lines at different annealing time (A) 0 min, (B) 15 min, (C) 30 min and (D) 45 min. | ||
Conclusions
The large-scale synthesis of polyhedral Ag nanoparticles (NPs) described here follows a mediated-particle mechanism through the formation of rectangular-shaped Ag2O microcrystals. The reaction proceeds through a surface driven conversion of Ag2O to Ag. The PVP-stabilized silver NPs display a low polydispersity in size and shape distribution with a large majority of faceted NPs. The rapid and simple reaction described here is compatible with a scale-up, and batches of 100–1000 g of Ag nanocrystals were routinely and consistently produced. The formulation of polyhedral silver NPs in high volume fraction ink easily forms conductive lines. The resistivity reaches 6.6 times the bulk resistivity after a gentle annealing at 200 °C. Finally, this original synthesis pathway is fully compatible with a large-scale production in the field of printed electronics on soft substrates such as polymers.Experimental
Chemicals
AgNO3 (63.5% Ag, Holland Moran), polyvinylpyrrolidone powder (PVP, MW = 55![[thin space (1/6-em)]](https://www.rsc.org/images/entities/char_2009.gif) 000, Sigma-Aldrich), KOH (90%, Chen-Samuel, Israel), and H2O2 as 35% water solution (Makhteshim, Israel) were used without further purification. Anti-foaming agent Contraspum 1012 was obtained from Zschimmer & Schwarz, Germany. Aqueous solutions were prepared using deionized (DI) water (Ionex purification system, PuriTech, Belgium).
000, Sigma-Aldrich), KOH (90%, Chen-Samuel, Israel), and H2O2 as 35% water solution (Makhteshim, Israel) were used without further purification. Anti-foaming agent Contraspum 1012 was obtained from Zschimmer & Schwarz, Germany. Aqueous solutions were prepared using deionized (DI) water (Ionex purification system, PuriTech, Belgium).
Synthesis of Ag nanocrystals
52.5 g of AgNO3 and 35 g of PVP were dissolved in 600 ml of DI water (solution 1). Five drops of anti-foaming agent were added into solution 1, and 19 g of KOH were dissolved in 100 ml of water (solution 2). Solution 2 was poured into solution 1 under intensive stirring, forming a colloidal precipitate of Ag2O. Then, 180 ml of H2O2 were added at ∼10 ml min−1 under intensive stirring directly into the reaction mixture, to reduce the silver oxide to silver. During the addition of H2O2, the exothermic reaction resulted in a temperature increase from 25 °C to 60–65 °C. The reaction mixture was stirred for an additional 10 minutes and then transferred to a membrane separation system for purification (ceramic hollow fiber cross-flow membrane, 100 nm pore size). The resulting water dispersion was concentrated to ∼60 g solution contained about 30 g of Ag nanocrystals (∼90% yield based on AgNO3).Batches for elucidating the reaction mechanism
Characterization
The structure of the NPs was investigated using transmission electron microscopy (TEM): JEOL 1400 at 120 kV. High resolution scanning electron microscopy (HRSEM) images were collected on a FEI Magellan equipped with an energy-dispersive X-ray (Oxford 80 mm2) spectroscopy (EDS) attachment. EDS was typically collected on images with an area of 25 μm2 to provide a statistical analysis on different regions and a reliable composition. The crystalline phases and crystallinity of the prepared powders of intermediate and final products were examined by XRD using Cu Kα (0.1541 nm) radiation (Bruker Advance D8).Printing of the conductive line was achieved with an air pressure dispenser on a custom CNC equipped with a heated stage between 60–80 °C with a jog velocity of 500–1000 mm min−1 and pressure between 0.7–2.5 psi.
Conflicts of interest
There are no conflicts to declare.References
- X. Xia, J. Zeng, Q. Zhang, C. H. Moran and Y. Xia, J. Phys. Chem. C, 2012, 116, 21647–21656 CAS.
- T. Zhang, Y. J. Song, X. Y. Zhang and J. Y. Wu, Sensors, 2014, 14, 5860–5889 CrossRef PubMed.
- Y. Wang, D. Wan, S. Xie, X. Xia, C. Z. Huang and Y. Xia, ACS Nano, 2013, 7, 4586–4594 CrossRef CAS PubMed.
- M. Cortie, Chem. Rev., 2011, 111, 3713–3735 CrossRef CAS PubMed.
- J. Perelaer, P. J. Smith, D. Mager, D. Soltman, S. K. Volkman, V. Subramanian, J. G. Korvink and U. S. Schubert, J. Mater. Chem., 2010, 20, 8446 RSC.
- Z. Zhang, X. Zhang, Z. Xin, M. Deng, Y. Wen and Y. Song, Nanotechnology, 2011, 22, 425601 CrossRef PubMed.
- Y. Sun, Chem. Soc. Rev., 2013, 42, 2497–2511 RSC.
- R. Ma, C. Levard, S. M. Marinakos, Y. Cheng, J. Liu, F. M. Michel, G. E. Brown and G. V. Lowry, Environ. Sci. Technol., 2012, 46, 752–759 CrossRef CAS PubMed.
- Q. Zhang, N. Li, J. Goebl, Z. Lu and Y. Yin, J. Am. Chem. Soc., 2011, 133, 18931–18939 CrossRef CAS PubMed.
- Y. Qin, X. Ji, J. Jing, H. Liu, H. Wu and W. Yang, Colloids Surf., A, 2010, 372, 172–176 CrossRef CAS.
- Y. Cao, R. Zheng, X. Ji, H. Liu, R. Xie and W. Yang, Langmuir, 2014, 30, 3876–3882 CrossRef CAS PubMed.
- B. Wiley, T. Herricks, Y. Sun and Y. Xia, Nano Lett., 2004, 4, 1733–1739 CrossRef CAS.
- D. Chen and L. Gao, J. Cryst. Growth, 2004, 264, 216–222 CrossRef CAS.
- Y. Xia, X. Xia, Y. Wang and S. Xie, MRS Bull., 2013, 38, 335–344 CrossRef CAS.
- Y. Wang, Y. Zheng, C. Z. Huang and Y. Xia, J. Am. Chem. Soc., 2013, 135, 1941–1951 CrossRef CAS PubMed.
- B. J. Murray, Q. Li, J. T. Newberg, E. J. Menke, J. C. Hemminger and R. M. Penner, Nano Lett., 2005, 5, 2319–2324 CrossRef CAS PubMed.
- G. Wang, X. Ma, B. Huang, H. Cheng, Z. Wang, J. Zhan, X. Qin, X. Zhang and Y. Dai, J. Mater. Chem., 2012, 22, 21189 RSC.
- J. Jo, S. P. Cho and J. K. Lim, J. Colloid Interface Sci., 2015, 448, 208–214 CrossRef CAS PubMed.
- Z. Yang, L. Zhang, H. You, Z. Li and J. Fang, Part. Part. Syst. Charact., 2014, 31, 390–397 CrossRef CAS.
- P. Yang, Y. Zhang and B. Huang, Mater. Res. Bull., 2013, 48, 3756–3760 CrossRef CAS.
- J. Fang, S. Liu and Z. Li, Biomaterials, 2011, 32, 4877–4884 CrossRef CAS PubMed.
- S. Klosky and L. Woo, J. Phys. Chem., 1926, 30, 1930–1931 Search PubMed.
- G. Schimo, A. M. Kreuzer and A. W. Hassel, Phys. Status Solidi A, 2015, 212, 1202–1209 CrossRef CAS.
- Y. Xia, Y. Xiong, B. Lim and S. E. Skrabalak, Angew. Chem., Int. Ed., 2009, 48, 60–103 CrossRef CAS PubMed.
- W. M. Schuette and W. E. Buhro, ACS Nano, 2013, 7, 3844–3853 CrossRef CAS PubMed.
- R. Long, S. Zhou, B. J. Wiley and Y. Xiong, Chem. Soc. Rev., 2014, 43, 6288 RSC.
- Y. Zheng, J. Zeng, A. Ruditskiy, M. Liu and Y. Xia, Chem. Mater., 2014, 26, 22–33 CrossRef CAS.
- F. Wu, W. Wang, Z. Xu and F. Li, Sci. Rep., 2015, 5, 10772 CrossRef PubMed.
- R. Gottesman, A. Tangy, I. Oussadon and D. Zitoun, New J. Chem., 2012, 36, 2456 RSC.
| This journal is © The Royal Society of Chemistry 2017 |

