 Open Access Article
Effect of carbon nanotubes on morphology evolution of polypropylene/polystyrene blends: understanding molecular interactions and carbon nanotube migration mechanisms†
Ivonne Otero Navas,
Mohammad Arjmand and
Uttandaraman Sundararaj *
*
Department of Chemical and Petroleum Engineering, University of Calgary, Calgary, Alberta, Canada T2N 1N4. E-mail: u.sundararaj@ucalgary.ca
First published on 27th November 2017
Abstract
This study investigates the morphological evolution in polypropylene:polystyrene (PP:PS) blends (PP:PS—10![[thin space (1/6-em)]](https://www.rsc.org/images/entities/char_2009.gif) :
:![[thin space (1/6-em)]](https://www.rsc.org/images/entities/char_2009.gif) 90, 30
90, 30![[thin space (1/6-em)]](https://www.rsc.org/images/entities/char_2009.gif) :
:![[thin space (1/6-em)]](https://www.rsc.org/images/entities/char_2009.gif) 70, 50
70, 50![[thin space (1/6-em)]](https://www.rsc.org/images/entities/char_2009.gif) :
:![[thin space (1/6-em)]](https://www.rsc.org/images/entities/char_2009.gif) 50, 70
50, 70![[thin space (1/6-em)]](https://www.rsc.org/images/entities/char_2009.gif) :
:![[thin space (1/6-em)]](https://www.rsc.org/images/entities/char_2009.gif) 30 and 90
30 and 90![[thin space (1/6-em)]](https://www.rsc.org/images/entities/char_2009.gif) :
:![[thin space (1/6-em)]](https://www.rsc.org/images/entities/char_2009.gif) 10 vol%) with 1.0 vol% multi-walled carbon nanotube (MWCNT) loading over the course of melt mixing. Molecular simulation was used to predict the preferential localization of MWCNT in the biphasic blends. The simulation results indicated that the strongly polarized regions in the PS segments have much more interaction with the MWCNT surface in comparison to the weakly polarized PP chains. Transmission electron microscopy showed that MWCNTs are preferentially localized in the PS phase and interphase, regardless of the blend composition, in line with the molecular simulation predictions. Scanning electron microscopy revealed that addition of MWCNT led to significant morphological changes in all PP:PS compositions. When MWCNTs were localized in PS as the minor phase, increasing mixing time enlarged the domain size and enhanced domain interconnectivity in some regions of the samples. We proposed that the migration of MWCNT between the phases played a key role in the morphological changes in the blend nanocomposites. If migration of MWCNT happens among PS domains, then a layer of PS covering the surface of MWCNTs or a PS thread holding MWCNTs facilitates the contact among the domains, hence favouring coalescence.
10 vol%) with 1.0 vol% multi-walled carbon nanotube (MWCNT) loading over the course of melt mixing. Molecular simulation was used to predict the preferential localization of MWCNT in the biphasic blends. The simulation results indicated that the strongly polarized regions in the PS segments have much more interaction with the MWCNT surface in comparison to the weakly polarized PP chains. Transmission electron microscopy showed that MWCNTs are preferentially localized in the PS phase and interphase, regardless of the blend composition, in line with the molecular simulation predictions. Scanning electron microscopy revealed that addition of MWCNT led to significant morphological changes in all PP:PS compositions. When MWCNTs were localized in PS as the minor phase, increasing mixing time enlarged the domain size and enhanced domain interconnectivity in some regions of the samples. We proposed that the migration of MWCNT between the phases played a key role in the morphological changes in the blend nanocomposites. If migration of MWCNT happens among PS domains, then a layer of PS covering the surface of MWCNTs or a PS thread holding MWCNTs facilitates the contact among the domains, hence favouring coalescence.
1. Introduction
The ability to combine two or more polymers with different properties offers the possibility to develop a final material with properties superior to its components.1–3 Most polymers are thermodynamically immiscible and their binary mixtures are phase separated. Phase separation results in unique morphologies, significantly impacting the final properties of the blend systems.4,5 The inclusion of nanofillers, such as carbon nanotubes, clay, graphene, carbon black and nanosilica, to polymer blends has gained an increasing popularity, mainly because of the value-added properties of the blend nanocomposites compared to the neat blends.6–8Addition of nanofillers to immiscible polymer blends may cause morphological changes, affecting the final properties of the material. In the literature of the blend nanocomposites, there is no consensus about the effect of nanofillers on the blend morphology.9–15 One of the most cited effects of nanofillers in the polymer blends is the morphology refinement.9–13,16–18 This effect is attributed to various factors such as nanofiller interfacial localization, where the nanofillers act as physical barriers between the domains, thereby impeding the droplet coalescence,9,10 and/or decrease in the interfacial tension in comparison to the neat blends.16,18,19 The decrease of interfacial tension has been inferred from direct or indirect measurements, such as traditional continuum thermodynamics concepts, rheological calculations, theoretical calculations, and inferences from morphological refinements.9,18–20
Ray et al.19 inspected the effect of clay on the morphology of polypropylene (PP)/polystyrene (PS) blends. Clay nanofillers led to a compatibilization effect, described by the decrease of interfacial tension. The interfacial tension was measured by the drop deformation and relaxation technique. However, the disadvantage of this technique is that the genuine effect of the interfacial tension cannot be differentiated from the viscosity effect derived from the addition of clay to the polymer blend. In another study, theoretical calculations performed by Levine and Bowen21 showed that the adsorption of solid spherical particles at the interface of an immiscible oil–water system decreased the interfacial tension in comparison to the neat oil–water system. They also showed that the more separated the particles at the interface, the closer the value of the effective interfacial tension to the interfacial tension of the neat system. Nevertheless, this theoretical calculation does not take into account the nature of interactions in the system, as well as the viscoelastic effects, important in polymer blends. Other authors attributed the morphology refinement to changes in the interfacial rheology, where nanofillers restrict the interfacial mobility. Vandebril et al.22 found that when hematite particles are localized at the interface of a dispersed polydimethylsiloxane (PDMS)/polyisobutylene (PIB) blend, the interface exhibits an elastic behaviour, characteristic of agglomerated particles and particle network. In other studies, morphology refinement and coalescence suppression have been explained in terms of the long relaxation time and higher viscosity of the phase containing the nanofillers.23,24
Contrary to the works reporting the decrease of the domain size with addition of nanofillers, some other research studies have shown the ability of nanofillers to increase the domain size or induce coalescence and co-continuity in immiscible polymer blends.10,14,15 In some cases, the increase of domain size has been correlated to the selective localization of the nanofillers in the minor phase and the increase of the viscosity of this phase with respect to the major phase.10,25–27 Kong et al. noted that when nanosilica filled domains of polyamide 6 (PA6) are sheared inside a polystyrene (PS) matrix at high shear rates, there is a morphology refinement; however, when the PA6/nanosilica domains are subjected to low shear rate, coarsening of the domains is observed. This was attributed to the bridging effect of the nanosilica particles localized at the interface of the blends, and to the breakup suppression due to the increase of viscoelasticity and yield stress of the PA6/nanosilica domains. On the other hand, other authors have shown that network formation of the nanofillers in the immiscible polymer blends is responsible for the coarsening of the domains.28–30 For instance, Buxton et al.28 theoretically showed that the selective inclusion of nanorods in the minor phase results in stretching of the minor phase domains to accommodate the nanorods network. They claimed that the deformation and elongation of the minor phase domains increase the possibility of the domains coarsening.
Regarding carbon nanotube filled polymer blends, both decrease13,24,31–33 and increase11,15,24,33–37 of domain size have been reported. For instance, Khare et al.11 showed a relationship between MWCNT percolation and morphology evolution in polypropylene:acrylonitrile-butadiene-styrene (PP:ABS) blends. Below the MWCNT percolation threshold (1.0 wt%), an appreciable increase in minor phase size was observed. However, above the percolation threshold, the domain size progressively decreased with increasing MWCNT concentration. This was attributed to MWCNT network formation, impeding coalescence of the domains. Below the MWCNT percolation threshold, the authors observed a decrease of the torque when processing the filled blends in comparison to the neat ones, which might be related to the enhanced domain coalescence in the presence of MWCNT. On the other hand, in a previous work in our group,36 it was observed that the addition of MWCNT to immiscible PP:PS blends led to an increase of the domain size when MWCNTs were localized in PS as the minor phase. Morphological transition from a dispersed morphology to a more interconnected or co-continuous morphology was observed with the increase of MWCNT content. This transition was attributed to changes in viscosity and elasticity, as well as to the bridging effect of MWCNT between the PS domains. Recently, Urquijo et al.37 have also shown a domain size increase when MWCNTs were localized in PBAT as the minor phase in a blend of poly(lactic acid) (PLA)/PBAT. The migration of MWCNT from the PLA/MWCNT masterbatch to PBAT dynamically changed the viscosity of the blend during mixing, thus favoring the development of more interconnected morphologies.
Poyekar et al.35 observed that morphological transitions in MWCNT filled polyamide 6:acrylonitrile butadiene styrene copolymer blends (PA6:ABS) depend on the type of functionalization of MWCNT. They reported morphological transition over time from dispersed to co-continuous when unmodified MWCNTs were added to the blends 40![[thin space (1/6-em)]](https://www.rsc.org/images/entities/char_2009.gif) :
:![[thin space (1/6-em)]](https://www.rsc.org/images/entities/char_2009.gif) 60 wt% and 60
60 wt% and 60![[thin space (1/6-em)]](https://www.rsc.org/images/entities/char_2009.gif) :
:![[thin space (1/6-em)]](https://www.rsc.org/images/entities/char_2009.gif) 40 wt% PA6:ABS. This morphological transition was also observed when MWCNTs were functionalized with sodium salt of 6-amino hexanoic acid (Na-AHA). Formation of elongated phases happened at an earlier stage of mixing (1 min) in PA6:ABS with addition of Na-AHA-MWNCT than when it occurred in the case with unmodified MWCNT (5 min). On the other hand, when MWCNTs were modified with 1-pyrene-carboxaldehyde (PyCHO), the blend PA6:ABS/60
40 wt% PA6:ABS. This morphological transition was also observed when MWCNTs were functionalized with sodium salt of 6-amino hexanoic acid (Na-AHA). Formation of elongated phases happened at an earlier stage of mixing (1 min) in PA6:ABS with addition of Na-AHA-MWNCT than when it occurred in the case with unmodified MWCNT (5 min). On the other hand, when MWCNTs were modified with 1-pyrene-carboxaldehyde (PyCHO), the blend PA6:ABS/60![[thin space (1/6-em)]](https://www.rsc.org/images/entities/char_2009.gif) :
:![[thin space (1/6-em)]](https://www.rsc.org/images/entities/char_2009.gif) 40 transformed from a dispersed morphology to a co-continuous morphology, while the blend PA6:ABS/40
40 transformed from a dispersed morphology to a co-continuous morphology, while the blend PA6:ABS/40![[thin space (1/6-em)]](https://www.rsc.org/images/entities/char_2009.gif) :
:![[thin space (1/6-em)]](https://www.rsc.org/images/entities/char_2009.gif) 60 remained as dispersed morphology during the entire 15 min of mixing. Guo et al.24 showed that the aspect ratio of MWCNT affects the domain size in a blend of polystyrene:poly(methyl methacrylate). Localization of low aspect ratio MWCNT into the minor phase resulted in a decrease of domain size, and this was attributed to the increase of the viscosity of the minor phase, which slowed down the coalescence. However, increasing the MWCNT aspect ratio from 94 to 250–450 increased the domain size significantly, and was ascribed to the stretching of the minor phase to accommodate longer MWCNTs. On the other hand, other researchers have shown that the refinement of morphology upon addition of MWCNT is mainly related to the selective localization of MWCNT at the interface.13,32,38 Steric hindrance of the interface, due to the surrounding MWCNT layer, prevents coalescence of the domains, hence generating a decrease of the domain size. In spite of some research works showing morphology refinement upon addition of MWCNT, there is an abundance of literature showing that coalescence is enhanced when using high aspect ratio MWCNT localized in the disperse phase.
60 remained as dispersed morphology during the entire 15 min of mixing. Guo et al.24 showed that the aspect ratio of MWCNT affects the domain size in a blend of polystyrene:poly(methyl methacrylate). Localization of low aspect ratio MWCNT into the minor phase resulted in a decrease of domain size, and this was attributed to the increase of the viscosity of the minor phase, which slowed down the coalescence. However, increasing the MWCNT aspect ratio from 94 to 250–450 increased the domain size significantly, and was ascribed to the stretching of the minor phase to accommodate longer MWCNTs. On the other hand, other researchers have shown that the refinement of morphology upon addition of MWCNT is mainly related to the selective localization of MWCNT at the interface.13,32,38 Steric hindrance of the interface, due to the surrounding MWCNT layer, prevents coalescence of the domains, hence generating a decrease of the domain size. In spite of some research works showing morphology refinement upon addition of MWCNT, there is an abundance of literature showing that coalescence is enhanced when using high aspect ratio MWCNT localized in the disperse phase.
Although there is an uprising interest to develop polymer blends nanocomposites, the literature lacks a well-established understanding of the fundamental mechanisms involved in the nanofiller induced morphological changes. Accordingly, this work is dedicated to a comprehensive investigation of the effect of multi-walled carbon nanotube (MWCNT) on the morphology development of the immiscible polymer blend PP:PS over the course of melt mixing; this was performed employing various theoretical and experimental techniques. Molecular simulation was used to predict the MWCNT selective localization in the blend. TEM micrographs showed the selective localization of MWCNT inside PS. The morphology evolution during mixing was observed by freezing the morphology of the blend samples at different mixing times. Average domain size was estimated from SEM micrographs. We proposed that MWCNT migration between the phases contributes to the morphological changes observed upon addition of MWCNT. Different MWCNT migration regimes are discussed in this manuscript and correlated to the increase of coalescence observed in the blend systems with PS as the minor phase.
2. Experimental
2.1 Molecular simulation
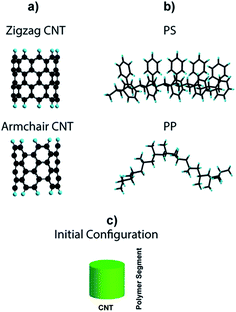
We performed molecular simulation to get an in-depth insight about the interaction of MWCNT with PP and PS chains. In this regard, the interactions between two different types of CNT with different chiralities but the same diameter (∼0.7 nm), i.e. (5,5) armchair-CNT and (9,0) zigzag-CNT (Fig. 1a) and segments of PP and PS (Fig. 1b) were studied. Each polymer segment is composed of 10 monomer units and the terminal carbon atoms in the CNT fragments were passivated using a single hydrogen atom to avoid boundary effects. The average initial distance between the polymer chain and CNT was set to 3 Å.Calculations were carried out using GAUSSIAN 09 software.39 Geometry optimization of CNT, polymer and polymer/CNT systems (based on a stationary point on the potential surface) was performed using the B3PW91 hybrid functional. This functional uses a combination of the Becke exchange,40 a Hartree–Fock component,41,42 and the correlation functional of Perdew–Wang.43,44 This functional has been successfully used by other researchers to evaluate nanostructured materials, such as graphene, nanotubes, and biological molecules like DNA.45–47 The basis set used to represent the electronic wave function corresponds to 6-31g(d,p),48,49 with added d polarization functions on non-hydrogen atoms plus p polarization functions for hydrogen. Empirical dispersion correction using the D3 version of Grimme coupled with Becke Johnson damping (empirical dispersion = GD3BJ) was also added for van der Waals interactions.50 Second derivative calculations of energy were performed to all optimized structures to verify that all the systems corresponded to local minima (zero imaginary frequencies). Binding energy, frontier orbitals and electrostatic potentials of the systems were studied to understand the interaction between CNT and PP and PS chains. The binding energy was defined as:
| ΔE = E(CNT) + E(polymer) − E(polymer/CNT) | (1) |
2.2 Materials
Homopolymer PP used in this study was H0500HN provided by Flint Hills Resources® (MW = 209.3 kg mol−1). PS, Styron® 615APR (MW = 193.3 kg mol−1), was obtained from Americas Styrenics LLC. MWCNT, Nanocyl™ NC 7000, was purchased from Nanocyl S.A. (Sambreville, Belgium), and has an average length of 1.5 μm and average diameter of 9.5 nm. Five blend systems of PP:PS–PP:PS/90![[thin space (1/6-em)]](https://www.rsc.org/images/entities/char_2009.gif) :
:![[thin space (1/6-em)]](https://www.rsc.org/images/entities/char_2009.gif) 10 vol%, PP:PS/70
10 vol%, PP:PS/70![[thin space (1/6-em)]](https://www.rsc.org/images/entities/char_2009.gif) :
:![[thin space (1/6-em)]](https://www.rsc.org/images/entities/char_2009.gif) 30 vol%, PP:PS/50
30 vol%, PP:PS/50![[thin space (1/6-em)]](https://www.rsc.org/images/entities/char_2009.gif) :
:![[thin space (1/6-em)]](https://www.rsc.org/images/entities/char_2009.gif) 50 vol%, PP:PS/30
50 vol%, PP:PS/30![[thin space (1/6-em)]](https://www.rsc.org/images/entities/char_2009.gif) :
:![[thin space (1/6-em)]](https://www.rsc.org/images/entities/char_2009.gif) 70 vol% and PP:PS/10
70 vol% and PP:PS/10![[thin space (1/6-em)]](https://www.rsc.org/images/entities/char_2009.gif) :
:![[thin space (1/6-em)]](https://www.rsc.org/images/entities/char_2009.gif) 90 vol% neat and with 1.0 vol% MWCNT concentration were prepared by melt mixing in a Haake Rheomix series 600 OS internal batch mixer. Prior to mixing, the raw materials were dried in a vacuum oven at 60 °C overnight. Compounding was carried out at 50 rpm (average shear rate of 40 s−1, calculated using the approximation of two adjacent sets of concentric cylinders51) for 15 min at T = 200 °C. The mixing procedure comprised melt mixing of PP and PS for 3 min, followed by addition of MWCNT and mixing for another 15 min. The order of addition of materials was devised based on the process of filler side feeding in the extrusion process. This process has advantages, such as decrease in filler breakage52 and elimination of premixing and pre-blending costs.53
90 vol% neat and with 1.0 vol% MWCNT concentration were prepared by melt mixing in a Haake Rheomix series 600 OS internal batch mixer. Prior to mixing, the raw materials were dried in a vacuum oven at 60 °C overnight. Compounding was carried out at 50 rpm (average shear rate of 40 s−1, calculated using the approximation of two adjacent sets of concentric cylinders51) for 15 min at T = 200 °C. The mixing procedure comprised melt mixing of PP and PS for 3 min, followed by addition of MWCNT and mixing for another 15 min. The order of addition of materials was devised based on the process of filler side feeding in the extrusion process. This process has advantages, such as decrease in filler breakage52 and elimination of premixing and pre-blending costs.53
2.3 Materials characterization
Scanning electron microscopy (SEM) was used to study the morphological evolution of the 5 blend systems by addition of 1.0 vol% MWCNT. Mixing times of 0.5, 1, 3, 3.5, 4, 6, 8, 13 and 18 min were selected for the study. After mixing for the required time, samples were taken from the indents on the roller blades and immediately frozen in liquid nitrogen. To obtain a better contrast in SEM imaging, PS was etched using tetrahydrofuran (THF) at room temperature.Samples that maintained structural integrity after etching (i.e. remained as a solid chunk) were cryo-fractured in liquid nitrogen. Whereas, for samples that lost their solid structure, 3 μl of the suspensions was placed on a cover-glass, and then mounted on the top of an SEM stub. In both cases, the solvent was evaporated at ambient temperature. The final morphologies were imaged using an FEI XL30 (FEI Hillsboro OR, USA) SEM setup at an acceleration voltage of 20 kV.
The average domain size of the minor phase of the neat blends at 3 min and 18 min, and blends with MWCNT at 3.5 min and 18 min of mixing was determined from the SEM images using the software Stream Motion (Olympus). 3.5 min corresponds to the elapsed time after addition of MWCNT into the neat blend. The domain size represents the average Feret diameter of the PS domains of three different micrographs per sample. Mean value and standard deviation were determined for each blend sample by using a lognormal distribution to evaluate the heterogeneity of the morphology.
TEM analysis was carried out to study MWCNT preferential localization. Sample sections of ca. 90 nm were obtained using a Leica EM UC6 ultramicrotome (Leica Biosystems©, Germany) equipped with a diamond knife. The ultramicrotoming was carried out in nitrogen atmosphere (−50 °C to −70 °C). The sections were analyzed with a Tecnai TF20 G2 FEG-TEM (FEI, Hillsboro, Oregon, USA) setup at 200 kV acceleration voltage. The images were captured by a Gatan UltraScan 4000 CCD (Gatan, Pleasanton, California, USA) at 2048 × 2048 pixels.
The shear viscosity for the neat PP, neat PS, neat blends and PS/MWCNT systems was measured using a Kayeness (Dynisco) capillary rheometer (Morgantown, PA), Model LCR600 D8052M-115 2046 WVS in the range of 0–100 s−1. The melt polymer sample was extruded through a 0.508 mm (L/D = 20) die (entrance angle: 120°) at 200 °C. Measurements were taken by a load cell. The results were sent to the KARS software, where Weissemberg-Rabinowitsch correction54 was performed for each data set.
3. Results and discussion
3.1 Simulation results
The optimized geometries of CNT, PP, PS, PP/CNT and PS/CNT systems are illustrated in Fig. S1.† Armchair-CNT (5,5) and zigzag-CNT (9,0) have average diameters of 6.8 Å and 7.0 Å, respectively. The interaction between CNT and the polymers was evaluated by the level of binding energy. If the interaction is favourable as per eqn (1), a positive binding energy is obtained. Table 1 summarizes the ground state energy, energetic values of HOMO (Highest Occupied Molecular Orbital) and LUMO (Lowest Unoccupied Molecular Orbital), band gap, binding energy and number of imaginary frequencies for the studied systems.| System | Energy (Ha) | HOMO (eV) | LUMO (eV) | Band gap (eV) | Binding energy ΔE (kcal mol−1) | Number of imaginary frequencies [v (cm−1)] |
|---|---|---|---|---|---|---|
| PP | −1219.71189 | −7.268 | 2.352 | 9.619 | — | 0 |
| PS | −3097.35697 | −6.069 | −0.103 | 5.966 | — | 0 |
| Armchair-CNT | −2297.92785 | −4.264 | −2.737 | 1.527 | — | 0 |
| Zigzag-CNT | −2753.82846 | −3.842 | −3.439 | 0.403 | — | 0 |
| PP/armchair-CNT | −3517.68197 | −4.329 | −2.812 | 1.517 | 26.60 | 0 |
| PP/zigzag-CNT | −3973.58526 | −3.961 | −3.568 | 0.393 | 28.29 | 0 |
| PS/armchair-CNT | −5395.33344 | −4.378 | −2.844 | 1.534 | 30.63 | 0 |
| PS/zigzag-CNT | −5851.23724 | −3.951 | −3.562 | 0.389 | 32.64 | 0 |
PS/CNT interactions in both armchair-CNT and zigzag-CNT provide a more stable configuration (higher binding energy) in comparison to PP/CNT (Fig. S1e–h†). In PS/CNT, interactions between CNT and side phenyl groups are mainly due to the carbon atoms of CNT and the hydrogen atoms of the phenyl group, where after the system optimization, the average distance between CNT and the hydrogen atoms of PS chain was 2.5–3.0 Å. The interactions between CNTs and the polymer chains result in charge transfer between them; this affects properties such as electrical behaviour of CNTs. The charge transfer may be driven by the realignment of the chemical potentials between CNT and polymer chain.55
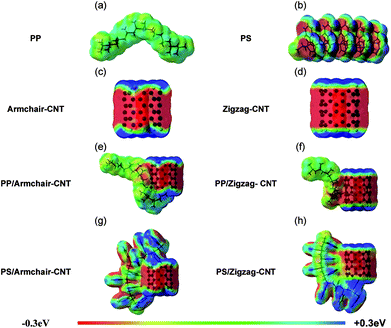
The molecular electrostatic potential (MEP) maps in Fig. 2 clearly illustrate the charge distribution of the molecules in three dimensions.56 MEPs help understand how the molecules interact with each other, and are represented by rainbow coloured surfaces. Each colour corresponds to a potential value, i.e. red and dark blue signify the most negative and the most positive potentials, respectively.57 In Fig. 2a, PP shows areas mainly coloured green and light blue, indicating absence of strongly polarized regions. In the case of PS (Fig. 2b), strongly polarized regions are observed, i.e., negative potential areas are observed above and below the aromatic rings, due to the delocalized nature of the electron density of the phenyl side group. In the case of CNTs, both types (Fig. 2c and d) have an electronegative area in the middle section. This area shifts towards electro-positivity at the edges of CNTs, due to the hydrogen passivation. The electronegative middle section of CNTs can interact with positive areas in an adjacent molecule, while the positive edges are prone to interact with the electronegative zones.
The interactions in PP/CNT system in both configurations are mainly driven by the attraction of the electronegative areas on CNT surface (Fig. 2c and d) and weakly polarized hydrogen atoms (electropositive areas) of PP (Fig. 2a). In the case of PS/CNT systems, the edge of the phenyl side groups of the PS chain (Fig. 2b), having positive potential mainly located on the hydrogen atoms, interacts favourably with the CNT surface, having negative potential (Fig. 2c and d). This type of geometrical arrangement between two aromatic groups is known as T-shaped or edge-to-face geometries,58 and is the most energetically favourable geometry due to high binding energy. This result confirms better interaction in PS/CNT than PP/CNT system.
The MEP maps of the PP/CNT and PS/CNT systems in Fig. 2e–h display overlapping of the electron clouds of the polymer chains and CNTs, thus allowing charge transferability. If CNT is considered to have hole carriers, charge transfer from CNT to polymer would improve the carrier concentration in CNT, thus improving the electrical transport.59 When a covalent interaction or strong chemical bonding between a molecule and a CNT happens, the properties of the CNT are strongly modified.60,61 Table 1 shows slight changes in the band gap of CNTs upon interaction with PP or PS, indicating small portion of charge transfer, and thus weak interaction between CNT and polymer chains. The interaction strength decreases with increasing temperature;62,63 thus, the polymer chain mobility on the surface of the CNT is not restricted by any strong bonding during mixing.
3.2 MWCNT localization
TEM micrographs of MWCNT-filled PP and PS are shown in Fig. 3a and b, respectively. TEM micrographs depict better MWCNT dispersion in PS in comparison to PP. As mentioned in the previous section, the molecular simulation results also revealed that the interactions of the H atoms in the PS chain and the surface of CNT are stronger than PP/CNT interactions; thus, we would expect better interaction of PS chains towards CNT (Fig. 2). Better dispersion state of MWCNT in PS (Fig. 3a) compared to PP (Fig. 3b) can endorse preferential localization of MWCNT in PS phase in the blend systems. The proportion of the phases in the blends was used to discern the phases. Fig. 3 illustrates that for the polymer blends, MWCNTs are mainly localized inside PS and some MWCNTs are localized at the interphase, regardless of the PP/PS ratio of the blend system (Fig. 3c–h).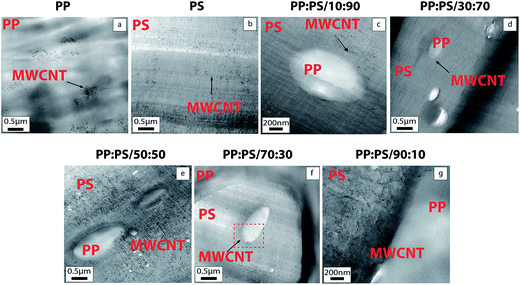 | ||
Fig. 3 TEM images of 1.0 vol% MWCNT filled PP, PS and PP/PS blends. Complementary TEM images of 1.0 vol% MWCNT filled blends PP:PS/30![[thin space (1/6-em)]](https://www.rsc.org/images/entities/char_2009.gif) : :![[thin space (1/6-em)]](https://www.rsc.org/images/entities/char_2009.gif) 70, PP:PS/50 70, PP:PS/50![[thin space (1/6-em)]](https://www.rsc.org/images/entities/char_2009.gif) : :![[thin space (1/6-em)]](https://www.rsc.org/images/entities/char_2009.gif) 50 and PP:PS/70 50 and PP:PS/70![[thin space (1/6-em)]](https://www.rsc.org/images/entities/char_2009.gif) : :![[thin space (1/6-em)]](https://www.rsc.org/images/entities/char_2009.gif) 30 are found in Fig. S2.† 30 are found in Fig. S2.† | ||
As PP and PS were first blended and then MWCNTs were added to the system, MWCNTs were initially in contact with both PP and PS phases. Hence, particle migration between the phases did happen during the melt mixing. The migration process of spherical rigid particles without preferential affinity in a two-phase viscoelastic shear flow has been theoretically studied by Jaensson,64 where he showed that migration of the spherical particles can be induced by differences in normal stresses due to dissimilarities in viscoelastic properties between the two phases. Accordingly, he introduced four regimes of particle migration:
• The first regime corresponds to particles migration far from the interphase, where particles are kept inside one of the phases. In this case, the deformation of the interphase causes an increase of Laplace pressure (pressure difference between the droplet and continuous phase), pushing the particles further inside one of the phases.
• The second regime correlates to particle migration to the interphase, but migration is ceased by interfacial tension. In this case, the particles approach the interphase, causing interphase deformation and increase in Laplace pressure. In this regime, the particles cannot cross the interphase.
• The third regime relates to the migration of particles, particularly small ones, from one phase to the other. This regime happens at higher capillary numbers than the second regime.
• The fourth regime describes the adsorption of the spherical rigid particles at the interphase. In this regime, the interfacial tension is low enough allowing the particle to reach the interphase and high enough to keep the particle at the interphase. To obtain a steady position for a particle at the interphase, the pulling action of the interfacial tension is balanced by the gradient of normal stresses. The adsorption at the interphase was only observed when the spherical rigid particles size was less than 125 nm in diameter.
In this work, the first and second regimes could correspond to the case where MWCNTs are already in PS phase and the interfacial deformation will contribute to keep MWCNTs in PS phase. Experimentally, it has been shown that the presence of MWCNT in polymeric matrices causes a decrease in negative normal stress differences.65 The unusual negative N1 behaviour is attributed to the vorticity banding of MWCNT aggregates, MWCNT network and nanotube deformation under shear rate.65,66 Thus, the more MWCNTs are localized in the preferred PS phase, the more considerable the imbalance of normal stress differences, favouring the migration of MWCNTs to PS phase. On the other hand, the favourable PS/MWCNT interactions, as discussed in Section 3.1, and the lower viscosity of PS phase (ηPS = 597 Pa s versus ηPP = 717 Pa s at 40 s−1, Fig. S3†) will favour wetting of MWCNT by PS chains.
If during mixing, MWCNTs were in contact with PP, regime 3 would dominate and MWCNTs would migrate towards PS phase. Regarding the fourth regime and localization of some MWCNTs at the interphase of PP:PS blend, we consider that the interphase becomes weaker as MWCNT pierces through it, and the localization of fillers at the interphase is driven by the different interaction forces, as observed in Fig. 4a. That is, better interaction between PS and MWCNT pulls the MWCNT into the PS phase and the poor interaction between PP and MWCNT repels the MWCNT towards the PS phase, and this combined effect facilitates the migration of MWCNTs to the PS phase.
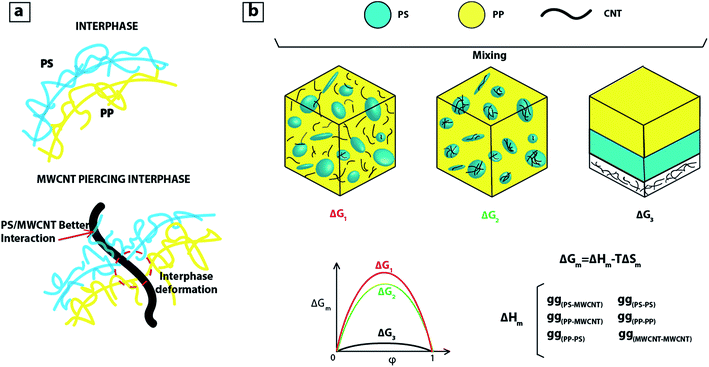 | ||
| Fig. 4 (a) Schematic of blend interphase without and with MWCNT; (b) schematic of PP:PS/MWCNT blends and change of Gibbs free energy. | ||
As MWCNT prefers to locate in PS, we can infer that there is a lower change of Gibbs free energy of mixing (ΔGm) for the case when MWCNT localizes in PS (see Fig. 4b). This is due to the lower energy penalty for PS–MWCNT contacts or interaction (gPS–MWCNT) than PP–MWCNT contacts (gPP–MWCNT). Thus, the system prefers to be in a state where MWCNT is localized in PS. The most energetically favourable state for the system is the one with three separate layers: (Fig. 4b, ΔG3 on right). This may be achieved in the case of true thermodynamic equilibrium, but due to the viscosity of polymers and the mixing procedure, the PS and PP phases form droplet-like or co-continuous morphologies that are stable over decades or more. During mixing, the MWCNT has the chance to migrate from one phase to the other phase as new interphases are formed. So, as the interphase is created, if MWCNTs are near the interphase, they are repelled by PP molecules towards the PS phase, and PS phase pulls MWCNTs due to the preferential PS/MWCNT interactions.
3.3 Morphology development during mixing in internal batch mixer
![[thin space (1/6-em)]](https://www.rsc.org/images/entities/char_2009.gif) :
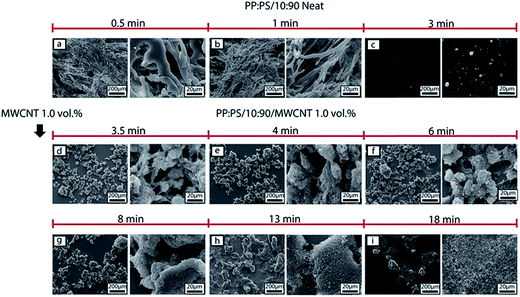
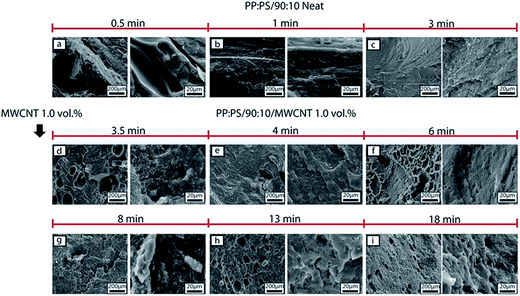
:![[thin space (1/6-em)]](https://www.rsc.org/images/entities/char_2009.gif) 90 (Fig. 5a–c), PP (minor phase) morphology evolved to droplets from the breakup of sheet structures, threads and ribbons, which is in accord with the literature.67–69 On the other hand, in the blend PP:PS/30
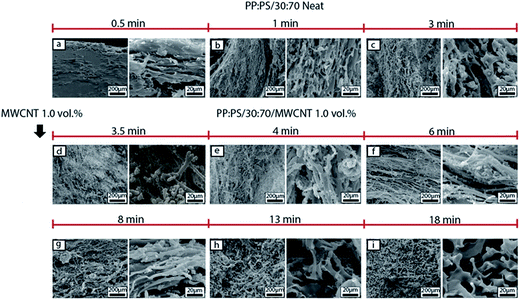
90 (Fig. 5a–c), PP (minor phase) morphology evolved to droplets from the breakup of sheet structures, threads and ribbons, which is in accord with the literature.67–69 On the other hand, in the blend PP:PS/30![[thin space (1/6-em)]](https://www.rsc.org/images/entities/char_2009.gif) :
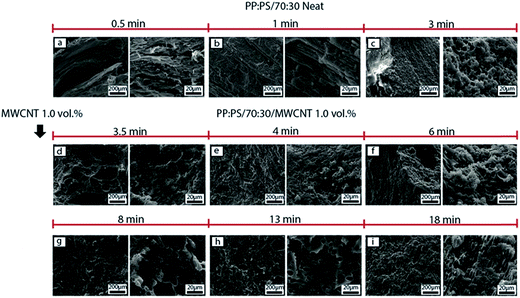
:![[thin space (1/6-em)]](https://www.rsc.org/images/entities/char_2009.gif) 70 (Fig. 6a–c), PP (minor phase) did not break up in droplets, instead formed a continuous phase, or major phase, as observed in Fig. 6c.
70 (Fig. 6a–c), PP (minor phase) did not break up in droplets, instead formed a continuous phase, or major phase, as observed in Fig. 6c.
Phase inversion phenomenon happens when the minor component becomes the continuous phase to minimize the free energy. Sundararaj et al.70 reported phase inversion during mixing when the minor component has a melting point lower than the major component in the systems of polyacrylate/rubber, polyamide 6,6/polystyrene, and polystyrene/ethylene propylene rubber. On the contrary, Ratnagiri and Scott71 showed that phase inversion is possible when the minor component has higher melting point than the major phase as in the case of polycaprolactone/polyethylene blends. In another study, Lazo and Scott72 showed that melting point is not the only parameter involved in phase inversion. They observed that in polymer blends of polystyrene:polyethylene (84![[thin space (1/6-em)]](https://www.rsc.org/images/entities/char_2009.gif) :
:![[thin space (1/6-em)]](https://www.rsc.org/images/entities/char_2009.gif) 16 vol%) or polycaprolactone:polyethylene (84
16 vol%) or polycaprolactone:polyethylene (84![[thin space (1/6-em)]](https://www.rsc.org/images/entities/char_2009.gif) :
:![[thin space (1/6-em)]](https://www.rsc.org/images/entities/char_2009.gif) 16 vol%), during isothermal steady shear flow at low strains, the thickness of the polyethylene (minor component) sheets formed during the flow must reach a critical value of 0.2–0.3 μm for phase inversion to occur.
16 vol%), during isothermal steady shear flow at low strains, the thickness of the polyethylene (minor component) sheets formed during the flow must reach a critical value of 0.2–0.3 μm for phase inversion to occur.
With the increase of PP content in the blend, PS phase becomes the minor phase, as observed in the blends PP:PS/50![[thin space (1/6-em)]](https://www.rsc.org/images/entities/char_2009.gif) :
:![[thin space (1/6-em)]](https://www.rsc.org/images/entities/char_2009.gif) 50, PP:PS/70
50, PP:PS/70![[thin space (1/6-em)]](https://www.rsc.org/images/entities/char_2009.gif) :
:![[thin space (1/6-em)]](https://www.rsc.org/images/entities/char_2009.gif) 30 and PP:PS/90
30 and PP:PS/90![[thin space (1/6-em)]](https://www.rsc.org/images/entities/char_2009.gif) :
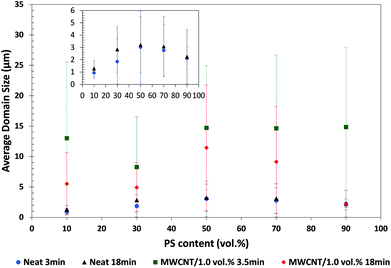
:![[thin space (1/6-em)]](https://www.rsc.org/images/entities/char_2009.gif) 10 (Fig. 7, 8 and 9, respectively). Addition of MWCNT to the blends caused a significant increase in domain size when PS is the minor phase, as quantified in Fig. 10. For instance, PP:PS/50
10 (Fig. 7, 8 and 9, respectively). Addition of MWCNT to the blends caused a significant increase in domain size when PS is the minor phase, as quantified in Fig. 10. For instance, PP:PS/50![[thin space (1/6-em)]](https://www.rsc.org/images/entities/char_2009.gif) :
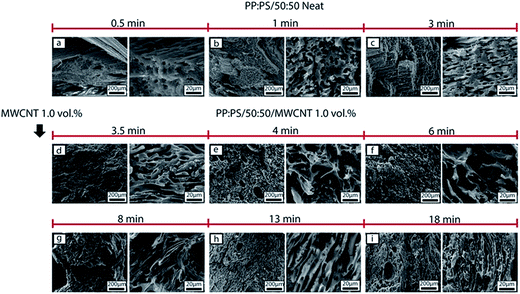
:![[thin space (1/6-em)]](https://www.rsc.org/images/entities/char_2009.gif) 50 blend shows an increase in average domain size from 3.0 ± 2.9 μm of the neat system at 3 min of mixing (Fig. 7c) to 14.7 ± 10.1 μm with addition of MWCNT at 3.5 min of mixing (Fig. 7d).
50 blend shows an increase in average domain size from 3.0 ± 2.9 μm of the neat system at 3 min of mixing (Fig. 7c) to 14.7 ± 10.1 μm with addition of MWCNT at 3.5 min of mixing (Fig. 7d).
The morphology development during mixing is also affected by the addition of MWCNT. In PP:PS/10![[thin space (1/6-em)]](https://www.rsc.org/images/entities/char_2009.gif) :
:![[thin space (1/6-em)]](https://www.rsc.org/images/entities/char_2009.gif) 90 blend, after addition of MWCNT (Fig. 5d), PP phase becomes interconnected and some spherical droplets are observed. With increasing mixing time, the interconnected domains break up into droplets (Fig. 5e–i). Although elongated domains were not visualized in the SEM images of PP:PS/10
90 blend, after addition of MWCNT (Fig. 5d), PP phase becomes interconnected and some spherical droplets are observed. With increasing mixing time, the interconnected domains break up into droplets (Fig. 5e–i). Although elongated domains were not visualized in the SEM images of PP:PS/10![[thin space (1/6-em)]](https://www.rsc.org/images/entities/char_2009.gif) :
:![[thin space (1/6-em)]](https://www.rsc.org/images/entities/char_2009.gif) 90, suggesting parallel or vorticity breakup of domains,73–75 other mechanisms such as erosion and tip streaming might be involved in the morphology development. Erosion and tip streaming have been observed in unfilled polymeric systems in simple shear flow and at viscosity ratios ranging 0.6–60.74,76 Additionally, we observed that addition of MWCNT improved the homogeneity of the droplets with increasing mixing time size in PP:PS/10
90, suggesting parallel or vorticity breakup of domains,73–75 other mechanisms such as erosion and tip streaming might be involved in the morphology development. Erosion and tip streaming have been observed in unfilled polymeric systems in simple shear flow and at viscosity ratios ranging 0.6–60.74,76 Additionally, we observed that addition of MWCNT improved the homogeneity of the droplets with increasing mixing time size in PP:PS/10![[thin space (1/6-em)]](https://www.rsc.org/images/entities/char_2009.gif) :
:![[thin space (1/6-em)]](https://www.rsc.org/images/entities/char_2009.gif) 90 (Fig. 5d–i). The PP droplets showed a progressive decrease of domain size with increasing mixing time after MWCNTs were added. At 3.5 min of mixing and upon addition of MWCNT, PP domain size has an average value of 14.8 ± 13.2 μm (Fig. 10), while at 18 min of mixing, the size decreased to 2.1 ± 0.41 μm (Fig. 10). Some research works have claimed that localization of nanofillers in the major phase in an immiscible polymer blend weakens the coalescence of the minor phase, due to (1) higher forces applied on the minor phase and (2) nanoparticles, acting as obstructions between the domains of minor phase.10,33,77
90 (Fig. 5d–i). The PP droplets showed a progressive decrease of domain size with increasing mixing time after MWCNTs were added. At 3.5 min of mixing and upon addition of MWCNT, PP domain size has an average value of 14.8 ± 13.2 μm (Fig. 10), while at 18 min of mixing, the size decreased to 2.1 ± 0.41 μm (Fig. 10). Some research works have claimed that localization of nanofillers in the major phase in an immiscible polymer blend weakens the coalescence of the minor phase, due to (1) higher forces applied on the minor phase and (2) nanoparticles, acting as obstructions between the domains of minor phase.10,33,77
In the case of PP:PS/30![[thin space (1/6-em)]](https://www.rsc.org/images/entities/char_2009.gif) :
:![[thin space (1/6-em)]](https://www.rsc.org/images/entities/char_2009.gif) 70, upon MWCNT addition (Fig. 6d), the continuous PP phase was transformed to a fibrillar or thread-like structure. In addition, some small PP particles of different shapes (spherical or elongated shapes) and sizes (1–15 μm major axis) were observed. These smaller domains are generated from the breakup of the cylindrical fibrils, which are unstable during mixing.78 The generated threads are more elongated and still visible in 4–8 min of mixing (Fig. 6e–g). Long thin ribbons and filaments have been reported for some neat polymer blends, where thread formation resulted from the high shear zones in the mixer.67,79 After 8 min of mixing (Fig. 6g–i), the PP fibrils coalesce, forming the major phase. This coalescence is favoured by randomly oriented and elongated PP domains, having more probability to be in contact and merge.
70, upon MWCNT addition (Fig. 6d), the continuous PP phase was transformed to a fibrillar or thread-like structure. In addition, some small PP particles of different shapes (spherical or elongated shapes) and sizes (1–15 μm major axis) were observed. These smaller domains are generated from the breakup of the cylindrical fibrils, which are unstable during mixing.78 The generated threads are more elongated and still visible in 4–8 min of mixing (Fig. 6e–g). Long thin ribbons and filaments have been reported for some neat polymer blends, where thread formation resulted from the high shear zones in the mixer.67,79 After 8 min of mixing (Fig. 6g–i), the PP fibrils coalesce, forming the major phase. This coalescence is favoured by randomly oriented and elongated PP domains, having more probability to be in contact and merge.
For the PP:PS/50![[thin space (1/6-em)]](https://www.rsc.org/images/entities/char_2009.gif) :
:![[thin space (1/6-em)]](https://www.rsc.org/images/entities/char_2009.gif) 50 blend, with addition of MWCNT (Fig. 7d–i), PS phase is greatly deformed and elongated. In 3.5–6 min of mixing (Fig. 7d–f), ellipsoidal inclusions of PS with bigger size (100–250 μm major axis) than other PS domains are observed. The inclusions correspond to MWCNT agglomerates (Fig. S4†), which are preferentially and rapidly localized in PS. At 3.5 min of mixing (Fig. 7i), PS domains increased in size in comparison to PS domains at 3 min of mixing and were significantly elongated, implying that the breakup processes were slowed down, or even halted, upon addition of MWCNT. In a previous study,36 we correlated the slowdown of breakup of PS/MWCNT domains to an increase in viscosity, elasticity and relaxation time of PS phase with increasing MWCNT content. On the other hand, the increase of PS domain size in presence of MWCNT endured during the whole 18 min of mixing process. PS domain size changed from 14.7 ± 10.1 μm at 3.5 min to 11.4 μm ± 10.2 μm at 18 min of mixing (Fig. 10). This decrease can be attributed to the breakup of MWCNT agglomerates located in PS phase, which diminish the contribution of bigger domains to the average domain size.
50 blend, with addition of MWCNT (Fig. 7d–i), PS phase is greatly deformed and elongated. In 3.5–6 min of mixing (Fig. 7d–f), ellipsoidal inclusions of PS with bigger size (100–250 μm major axis) than other PS domains are observed. The inclusions correspond to MWCNT agglomerates (Fig. S4†), which are preferentially and rapidly localized in PS. At 3.5 min of mixing (Fig. 7i), PS domains increased in size in comparison to PS domains at 3 min of mixing and were significantly elongated, implying that the breakup processes were slowed down, or even halted, upon addition of MWCNT. In a previous study,36 we correlated the slowdown of breakup of PS/MWCNT domains to an increase in viscosity, elasticity and relaxation time of PS phase with increasing MWCNT content. On the other hand, the increase of PS domain size in presence of MWCNT endured during the whole 18 min of mixing process. PS domain size changed from 14.7 ± 10.1 μm at 3.5 min to 11.4 μm ± 10.2 μm at 18 min of mixing (Fig. 10). This decrease can be attributed to the breakup of MWCNT agglomerates located in PS phase, which diminish the contribution of bigger domains to the average domain size.
Thareja et al.12 have shown that nanoparticles localized in the minor phase can induce coalescence in polymeric systems, where mechanisms of bridging–dewetting in defoaming processes were used to explain the phenomenon. In the defoaming process, hydrophobic particles are used to promote bubbles coalescence in aqueous systems.80,81 The bridging–dewetting mechanism implies that particles coming in contact with two bubbles form a bridge between them; if the particle is hydrophobic enough, it is dewetted by the aqueous phase and the bubbles fuse.80,81 On the other hand, Morris and Cilliers82 proposed that when particles are localized at the interface of bubbles, the coalescence is produced due to the highly distorted structure of the interface around the particle, which forces the interfaces of the bubbles to be drawn together. Although these theories describe the effect of particles localized at the interface in the coalescence of bubbles in liquids, the mechanisms in immiscible polymer blends are more complex, due to factors such as the viscoelastic nature of the system and the interfacial thickness (interphase) due to the chain diffusion and entanglement of both polymers in the blend.
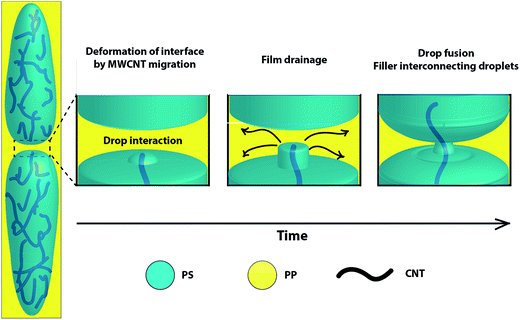
As described in Section 3.2, migration of particles between the phases may also play an important role in the morphology development. For instance, in the third regime described in the theoretical work of Jaensson,64 when particles cross the interphase, there is a time at which the particles are probably held by a thread of the fluid in which the particles were initially localized (Fluid 1). As time elapses, the threads pinch off, allowing the particles to be transferred to the other phase (Fluid 2), but still surrounded by a layer of the Fluid 1 and some smaller satellite droplets of the Fluid 1 may also be generated. Thus, considering higher affinity of MWCNT to PS and also MWCNT crossing the interphase, it can be speculated that when two PS domains approach, the MWCNTs crossing the interface serve as bridges between the PS domains. While MWCNT cross the interphase, the layer of PS covering the MWCNT or the thread holding them facilities the contact between the PS domains by enhancing the film drainage process, hence favouring the coalescence (Fig. 11). In addition, from the simulation results in Section 3.1, it can be said that the interaction between the MWCNT and PS is a weak bonding. Accordingly, we can infer that the mobility of PS chains is not significantly restricted on the MWCNT surface. Other simulation works have shown the ability of PS chains to move on the surface of CNTs, and how the PS mobility increases with increasing temperature.83 Then, while the PS domains approach and contact the MWCNT, the PS chains can move from one domain to the other.
On the other hand, for coalescence to happen, the rupture of the film between droplets must happen and it requires that the internal pressure of the domains exceeds the disjoining pressure of the continuous phase.84 Thus, the deformation of PS domains imparted by the shear flow and the deformation of PS/PP interphase caused by MWCNT migration between the phases increase the Laplace pressure. This increase in Laplace pressure may be enough to overcome the film drainage imparted by PP phase, and thus favour the coalescence of PS/MWCNT domains. In addition, the increase in Laplace pressure might be different among the droplets due to different MWCNT local concentrations during mixing, causing flow from one droplet to another until the pressure reaches equilibrium.85 On the other hand, the strong van der Waals forces present among MWCNTs can be another factor affecting coalescence. Thus, when MWCNTs approach and overcome the repulsive forces, they stick together, facilitating the motion of PS chains among them.
Addition of MWCNT to the blends with lower PS content (PP:PS/70![[thin space (1/6-em)]](https://www.rsc.org/images/entities/char_2009.gif) :
:![[thin space (1/6-em)]](https://www.rsc.org/images/entities/char_2009.gif) 30 and PP:PS/90
30 and PP:PS/90![[thin space (1/6-em)]](https://www.rsc.org/images/entities/char_2009.gif) :
:![[thin space (1/6-em)]](https://www.rsc.org/images/entities/char_2009.gif) 10) causes less deformation (Fig. 8 and 9, respectively) of PS phase than PP:PS/50
10) causes less deformation (Fig. 8 and 9, respectively) of PS phase than PP:PS/50![[thin space (1/6-em)]](https://www.rsc.org/images/entities/char_2009.gif) :
:![[thin space (1/6-em)]](https://www.rsc.org/images/entities/char_2009.gif) 50 blend (Fig. 7); this can be correlated to the higher local MWCNT concentration as the PS content in the blend decreases. The higher the amount of MWCNT, the higher the viscosity of the PS phase (Fig. S3†), and thus the higher the shear forces needed to deform the PS/MWCNT domains. In addition, both blends of PP:PS/70
50 blend (Fig. 7); this can be correlated to the higher local MWCNT concentration as the PS content in the blend decreases. The higher the amount of MWCNT, the higher the viscosity of the PS phase (Fig. S3†), and thus the higher the shear forces needed to deform the PS/MWCNT domains. In addition, both blends of PP:PS/70![[thin space (1/6-em)]](https://www.rsc.org/images/entities/char_2009.gif) :
:![[thin space (1/6-em)]](https://www.rsc.org/images/entities/char_2009.gif) 30 and PP:PS/90
30 and PP:PS/90![[thin space (1/6-em)]](https://www.rsc.org/images/entities/char_2009.gif) :
:![[thin space (1/6-em)]](https://www.rsc.org/images/entities/char_2009.gif) 10 at 3.5 min (Fig. 8d and 9d, respectively) depicted PS domains with MWCNT agglomerate inclusions with sizes ranging 100–500 μm major axis. Between 3.5–6 min, in both blends (Fig. 8d–f and 9d–f), some areas with PS domains having smaller domain sizes than the neat blend at 3 min of mixing are also observed. This might be correlated to (1) the content of the PS phase in the system and (2) less deformation caused by the decrease of local MWCNT concentration as PS content increases in the blend. The higher the PS content, the more the number of collisions between PS/MWCNT domains, and thus the higher the probability for coalescence.86
10 at 3.5 min (Fig. 8d and 9d, respectively) depicted PS domains with MWCNT agglomerate inclusions with sizes ranging 100–500 μm major axis. Between 3.5–6 min, in both blends (Fig. 8d–f and 9d–f), some areas with PS domains having smaller domain sizes than the neat blend at 3 min of mixing are also observed. This might be correlated to (1) the content of the PS phase in the system and (2) less deformation caused by the decrease of local MWCNT concentration as PS content increases in the blend. The higher the PS content, the more the number of collisions between PS/MWCNT domains, and thus the higher the probability for coalescence.86
In the literature on the neat polymer blends, it has been shown that most of the significant morphology development happens at the very early stages of mixing.67–70,73,87–91 Favis88 showed that extending the mixing time to 20 min for polypropylene:polycarbonate (PP:PC) inside a batch mixer did not generate further droplet size reduction. The results were the same in a wide range of torque/viscosity ratios of the polymer blend constituents. On the other hand, Sundararaj et al.67 found that the major morphological changes during blending in two different blends of PP:PS/80![[thin space (1/6-em)]](https://www.rsc.org/images/entities/char_2009.gif) :
:![[thin space (1/6-em)]](https://www.rsc.org/images/entities/char_2009.gif) 20 wt% and polystyrene:amorphous polyamide (PS
20 wt% and polystyrene:amorphous polyamide (PS![[thin space (1/6-em)]](https://www.rsc.org/images/entities/char_2009.gif) :
:![[thin space (1/6-em)]](https://www.rsc.org/images/entities/char_2009.gif) PA/80
PA/80![[thin space (1/6-em)]](https://www.rsc.org/images/entities/char_2009.gif) :
:![[thin space (1/6-em)]](https://www.rsc.org/images/entities/char_2009.gif) 20 wt%) in the batch mixer occurred within 1 min of mixing, and the morphology reached steady state after 2.5 min of mixing. Fig. S4† shows that the morphology of the neat PP:PS blends is not significantly affected at mixing times higher than 5 min. Quantification of the domain size of the neat blends at 3 min and 18 min of mixing in Fig. 4–10 corroborates the stability of domain size with increasing mixing time in neat PP:PS blends. However, we noticed that the morphological changes in the PP:PS blends upon the addition of MWCNT happen in a time frame (15 min after addition of MWCNT) much longer than for the neat polymer blends (∼3 min) (Fig. 5–10).
20 wt%) in the batch mixer occurred within 1 min of mixing, and the morphology reached steady state after 2.5 min of mixing. Fig. S4† shows that the morphology of the neat PP:PS blends is not significantly affected at mixing times higher than 5 min. Quantification of the domain size of the neat blends at 3 min and 18 min of mixing in Fig. 4–10 corroborates the stability of domain size with increasing mixing time in neat PP:PS blends. However, we noticed that the morphological changes in the PP:PS blends upon the addition of MWCNT happen in a time frame (15 min after addition of MWCNT) much longer than for the neat polymer blends (∼3 min) (Fig. 5–10).
4. Conclusions
The morphology evolution of neat PP:PS blends and their blend nanocomposites with 1.0 vol% MWCNT over the course of melt mixing was delineated in this work. We found molecular simulation a useful technique to predict the selective localization of MWCNT in the blend system. The simulation results showed that the interaction PS/CNT is more favourable than PP/CNT. The PS/CNT interaction was mediated by the attraction of highly positive hydrogen atoms in the phenyl side groups towards the negative electrostatic potential of the CNT surface. PP chain did have a weakly polarized structure, which caused a poor interaction with the CNT surface. TEM micrographs showed that MWCNTs were mainly localized inside PS and interphase, in agreement with the molecular simulation results. SEM images revealed that morphological changes of the polymer phases in the blend nanocomposites occurred in a time frame (15 min after addition of MWCNT), much longer than for the neat polymer blends (3.0 min of mixing). We propose that MWCNT migration among domains in conjunction with viscosity and elastic effects are important factors governing the morphological changes in the PP:PS blends nanocomposites. When two PS domains approach, they must overcome the film drainage to coalesce. Migration of MWCNT from one PS domain to another may facilitate coalescence as a PS layer covers the MWCNT surface and connects the two domains with a thin PS thread, and thus allows PS chain diffusion between the domains. Hence, MWCNTs covered by a PS layer serve as bridges to interconnect PS domains.Conflicts of interest
There are not conflicts of interest to declare.Acknowledgements
This research was supported by the Natural Sciences and Engineering Research Council of Canada (NSERC). The authors would like to acknowledge the Microscopy and Imaging Facility (MIF) at the University of Calgary for their great help with respect to TEM and SEM imaging. We are grateful to Ms Samaneh Dordani Haghighi for designing and drawing the graphical abstract.References
- A. Halimatudahliana, H. Ismail and M. Nasir, Polym. Test., 2002, 21, 263–267 CrossRef CAS.
- L. M. Robeson, Polymer Blends: A Comprehensive Review, Hanser, Munich, 2007, ch. 1, pp. 11–19 Search PubMed.
- L. A. Utracki, Commercial Polymer Blends, Springer Science & Business Media, Berlin, 2013 Search PubMed.
- Z. L. Zhang, H. D. Zhang, Y. L. Yang, I. Vinckier and H. M. Laun, Macromolecules, 2001, 34, 1416–1429 CrossRef CAS.
- P. Van Puyvelde and P. Moldenaers, Rheol. Rev., 2005, 101–145 CAS.
- G. Wu, X. Cai, X. Lin and H. Yui, React. Funct. Polym., 2010, 70, 732–737 CrossRef CAS.
- B. Chen and J. R. G. Evans, J. Polym. Sci., Part B: Polym. Phys., 2011, 49, 443–454 CrossRef CAS.
- S. Monemian, S. H. Jafari, H. A. Khonakdar, V. Goodarzi, U. Reuter and P. Pötschke, J. Appl. Polym. Sci., 2013, 130, 739–748 CrossRef CAS.
- L. Elias, F. Fenouillot, J. C. Majeste and P. Cassagnau, Polymer, 2007, 48, 6029–6040 CrossRef CAS.
- M. Kontopoulou, Y. Liu, J. R. Austin and J. S. Parent, Polymer, 2007, 48, 4520–4528 CrossRef CAS.
- R. A. Khare, A. R. Bhattacharyya, A. R. Kulkarni, M. Saroop and A. Biswas, J. Polym. Sci., Part B: Polym. Phys., 2008, 46, 2286–2295 CrossRef CAS.
- P. Thareja, K. Moritz and S. S. Velankar, Rheol. Acta, 2010, 49, 285–298 CrossRef CAS.
- A.-C. Baudouin, C. Bailly and J. Devaux, Polym. Degrad. Stab., 2010, 95, 389–398 CrossRef CAS.
- G. Wu, B. Li and J. Jiang, Polymer, 2010, 51, 2077–2083 CrossRef CAS.
- A. Nuzzo, E. Bilotti, T. Peijs, D. Acierno and G. Filippone, Polymer, 2014, 55, 4908–4919 CrossRef CAS.
- J. S. Hong, Y. K. Kim, K. H. Ahn, S. J. Lee and C. Kim, Rheol. Acta, 2007, 46, 469–478 CrossRef CAS.
- J. Vermant, S. Vandebril, C. Dewitte and P. Moldenaers, Rheol. Acta, 2008, 47, 835–839 CrossRef CAS.
- L. Elias, F. Fenouillot, J. C. Majeste, P. Alcouffe and P. Cassagnau, Polymer, 2008, 49, 4378–4385 CrossRef CAS.
- S. Sinha Ray, S. Pouliot, M. Bousmina and L. A. Utracki, Polymer, 2004, 45, 8403–8413 CrossRef.
- L. Sangroniz, M. A. Moncerrate, V. A. De Amicis, J. K. Palacios, M. Fernández, A. Santamaria, J. J. Sánchez, F. Laoutid, P. Dubois and A. J. Müller, J. Polym. Sci., Part B: Polym. Phys., 2015, 53, 1567–1579 CrossRef CAS.
- S. Levine and B. D. Bowen, Colloids Surf., A, 1993, 70, 33–45 CrossRef CAS.
- S. Vandebril, J. Vermant and P. Moldenaers, Soft Matter, 2010, 6, 3353–3362 RSC.
- S. Bose, C. Ozdilek, J. Levs, J. Seo, M. Wübbenhorst, J. Vermant and P. Moldenaers, ACS Appl. Mater. Interfaces, 2010, 2, 800–807 CAS.
- J. Guo, N. Briggs, S. Crossley and B. P. Grady, AIChE J., 2015, 61, 3500–3510 CrossRef CAS.
- J. S. Hong, H. Namkung, K. H. Ahn, S. J. Lee and C. Kim, Polymer, 2006, 47, 3967–3975 CrossRef CAS.
- R. Salehiyan, Y. Yoo, W. J. Choi and K. Hyun, Macromolecules, 2014, 47, 4066–4076 CrossRef CAS.
- G. Xu, S. Qin, J. Yu, Y. Huang, M. Zhang and W. Ruan, RSC Adv., 2015, 5, 29924–29930 RSC.
- G. A. Buxton and A. C. Balazs, Mol. Simul., 2004, 30, 249–257 CrossRef CAS.
- W. Tong, Y. Huang, C. Liu, X. Chen, Q. Yang and G. Li, Colloid Polym. Sci., 2010, 288, 753–760 CAS.
- H. Xiu, H. W. Bai, C. M. Huang, C. L. Xu, X. Y. Li and Q. Fu, eXPRESS Polym. Lett., 2012, 7, 261–271 CrossRef.
- A. C. Baudouin, J. Devaux and C. Bailly, Polymer, 2010, 51, 1341–1354 CrossRef CAS.
- F. Tao, D. Auhl, A.-C. Baudouin, F. J. Stadler and C. Bailly, Macromol. Chem. Phys., 2013, 214, 350–360 CrossRef CAS.
- S. P. Pawar and S. Bose, Phys. Chem. Chem. Phys., 2015, 17, 14470–14478 RSC.
- S. Bose, A. R. Bhattacharyya, R. A. Khare, S. S. Kamath and A. R. Kulkarni, Polym. Eng. Sci., 2011, 51, 1988–2002 Search PubMed.
- A. V. Poyekar, A. R. Bhattacharyya, A. S. Panwar and G. P. Simon, Polym. Eng. Sci., 2014, 429–442 Search PubMed.
- I. Otero-Navas, M. Arjmand and U. Sundararaj, Polymer, 2017, 114, 122–134 CrossRef CAS.
- J. Urquijo, N. Aranburu, S. Dagréou, G. Guerrica-Echevarría and J. I. Eguiazábal, Eur. Polym. J., 2017, 93, 545–555 CrossRef CAS.
- A.-C. Baudouin, J. Devaux and C. Bailly, Polymer, 2010, 51, 1341–1354 CrossRef CAS.
- M. J. Frisch, G. W. Trucks, H. B. Schlegel, G. E. Scuseria, M. A. Robb, J. R. Cheeseman, G. Scalmani, V. Barone, G. A. Petersson, H. Nakatsuji, X. Li, M. Caricato, A. Marenich, J. Bloino, B. G. Janesko, R. Gomperts, B. Mennucci, H. P. Hratchian, J. V. Ortiz, A. F. Izmaylov, J. L. Sonnenberg, D. Williams-Young, F. Ding, F. Lipparini, F. Egidi, J. Goings, B. Peng, A. Petrone, T. Henderson, D. Ranasinghe, V. G. Zakrzewski, J. Gao, N. Rega, G. Zheng, W. Liang, M. Hada, M. Ehara, K. Toyota, R. Fukuda, J. Hasegawa, M. Ishida, T. Nakajima, Y. Honda, O. Kitao, H. Nakai, T. Vreven, K. Throssell, J. A. Montgomery Jr, J. E. Peralta, F. Ogliaro, M. Bearpark, J. J. Heyd, E. Brothers, K. N. Kudin, V. N. Staroverov, T. Keith, R. Kobayashi, J. Normand, K. Raghavachari, A. Rendell, J. C. Burant, S. S. Iyengar, J. Tomasi, M. Cossi, J. M. Millam, M. Klene, C. Adamo, R. Cammi, J. W. Ochterski, R. L. Martin, K. Morokuma, O. Farkas, J. B. Foresman and D. J. Fox, Gaussian 09, Revision A.02, Inc., Wallingford CT, 2016 Search PubMed.
- A. D. Becke, J. Chem. Phys., 1993, 98, 5648–5652 CrossRef CAS.
- C. C. J. Roothaan, Rev. Mod. Phys., 1951, 23, 69–89 CrossRef CAS.
- J. A. Pople and R. K. Nesbet, J. Chem. Phys., 1954, 22, 571–572 CrossRef CAS.
- J. P. Perdew, Electronic Structure of Solids, ed. Z. H. Eschrig, Akademie Verlag, Berlin, 1991, pp. 11–20 Search PubMed.
- J. P. Perdew, K. Burke and Y. Wang, Phys. Rev. B, 1996, 54, 16533–16539 CrossRef CAS.
- N. L. Rangel and J. M. Seminario, J. Phys. B: At., Mol. Opt. Phys., 2010, 43, 115101 CrossRef.
- K. Bakhshi, F. Mollaamin and M. Monajjemi, J. Korean Chem. Soc., 2011, 55, 7–13 CrossRef CAS.
- I. Otero-Navas and J. M. Seminario, J. Mol. Model., 2012, 18, 91–101 CrossRef CAS PubMed.
- G. A. Petersson, A. Bennett, T. G. Tensfeldt, M. A. Al-Laham, W. A. Shirley and J. Mantzaris, J. Chem. Phys., 1988, 89, 2193–2218 CrossRef CAS.
- G. A. Petersson and M. A. Al-Laham, J. Chem. Phys., 1991, 94, 6081–6090 CrossRef CAS.
- S. Grimme, S. Ehrlich and L. Goerigk, J. Comput. Chem., 2011, 32, 1456–1465 CrossRef CAS PubMed.
- M. Bousmina, A. Ait-Kadi and J. B. Faisant, J. Rheol., 1999, 43, 415–433 CrossRef CAS.
- H. F. Giles, J. R. Wagner and E. M. Mount, Extrusion: The Definitive Processing Guide and Handbook, Elsevier Science & Technology Books, Amsterdam, 2013 Search PubMed.
- P. W. Dufton, Functional Additives for the Plastics Industry: Trends in Use, Rapra Technology Limited, Pennsylvania, 1998 Search PubMed.
- T. G. Mezger, The Rheology Handbook: For Users of Rotational and Oscillatory Rheometers, Vincentz Network, Hannover, 2006 Search PubMed.
- S. Peng and K. Cho, Nano Lett., 2003, 3, 513–517 CrossRef CAS.
- J. S. Murray and K. Sen, Molecular Electrostatic Potentials: Concepts and Applications, Elsevier Science & Technology Books, Amsterdam, 1996 Search PubMed.
- D. Oxtoby, H. Gillis and A. Campion, Principles of Modern Chemistry, Cengage Learning, Boston, 2011 Search PubMed.
- E. V. Anslyn and D. A. Dougherty, Modern Physical Organic Chemistry, Ingram Book Co, La Vergne, 2006 Search PubMed.
- H. Chang, J. D. Lee, S. M. Lee and Y. H. Lee, Appl. Phys. Lett., 2001, 79, 3863–3865 CrossRef CAS.
- J. Zhao, H. Park, J. Han and J. P. Lu, J. Phys. Chem. B, 2004, 108, 4227–4230 CrossRef CAS.
- F. Tournus and J. C. Charlier, Phys. Rev. B, 2005, 71, 165421 CrossRef.
- M. Yang, V. Koutsos and M. Zaiser, J. Phys. Chem. B, 2005, 109, 10009–10014 CrossRef CAS PubMed.
- Q. Zheng, Q. Xue, K. Yan, L. Hao, Q. Li and X. Gao, J. Phys. Chem. C, 2007, 111, 4628–4635 CAS.
- N. Jaensson, Modeling interfaces and particles in viscoelastic fluids, Eindhoven University of Technology, 2016 Search PubMed.
- S. B. Kharchenko, J. F. Douglas, J. Obrzut, E. A. Grulke and K. B. Migler, Nat. Mater., 2004, 3, 564–568 CrossRef CAS PubMed.
- J. Yang, Y. Zhang, Z. Wang and P. Chen, RSC Adv., 2014, 4, 1246–1255 RSC.
- U. Sundararaj, C. W. Macosko, R. J. Rolando and H. T. Chan, Polym. Eng. Sci., 1992, 32, 1814–1823 CAS.
- C. E. Scott and C. W. Macosko, Polymer, 1995, 36, 461–470 CrossRef CAS.
- U. Sundararaj, Y. Dori and C. W. Macosko, Polymer, 1995, 36, 1957–1968 CrossRef CAS.
- U. Sundararaj, C. W. Macosko and C. K. Shih, Polym. Eng. Sci., 1996, 36, 1769–1781 CAS.
- R. Ratnagiri and C. E. Scott, Polym. Eng. Sci., 1998, 38, 1751–1762 CAS.
- N. D. B. Lazo and C. E. Scott, Polymer, 2001, 42, 4219–4231 CrossRef CAS.
- B. Lin, F. Mighri, M. A. Huneault and U. Sundararaj, Macromol. Rapid Commun., 2003, 24, 783–788 CrossRef CAS.
- H. Chen, U. Sundararaj and K. Nandakumar, Polym. Eng. Sci., 2004, 44, 1258–1266 CAS.
- H. Li, Microstructure Development in Viscoelastic Fluid Systems, Chemical and Materials Engineering, University of Alberta, Edmonton, 2009 Search PubMed.
- B. Lin, U. Sundararaj, F. Mighri and M. A. Huneault, Polym. Eng. Sci., 2003, 43, 891–904 CAS.
- J. R. Austin and M. Kontopoulou, Polym. Eng. Sci., 2006, 46, 1491–1501 CAS.
- Y. M. M. Knops, J. J. M. Slot, P. H. M. Elemans and M. J. H. Bulters, AIChE J., 2001, 47, 1740–1745 CrossRef CAS.
- P. H. M. Elemans, H. L. Bos, J. M. H. Janssen and H. E. H. Meijer, Chem. Eng. Sci., 1993, 48, 267–276 CrossRef CAS.
- P. R. Garrett, J. Colloid Interface Sci., 1979, 69, 107–121 CrossRef CAS.
- P. R. Garrett, Curr. Opin. Colloid Interface Sci., 2015, 20, 81–91 CrossRef CAS.
- G. D. M. Morris and J. J. Cilliers, Int. J. Miner. Process., 2014, 131, 1–6 CrossRef CAS.
- S. S. Tallury and M. A. Pasquinelli, J. Phys. Chem. B, 2010, 114, 4122–4129 CrossRef CAS PubMed.
- T. Wu, H. Wang, B. Jing, F. Liu, P. C. Burns and C. Na, Nat. Commun., 2015, 6, 5929 CrossRef PubMed.
- E. Nowak, N. M. Kovalchuk, Z. Che and M. J. H. Simmons, Colloids Surf., A, 2016, 505, 124–131 CrossRef CAS.
- N. Tokita, Rubber Chem. Technol., 1977, 50, 292–300 CrossRef CAS.
- A. P. Plochocki, S. S. Dagli and R. D. Andrews, Polym. Eng. Sci., 1990, 30, 741–752 CAS.
- B. D. Favis, J. Appl. Polym. Sci., 1990, 39, 285–300 CrossRef CAS.
- U. Sundararaj, Y. Dori and C. W. Macosko, Annual Technical Conference – ANTEC, Conference Proceedings, 1994, pp. 2448–2449 Search PubMed.
- U. Sundararaj and C. W. Macosko, Macromolecules, 1995, 28, 2647–2657 CrossRef CAS.
- H. Li and U. Sundararaj, Macromol. Chem. Phys., 2009, 210, 852–863 CrossRef CAS.
Footnote |
| † Electronic supplementary information (ESI) available. See DOI: 10.1039/c7ra11390k |
| This journal is © The Royal Society of Chemistry 2017 |

