DOI:
10.1039/C7RA11544J
(Paper)
RSC Adv., 2017,
7, 54313-54317
Pitzer thermodynamic modeling study on solid–liquid equilibria of the quinary system LiCl–NaCl–CaCl2–SrCl2–H2O at 298.15 K
Received
19th October 2017
, Accepted 14th November 2017
First published on 27th November 2017
Abstract
The Pitzer thermodynamic model for solid–liquid equilibria in the quinary system LiCl–NaCl–CaCl2–SrCl2–H2O at 298.15 K was constructed by combining the proper parameters and solubility product constants of the equilibrium solids for the subsystems in the literature. The solubility data of the systems CaCl2–SrCl2–H2O and LiCl–CaCl2–H2O were used to evaluate the model. The comparisons between the experimental and calculated solubilities indicate that the model is reliable. The solubilities of the quaternary system NaCl–CaCl2–SrCl2–H2O and the quinary system LiCl–NaCl–CaCl2–SrCl2–H2O were calculated, which can be used as a theoretical reference for comprehensive exploitation and utilization of this type of brine resource.
1. Introduction
The oilfield brines in Nanyishan Section in the Qaidam Basin of the Qinghai-Tibet Plateau, which belong to the CaCl2-type, have high contents of lithium, potassium, calcium, and strontium accompanied with sodium, bromine, boron, and many other useful components. The concentration of lithium, calcium, and strontium in the brines is up to 0.98 g L−1, 69.10 g L−1, and 4.45 g L−1, respectively, which is much higher than those in the salt lake brines in Qinghai-Tibet Plateau.1 After a multistep exploitation of boron, potassium, and bromine, the brine largely consists of the complex system LiCl–NaCl–CaCl2–SrCl2–H2O. The phase equilibria and phase diagrams (solubility data) of the brine systems are theoretical foundations for the exploitation of the brine resources and describe the geochemical behavior of the brine and mineral systems.2 Therefore, studies of the phase diagrams and thermodynamics of the brine systems containing lithium and strontium are necessary and urgent to extract natural resources.2,3
In order to effectively exploit the oilfield brine containing lithium and strontium, many systems containing lithium and strontium such as LiCl–NaCl–KCl–SrCl2–H2O at 298.15 K and SrCl2–KCl–NaCl–H2O at 298.15 and 323 K had been investigated previously.4–7 However, there are few reports in the literature for the systems containing both lithium and strontium with calcium. Experimental work and thermodynamic modeling are usually combined to complete the description of the phase equilibria for the salt-water systems. Global thermodynamic models, even though they are largely empirical, provide convenient representations of the thermodynamic properties for practical applications and for further research.8 The Pitzer and Harvie–Weare (HW) chemical model,9–12 which combines the Pitzer parameters and the solubility product constants of the equilibrium solids, have been widely used in the solubility predictions and the calculations of thermodynamic properties.
A number of experimental and theoretical studies on the subsystems of the complex system LiCl–NaCl–CaCl2–SrCl2–H2O at 298.15 K have been reported in recent decades. The solubilities of the systems LiCl–CaCl2–H2O, LiCl–SrCl2–H2O, NaCl–SrCl2–H2O, and CaCl2–SrCl2–H2O, which are the important subsystems of the oilfield brine system, have been reported at 298.15 K,13–18 but the phase diagram for the quinary system at 298.15 K is still lacking. The Pitzer parameters and the solubility product constants for the species in the quinary system have also been reported many times in the literature,4,19–22 but it is difficult to select a consistent set of parameters out of these results. Therefore, the Pitzer thermodynamic model for the system LiCl–NaCl–CaCl2–SrCl2–H2O has not been constructed before. In this paper, the Pitzer thermodynamic model for the solid–liquid equilibria in the quinary system was constructed by choosing the appropriate parameters and solubility product constants for the species. Then, the solubilities of the quinary system were predicted.
2. Model approach
Pitzer developed an ion-interaction model and published a series of papers,9,10 which provided a set of expressions for the osmotic coefficients of a solution and the mean activity coefficients of the electrolytes in the solution. On the basis of Pitzer's semi-empirical equations, Harvie and Weare developed the chemical equilibrium model, which is more convenient to use in the solubility calculations.11,12 Since these equations are based on the excess free energy, all of the activity expressions are consistent and suitable for the application on different types of data (e.g. osmotic coefficients, activity coefficients, water activity, and solubility data) in the parameter regression and the calculation of other thermodynamic functions. Model validation involves the comparison of model predictions with data not used in the parameter evaluation process. The solubility data were calculated in this paper to affirm the model accuracy. The compositions of the solution and coexisting solid minerals can be identified with these equations. The equations are the main expressions for the model, shown as follows:| |
 | (1) |
| |
 | (2) |
| |
 | (3) |
In expressions (1) to (3), c, c′, and M represent cations and a, a′, and X represent anions. In addition, γi and mi are the activity coefficient and molality (mol kg−1) of the ions, respectively, zi is the valence state of the ions, and ø is the osmotic coefficient. Other symbols in eqn (1) to (3) are all described in the ref. 9–12.
The solubility product constant (Ksp) of a hydrated salt Mν1Xν2·ν0H2O at a stated temperature and pressure is shown in eqn (5).
| |
 | (4) |
| |
 | (5) |
| |
ln![[thin space (1/6-em)]](https://www.rsc.org/images/entities/char_2009.gif) aw = −øMw∑mi aw = −øMw∑mi
| (6) |
In eqn (5), m represents the saturated concentration (mol kg−1) of the ions. In eqn (6), aw and Mw represent the water activity and molar mass of water (kg mol−1), respectively, and the sum contains all solute species.
3. Model parameterization
The Pitzer model of the systems (Li + Na + K + Mg + Cl + SO4 + H2O)21 and (LiCl–NaCl–KCl–SrCl2–H2O)4,5 at 298.15 K were successfully constructed. Therefore, the binary Pitzer parameters for LiCl, NaCl, and SrCl2 and the solubility product constants for LiCl·H2O, NaCl, SrCl2·6H2O, and SrCl2·2H2O used in this research for the quinary system were taken from the literature.4,21 It should be pointed out that the parameters and standard chemical potentials for LiCl were fitted again using the osmotic coefficients, activity coefficients or the solubility data to suit the high brine concentration in Chinese salt lake brines (up to 20 mol kg−1) by Song et al.21 The binary Pitzer parameters for CaCl2 used in the research were acquired from the literature,20 which can be used for concentrations up to 6 mol kg−1. The mixing parameters for the quinary system, which are evaluated in the literature,4,21 were also used in this study. All three types of parameters required in the quinary system: Pitzer binary parameters, mixing parameters, and solubility product constants, are listed in Tables 1–3, respectively.
Table 1 Pitzer binary parameters of the quinary system LiCl–NaCl–CaCl2–SrCl2–H2O at 298.15 K
| Species |
β(0) |
β(1) |
C(ø) |
Ref. |
| LiCl |
0.20818 |
−0.07264 |
−0.004241 |
4 and 21 |
| NaCl |
0.07650 |
0.26640 |
0.001270 |
4 and 21 |
| CaCl2 |
0.32579 |
1.38412 |
−0.001740 |
20 |
| SrCl2 |
0.28344 |
1.62560 |
−0.000891 |
4 |
Table 2 Pitzer mixing ion-interaction parameters of the quinary system LiCl–NaCl–CaCl2–SrCl2–H2O at 298.15 K
| C |
C′ |
θCC′ |
ΨCC′Cl |
Ref. |
| Li+ |
Na+ |
0.020160 |
−0.007416 |
4 and 21 |
| Li+ |
Ca2+ |
0.000000 |
−0.007000 |
19 |
| Li+ |
Sr2+ |
−0.035900 |
0.001921 |
4 |
| Na+ |
Ca2+ |
0.070000 |
−0.007000 |
11 |
| Na+ |
Sr2+ |
0.078850 |
−0.012300 |
4 |
| Ca2+ |
Sr2+ |
0.000000 |
0.000000 |
This study |
Table 3 Solubility product constants of the equilibrium solids in the LiCl–NaCl–CaCl2–SrCl2–H2O system at 298.15 K
| Species |
μ0/RT |
Ref. |
| LiCl·H2O |
12.0662 |
21 |
| NaCl |
3.6160 |
21 |
| CaCl2·6H2O |
9.3161 |
This study |
| CaCl2·4H2O |
12.7600 |
This study |
| LiCl·CaCl2·5H2O |
23.8600 |
This study |
| SrCl2·6H2O |
4.3268 |
4 |
| SrCl2·2H2O |
8.5989 |
4 |
3.1 Evaluation of parameters in the LiCl–CaCl2–H2O system
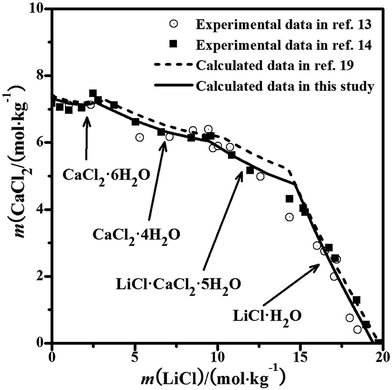
The solubilities of the system LiCl–CaCl2–H2O were calculated by Christov et al.19 The binary parameters for LiCl and CaCl2 are different from those in our study. In the literature, the binary parameters for LiCl and CaCl2 were only used when their concentration did not exceed 19 mol kg−1 and 2.5 mol kg−1, respectively.19 However, the binary parameters used in this study can be used for a higher concentration. Therefore, the binary parameters for LiCl and CaCl2 are more accurate. The mixing parameters θLi,Ca and ΨLi,Ca,Cl used in this study were the same as those from Christov et al.19 With different parameters, the solubility product constants of CaCl2·6H2O, CaCl2·4H2O and LiCl·CaCl2·5H2O were obtained again with the activity product constants, which differ from those in the literature.19 The reference solubility data for this ternary system were used to evaluate the model.13,14 The solubility data reported in these two references,13,14 particularly the invariant point data, are different and shown in Fig. 1. The calculated data in this study and from Christov et al.19 are also shown in Fig. 1. The calculated solubility curves saturated with CaCl2·6H2O and LiCl·H2O are nearly the same as those obtained in the study from Christov.19 The calculated data in the curves saturated with CaCl2·4H2O and LiCl·CaCl2·5H2O in this study agree with the experimental data, but are smaller than those obtained in the study from Christov et al. Although there are still some deviations between the calculated data and the experimental data, the calculated data in this study are more accurate. The main reason for the deviations can be that the binary parameters for LiCl and the mixing parameters θLi,Ca and ΨLi,Ca,Cl are not satisfactory. However, considering the high concentration in the system, the calculated data agree with the experimental data.
 |
| | Fig. 1 Experimental and calculated phase diagrams of the ternary system LiCl–CaCl2–H2O at 298.15 K. ■, experimental data from ref. 13; ○, experimental data from ref. 14; —, calculated isotherm curve. | |
3.2 Evaluation of parameters in the CaCl2–SrCl2–H2O system
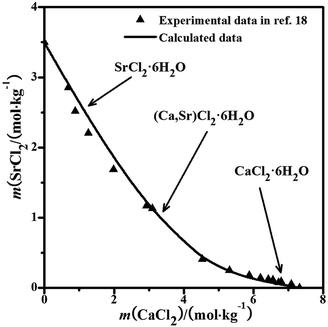
The solubility data were calculated with the PSC model,22 but the calculation with the Pitzer model for the system was still lacking. The phase equilibrium of the ternary system was reported in detail by Bi et al.18 The experimental diagram comprised of two invariant points, which were saturated with CaCl2·6H2O + (Ca,Sr)2·6H2O and SrCl2·6H2O + (Ca,Sr)2·6H2O. The solid solution (Ca,Sr)2·6H2O was found in the system. From the literature,21 the interaction between the CaCl2 and SrCl2 salts is quite weak and the binary model parameters can represent the properties (component activities) and be used to evaluate the ternary system. The equilibrated solid phase is probably the ideal solid solution in the entire concentration range of the ternary system at T = 298.15 K, rather than the single pure solid phase. Therefore, the mixing parameters θCa,Sr and ΨCa,Sr,Cl for the Pitzer model in this study were considered as zero. Herein, we also assumed that the solid solution was an ideal solution and predicted its solubility isotherm, which is the same as that in the literature.22 The calculated solubilities and the experimental results are shown in Fig. 2. The solubilities calculated with the PSC model and the Pitzer model are nearly the same. The predicted solubility isotherm of the assumed ideal solid solution agrees with the experimental points very well over the entire concentration range, which shows that the solid solution (Ca,Sr)2·6H2O can be considered as the ideal solution and formed in the entire concentration range.
 |
| | Fig. 2 Experimental and calculated phase diagrams of the ternary system CaCl2–SrCl2–H2O at 298.15 K. ▲, experimental data from ref. 18; —, calculated isotherm curve. | |
4. Solubility prediction
Phase equilibria and phase diagrams are the theoretical foundation for the exploitation of brine resources. The LiCl concentration is very small at the beginning of the evaporation for the mother liquor of the oilfield brine, which was acquired from Nanyishan district in the Qaidam Basin. The quaternary system NaCl–CaCl2–SrCl2–H2O can represent the brine. As the LiCl concentration increases in the brine, the brine largely belongs to the complex system LiCl–NaCl–CaCl2–SrCl2–H2O. Therefore, the solubility data of the NaCl–CaCl2–SrCl2–H2O and LiCl–NaCl–CaCl2–SrCl2–H2O systems were predicted for the exploitation of brine resources.
4.1 NaCl–CaCl2–SrCl2–H2O system
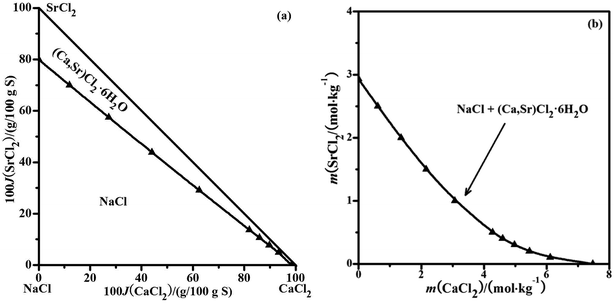
The solubility data for the quaternary system were calculated using the parameters in Tables 1–3. The experimental solubility data for the quaternary system at 298.15 K are not reported in the literature. With the calculated data, the dry-salt phase diagram was plotted using the Jänecke indices of CaCl2 and SrCl2 with the unit g/100 g dry salt (mNaCl + mCaCl2 + mSrCl2), as shown in Fig. 3a. The phase diagram of the system consists of two crystallization fields: NaCl and (Ca,Sr)Cl2·6H2O. There is only one solubility curve AB co-saturated with NaCl and (Ca,Sr)Cl2·6H2O in the phase diagram. The phase diagram with the molalities of CaCl2 and SrCl2 as X-axis and Y-axis was also drawn in Fig. 3b. The pattern of the curve is likely the same as that in the ternary system CaCl2–SrCl2–H2O in Fig. 2.18 No invariant points for the quaternary system were found.
 |
| | Fig. 3 Calculated phase diagrams of the ternary system NaCl–CaCl2–SrCl2–H2O at 298.15 K. ▲, calculated data; —, calculated isotherm curve; (a) dry-salt diagram; (b) phase diagram with molalities. | |
4.2 LiCl–NaCl–CaCl2–SrCl2–H2O system
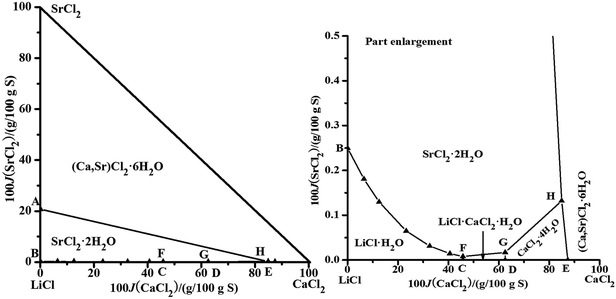
The brines are usually saturated with NaCl after evaporation; therefore, we calculated the solubility data of only the quinary system saturated with NaCl. The dry-salt diagram saturated with NaCl consists of five crystallization zones corresponding to LiCl·H2O, SrCl2·2H2O, LiCl·CaCl2·5H2O, CaCl2·4H2O, and (Ca,Sr)2·6H2O. The points A, B, C, D, and E are the invariant points for the quaternary system in Fig. 4. The probable saturated equilibrium solids for the invariant points of the quinary system are listed in Table 4. There could be three invariant points: (F, G, and H), (F, I, and J) or (J, K, and L). By combining the parameters in Tables 1–3 and the probable saturated solids in Table 4, the solubilities of the quinary system were predicted. There are some errors in the data of the point I, and the solubilities of the point K cannot be calculated. Therefore, the points I saturated with (NaCl + LiCl·CaCl2·5H2O + SrCl2·2H2O + (Ca,Sr)2·6H2O) and K saturated with (NaCl + LiCl·H2O + SrCl2·2H2O + (Ca,Sr)2·6H2O) do not exist in this quinary system. The invariant points for the quinary system should be F, G, and H. From the literature,23 the invariant point saturated with the LiCl·H2O, SrCl2·2H2O, and LiCl·CaCl2·5H2O was found in the quaternary system, LiCl–CaCl2–SrCl2–H2O, which can also affirm that the invariant points for the quinary system should be F, G, and H. The calculated dry-salt diagram is shown in Fig. 4. The Jänecke indices of CaCl2 and SrCl2, whose units are g/100 g dry salt (mLiCl + mCaCl2 + mSrCl2), are used as X-axis and Y-axis, respectively. There are six univariant solubility curves saturated with two salts (Fig. 4). The crystallization areas decrease in the sequence (Ca,Sr)2·6H2O, SrCl2·2H2O, LiCl·H2O, CaCl2·4H2O, and LiCl·CaCl2·5H2O. The concentrations of NaCl, CaCl2, and SrCl2 are very small when the LiCl concentration is high in the solution, which shows that LiCl has a strong salting-out effect on other salts.
 |
| | Fig. 4 Calculated phase diagrams of the quinary system LiCl–NaCl–CaCl2–SrCl2–H2O at 298.15 K. ▲, calculated data; —, calculated isotherm curve. | |
Table 4 The probable saturated equilibrium solids for the invariant points of the quinary system
| No. |
Equilibrium solids for invariant point of the quinary system |
| F |
NaCl + LiCl·H2O + LiCl·CaCl2·5H2O + SrCl2·2H2O |
| G |
NaCl + LiCl·CaCl2·5H2O + CaCl2·4H2O + SrCl2·2H2O |
| H |
NaCl + CaCl2·4H2O + SrCl2·2H2O + (Ca,Sr)2·6H2O |
| I |
NaCl + LiCl·CaCl2·5H2O + SrCl2·2H2O + (Ca,Sr)2·6H2O |
| J |
NaCl + LiCl·CaCl2·5H2O + CaCl2·4H2O + (Ca,Sr)2·6H2O |
| K |
NaCl + LiCl·H2O + SrCl2·2H2O + (Ca,Sr)2·6H2O |
| L |
NaCl + LiCl·H2O + LiCl·CaCl2·5H2O + (Ca,Sr)2·6H2O |
5. Conclusion
The Pitzer thermodynamic model for solid–liquid equilibria in the quinary system LiCl–NaCl–CaCl2–SrCl2–H2O at 298.15 K was constructed by selecting the appropriate parameters from the literature. The solubility data of the systems LiCl–CaCl2–H2O and CaCl2–SrCl2–H2O, not used in the parameterization process, were used to evaluate the model. Good agreement between the experimental and calculated solubilities shows that the model is reliable. By combining the Pitzer parameters and the solubility equilibrium constant equations of the equilibrium solids, the solubilities of the NaCl–CaCl2–SrCl2–H2O system were calculated. The invariant points of the quinary system LiCl–NaCl–CaCl2–SrCl2–H2O were affirmed and the solubilities of the quinary system were predicted. The thermodynamic model obtained in this study is essential for the development of universal thermodynamic models for brine systems containing calcium chloride and strontium chloride.
Conflicts of interest
There are no conflicts to declare.
Acknowledgements
This work was financially supported by the National Natural Science Foundation of China (No. U1507112 and 21406104) and the Fund of KLSLRC at CAS in China (KLSLRC-KF-13-HX-4).
References
- Q. S. Fan, H. Z. Ma, H. B. Tan and T. W. Li, J. Salt Lake Res., 2007, 15, 6–12 Search PubMed.
- T. L. Deng, J. Chem. Eng. Data, 2004, 49, 1295–1299 CrossRef CAS.
- P. S. Song and Y. Yao, J. Salt Lake Res., 2004, 12, 1–10 Search PubMed.
- L. Z. Meng, M. S. Gruszkiewicz, T. L. Deng, Y. F. Guo and D. Li, Ind. Eng. Chem. Res., 2015, 54, 8311–8318 CrossRef CAS.
- B. Sun, P. S. Song, W. Li and L. J. Guo, J. Salt Lake Res., 2015, 23, 50–59 Search PubMed.
- V. K. Filippov, Y. A. Fedorov and N. A. Charykov, Zh. Obshch. Khim., 1990, 60, 492–499 CAS.
- X. Zhao, S. H. Sang, S. Y. Zhong and W. Y. Huang, Russ. J. Phys. Chem. A, 2015, 89, 2322–2326 CrossRef.
- M. S. Gruszkiewicz and J. M. Simonson, J. Chem. Thermodyn., 2005, 37, 906–930 CrossRef CAS.
- K. S. Pitzer, J. Phys. Chem., 1973, 77, 268–277 CrossRef CAS.
- K. S. Pitzer, Activity Coefficients in Electrolyte Solutions, CRC Press, London, 2nd edn, 1992 Search PubMed.
- C. E. Harvie and J. H. Weare, Geochim. Cosmochim. Acta, 1980, 44, 981–997 CrossRef CAS.
- C. E. Harvie, H. P. Eugster and J. H. Weare, Geochim. Cosmochim. Acta, 1982, 46, 1603–1618 CrossRef CAS.
- V. Shewchuk and M. Waisfeld, Zh. Neorg. Khim., 1967, 12, 1065–1069 Search PubMed.
- K. Y. Hu, Z. Y. Chen, W. Q. Chai, D. X. Chen and D. G. Liu, Ke Xue Lun Wen Xuan Ji, Science Press, Beijing, 1997, pp. 184–196 Search PubMed.
- V. P. Blidin, Dokl. Akad. Nauk SSSR, 1952, 84, 947–950 CAS.
- M. K. Kydynov, S. A. Lomteva and I. G. Druzhinin, Issled. Obl. Khim. Tekhnol. Miner. Solei Okislov, 1965, 46–150 Search PubMed.
- X. P. Ding, B. Sun, L. J. Shi, H. T. Yang and P. S. Song, Inorg. Chem. Ind., 2010, 42, 9–11 CAS.
- Y. J. Bi, B. Sun, J. Zhao, P. S. Song and W. Li, Inorg. Chem. Ind., 2011, 27, 1765–1771 CAS.
- C. Christov, S. Velikova and K. Ivanova, J. Chem. Thermodyn., 2000, 32, 1505–1512 CrossRef CAS.
- H. T. Kim and W. J. Frederick Jr, J. Chem. Eng. Data, 1988, 33, 177–184 CrossRef CAS.
- P. S. Song, Y. Yao, B. Sun and W. Li, Sci. China: Chem., 2010, 40, 1286–1296 Search PubMed.
- L. J. Guo, D. W. Zeng, Y. Yao and H. J. Han, J. Chem. Thermodyn., 2013, 63, 60–66 CrossRef CAS.
- Y. J. Bi, Master Dissertation, Qinghai Institute of Salt Lakes, Chinese Academy of Sciences, 2011.
|
| This journal is © The Royal Society of Chemistry 2017 |
Click here to see how this site uses Cookies. View our privacy policy here.  Open Access Article
 * and
Dan Li*


![[thin space (1/6-em)]](https://www.rsc.org/images/entities/char_2009.gif) aw = −øMw∑mi
aw = −øMw∑mi


