 Open Access Article
Creative Commons Attribution 3.0 Unported Licence
Pr3+ doped tellurite glasses incorporated with silver nanoparticles for laser illumination
Chenxiao Huaab,
Xin Zhaoa,
Edwin Yue Bun Punb and
Hai Lin *ab
*ab
aSchool of Textile and Material Engineering, Dalian Polytechnic University, Dalian 116034, P. R. China. E-mail: lhai@dlpu.edu.cn
bDepartment of Electronic Engineering and State Key Laboratory of Millimeter Waves, City University of Hong Kong, Tat Chee Avenue, Kowloon, Hong Kong, P. R. China
First published on 8th December 2017
Abstract
Enhanced red fluorescence emissions of Pr3+ were observed in heavy metal germanium tellurite (HGT) glasses containing silver nanoparticles (NPs). The well-dispersed Ag NPs with a diameter ∼7 nm were evidenced by transmission electron microscope (TEM). With the introduction of Ag NPs, multichannel transition emission intensity of Pr3+ increased by ∼25% in comparison with that in the case without silver doping, which is attributed to the existence of the localized surface plasmon resonance (LSPR) referring to the characteristic absorption peaks. The larger the net emission power, the higher was the net emission photon number and the higher quantum yield in Pr3+ doped HGT glasses containing Ag NPs, presenting the effectiveness of utilizing laser. An efficient fluorescence emission and macroscopical sensitization illustrate that the Pr3+-doped HGT glasses with Ag NPs are potential materials, which improve the color-rendering index for laser illumination.
1. Introduction
In the past decades, nanometer-sized particles of metals have attracted increasing attention due to several tempting properties such as optical nonlinearity, thermal characteristics, and magnetic properties,1–4 which are different from their bulk states. In recent years, considerable attention has been paid to the photometric characteristics of the noble metal (usually silver and gold) nanoparticles, which are embedded in a glass host accompanying with rare-earth (RE) ions, thus effectively boosting the fluorescence of rare-earth ions.5–7 Silver nanoparticles (NPs) function as an ideal sensitizer, which could enhance the emission efficiency of rare-earth ions due to the influence of the localized surface plasmon resonance (LSPR).8–10 The combination of RE ions and silver NPs provides a hopeful direction in the fabrication of optical devices for laser illumination.11–15Among oxide glass systems, tellurite glasses show a compromise between the demand for a proper chemical durability and the desire for a low cut-off phonon energy, which is ideal for the device fabrication and rare-earth fluorescence.16–24 With the introduction of germanium ions, the distribution of phonon energy changes and thus the density of the maximum phonons is reduced. In addition, the Pr3+ doped tellurite glasses with multichannel emissions have been considered as a prospective candidate for the adjustment of color rendering index in laser applications.25–27 Furthermore, the tellurite glass host provides a feasible method to synthesize silver NPs by the addition of AgCl and further heat-treatment process, which is promising to achieve a luminescence enhancement of Pr3+ in the tellurite glasses with the presence of Ag NPs.28–30 Moreover, although the ostensible fluorescence enhancement has been reported, the internal macroscopical sensitization under an excitation of the blue laser with a high power in the tellurite glasses containing Ag NPs is seldom reported, which is more meaningful for further understanding the enhancement of fluorescence behavior when silver nanoparticles are added and expands the scope of the application of the optoelectronic devices containing Ag NPs.31–34
In this study, the Pr3+ doped heavy metal germanium tellurite glasses containing Ag NPs were fabricated by a melt-quenching method with a post-annealing treatment and the existence of Ag NPs was further observed by transmission electron microscopy. The multichannel transition emission of Pr3+ increased by ∼25% in the Ag NPs embedded glasses compared with that in the silver-free glasses and the intense red fluorescence emissions were captured in the glass samples under the excitation of the short-wavelength visible lights, which are generated from the emitting 3P0 and 1D2 levels of Pr3+, and can be used as the excitation lights for minimally invasive PDT treatment. The absolute characterization of the glass samples containing Ag NPs under the excitation of a 453 nm blue laser was carried out and the high quantum yields were derived from the absolute spectral parameters, thus proving a macroscopical sensitization with a high-power laser. An efficient fluorescence emission and megascopic sensibilization in the Pr3+ doped HGT glasses with Ag NPs under the laser excitation provide a promising orientation to develop the efficient optical devices and a tunable red fluorescence is an important support for laser illumination in improving the color-rendering index.
2. Experiments
Pr3+-doped heavy metal germanium tellurite glasses (HGT) were prepared from high purity Na2CO3, Bi2O3, PbO, GeO2, TeO2, Pr(NO3)3·6H2O, and AgCl powders according to the molar host composition 2Na2O–17Bi2O3–2PbO–19GeO2–60TeO2 with an additional xwt% Pr(NO3)3 and ywt% AgCl, where x = 0.22 and y = 0 was labeled as HGT-Pr and x = 0.22 and y = 0.5 was marked HGT-PrAH. The raw materials were well-ground in an agate mortar, heated in a pure alumina crucible to 880 °C and maintained at this temperature for 20 min and then quenched onto an aluminum plate. Furthermore, the glasses were subsequently annealed at 320 °C for 2 h to eliminate an internal stress and then cooled down to room temperature slowly. The HGT-PrAH glass containing silver was then heat-treated at 350 °C for 2 h and cooled down to room temperature slowly. For the optical measurements, the glass samples were sliced and polished into pieces with two parallel sides.The densities of the HGT-Pr and HGT-PrAH glass samples were measured to be 6.106 and 6.110 g cm−3, respectively, and the number densities of Pr3+ were calculated to be 2.469 × 10¹⁹ and 2.461 × 1019 cm−3, respectively. Using a Metricon 2010 prism coupler, the refractive indices of the HGT-Pr and HGT-PrAH glass samples were measured to be 2.1053 and 2.1062 at 635.96 nm and 2.0431 and 2.0456 at 1546.9 nm, respectively. In addition, the refractive indices at other wavelengths can be calculated by Cauchy's equation n = A + B/λ2, giving A = 2.0304 and B = 30![[thin space (1/6-em)]](https://www.rsc.org/images/entities/char_2009.gif) 273 nm2 for HGT-Pr glass and A′ = 2.0333 and B′ = 29
273 nm2 for HGT-Pr glass and A′ = 2.0333 and B′ = 29![[thin space (1/6-em)]](https://www.rsc.org/images/entities/char_2009.gif) 495 nm2 for HGT-PrAH glass.
495 nm2 for HGT-PrAH glass.
The absorption spectra were recorded using a Perkin Elmer UV-VIS-NIR Lambda 750 spectrophotometer. The visible fluorescence spectra were measured by a Hitachi F-7000 fluorescence spectrophotometer. Differential scanning calorimetry (DSC) was conducted using an American TA company SDT 600 at the rate of 10 °C min−1 from room temperature to 1000 °C under a N2 atmosphere. A 200 kV JEM-2100 transmission electron microscope (TEM), which functioned with selected area electron diffraction (SAED), was used to investigate the nucleation of Ag NPs formed in the glasses. The specimens for TEM images were prepared by dispersing the ground glass powder in ethanol using an ultrasonic bath. The spectral power distributions of the glass samples were measured using an integrating sphere (Labsphere) with a 3.3 inch diameter, which was connected to a CCD detector (Ocean Optics, QE65000) with 600 μm-core optical fiber and a 453 nm laser pigtailed with 400 μm-core fiber was used as the pump source. All of the above measurements were carried out at room temperature.
3. Results and discussion
3.1. Formation of silver nanoparticles
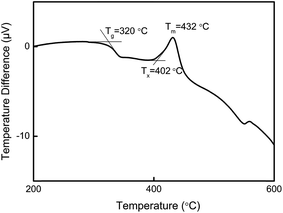
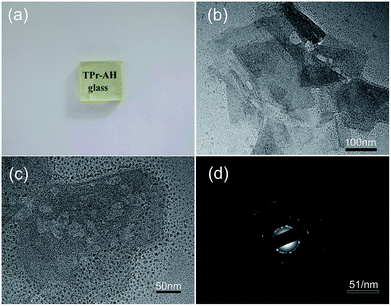
As shown in Fig. 1, the glass transition temperature (Tg) and crystallization onset temperature (Tx) of the Pr3+ doped HGT-PrAH glass with Ag nanoparticles, which were measured by DSC, are 320 °C and 402 °C, respectively.The Pr3+ doped heavy metal germanium tellurite glasses containing Ag NPs are visually transparent and homogeneous as shown in Fig. 2(a). Fig. 2(b), which present the transmission electron microscopy (TEM) images of HGT-PrAH glass sample with the addition of Ag element under different magnifications. As observed from the images, the Ag particles with various sizes and shapes are obtained in the HGT-PrAH glass, which was heat-treated at 350 °C for 2 h. The refined details of the HGT-PrAH glass are investigated by adopting a larger magnification (50 nm, as shown in Fig. 2(c)), which illustrates the generation of Ag NPs with diameters about ∼7 nm in the HGT-PrAH glass. To confirm the nucleation of Ag NPs, the selected area electron diffraction (SAED) pattern was recorded (Fig. 2(d)), in which the white spots in the first, second, and third rings originated from the (111), (200), and (220) crystal plane reflections of metallic Ag NPs, respectively, directly proving the presence of metallic Ag in the HGT-PrAH glass.35,36
It is worth noting that the formation of Ag0 NPs from Ag+ particles occurs through two representative reactions during the high-temperature melting process37
| Ag+ + e− → Ag0, Ag+ + Ag+ → Ag2+ + Ag0. | (1) |
Furthermore, a probable mechanism of a selective thermochemical reduction from Ag+ ions to Ag0 atoms by Te4+ ions in the tellurite glasses is considered due to the electromotive force values or reduction potentials of the respective redox system elements, that is38
| Ag+/Ag0 = 0.799 V, Te6+/Te4+ = 1.02 V. | (2) |
According to the above reduction processes, following process is likely to occur
| Te4+ + 2Ag+ → Te6+ + 2Ag0, ΔE0 = +0.578 V, | (3) |
3.2. Luminescence properties
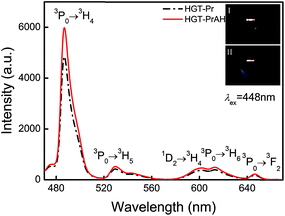
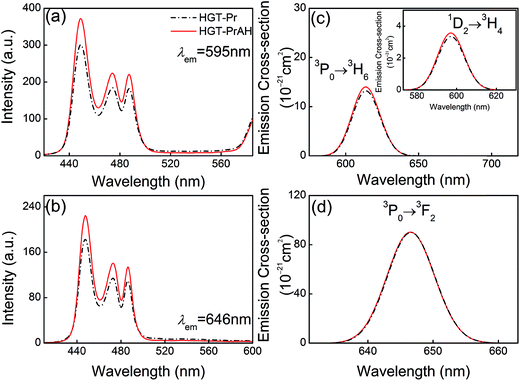
Pr3+ possesses a variety of radiative transitions from 3P0 and 1D2 levels when excited by blue light. With the introduction of Ag NPs, it is promising to enhance the emissions of Pr3+. To experimentally reflect the effects of Ag NPs on the luminescent properties of Pr3+ in the glasses, the HGT-Pr and HGT-PrAH glass samples are ground and polished and then the emission spectra are compared under the same excitation conditions as shown in Fig. 3. Five emission bands located at 486, 530, 602, 613, and 646 nm corresponding to 3P0 → 3H4, 3P0 → 3H5, 1D2 → 3H4, 3P0 → 3H6, and 3P0 → 3F2 transitions of Pr3+ are observed under a 448 nm radiation.43–46 Compared to the HGT-Pr glass, in the HGT-PrAH glass, there is a visible increment up to ∼25% in the emission intensities. The Pr3+ doped heavy metal germanium tellurite glasses exhibit a red fluorescence under the excitation of 448 nm and the fluorescent difference for the HGT-Pr and HGT-PrAH glass samples are shown in the inset photos (I) and (II) of Fig. 3, respectively. It is evident that the fluorescence of HGT-PrAH is brighter than that of the HGT-Pr glass sample, forcefully demonstrating that the characteristic emission from Pr3+ is intensified by introducing metallic Ag NPs in the HGT-PrAH glass.The excitation spectra of the HGT-Pr and HGT-PrAH glass samples monitored at 595 and 646 nm are presented in Fig. 4(a) and (b), respectively. Three excitation bands peaking at 448, 474, and 487 nm are assigned to the absorption transitions of 3H4 → 3P2, 3H4 → (1I6, 3P1), and 3H4 → 3P0, respectively, indicating that the emissions originating from the emitting 3P0 and 1D2 states can be achieved under the excitation of a commercial blue laser diode, blue and blue-greenish LEDs, and an Ar+ optical laser. In addition, under the blue light excitation, the emissions from two levels of Pr3+ are clearly enhanced in the HGT-PrAH glass compared to those in the HGT-Pr glass. The excitation band peaking at 595 nm is recorded for a 599 nm emission, which is due to the contribution of 1D2 → 3H4 emission when the 1D2 level undergoes excitation.
The stimulated emission cross-section σem is an important parameter to evaluate the energy extraction efficiency of the optical material. From the experimental fluorescence spectra, the σem for the transition emissions of Pr3+ can be evaluated by the Fuchtbauer–Ladenburg (FL) formula:47
 | (4) |
3.3. Localized surface plasmon resonance investigation
The measured UV/Vis/NIR absorption spectra of the HGT-Pr and HGT-PrAH glass samples are presented in Fig. 5(a) and (b), which show nine absorption bands peaking at 446, 472, 486, 595, 1009, 1445, 1539, 1939, and 2287 nm associated with the absorption transitions from the ground state 3H4 to the specific excited states. The major absorption peaks are almost uniform in different glass samples except for the slight differences in their intensity when the Ag NPs are introduced. As shown in Fig. 5, the absorbance of the HGT-PrAH glass containing Ag NPs is lower than that of the HGT-Pr glass, which is caused by the existence of a “metallic bridge” for the lead-containing glasses. Metallic Ag and a metallic bridge of Pb easily undergo metallic bonding and the “metallic bridge” of 1/2Pb0 exists in Glass–O2−–1/2Pb4+–1/2Pb0–Ag–1/2Pb0–1/2Pb4+–O2−–Glass, illustrating that metal Ag is highly dispersed in the glasses, which improves the body color and transparency, thus reducing the absorption. Because the LSPR usually hides in the absorption spectra, in order to clearly illustrate the existence of the LSPR, the difference between the absorption coefficients of the HGT-Pr and HGT-PrAH glass samples is presented in the inset of Fig. 5(b), in which the weak LSPR absorption band emerging from 500 to 530 nm is observed. On the basis of Mie theory, the peak of the LSPR absorption band is strongly dependent upon the refractive index of the glass host as follows:49| λmax2 = (2πc)2mNe2(ε∞ + 2n2)/ε0, | (5) |
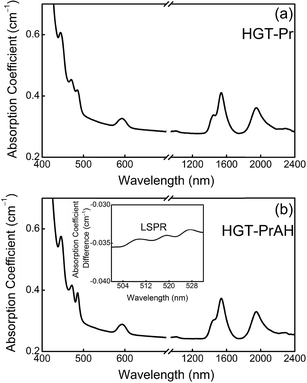 | ||
| Fig. 5 (a and b) Absorption spectra of HGT-Pr and HGT-PrAH glass samples. Inset: LSPR band of Ag NPs was observed in the HGT-PrAH glass. | ||
According to the Judd–Ofelt theory, the radiative transitions belonging to the 4f2 configuration of Pr3+ can be analyzed based on the absorption of Pr3+. The Judd–Ofelt intensity parameters Ωt (t = 2, 4, and 6) for Pr3+ in the HGT-PrAH glass are derived by a least square fitting approach to be 2.07 × 10⁻²⁰, 3.23 × 10⁻²⁰, and 3.56 × 10⁻²⁰ cm2, respectively.53–55 The intensity parameter Ω2 has been identified to be sensitive to the asymmetry and the covalency of the rare-earth ions and Ω4 and Ω6 are related to the bulk property and rigidity of the samples, respectively. In the HGT-PrAH glass system, Ω2 is larger than the value of 2.05 × 10⁻²⁰ cm2 in the HGT-Pr glass system without Ag NPs, which shows a strong asymmetrical and higher covalent environment owing to the introduction of Ag NPs changing the ligand field of Pr3+, thus achieving the intense fluorescence emission. Using these intensity parameters, some important radiative properties including spontaneous emission probabilities (Arad), luminescence branching ratios (β), and radiative lifetime (τrad) for the optical transitions of Pr3+ in the HGT-Pr and HGT-PrAH glasses are calculated and listed in Table 1. The predicated spontaneous emission probabilities Arad for the transitions 3P0 → 3F2, 3P0 → 3H6, and 1D2 → 3H4 are derived to be 15![[thin space (1/6-em)]](https://www.rsc.org/images/entities/char_2009.gif) 570, 7355, and 1503 s−1, respectively, and the relevant branching ratios β account for 23.3%, 11.0%, and 30.5%, respectively, presenting that the emissions of Pr3+ in the tellurite glasses are effective.
570, 7355, and 1503 s−1, respectively, and the relevant branching ratios β account for 23.3%, 11.0%, and 30.5%, respectively, presenting that the emissions of Pr3+ in the tellurite glasses are effective.
| Transition | HGT-Pr | HGT-PrAH | ||||||
|---|---|---|---|---|---|---|---|---|
| Energy (cm−1) | Arad (s−1) | β (%) | τrad (μs) | Energy (cm−1) | Arad (s−1) | β (%) | τrad (μs) | |
| 3P0 → 1D2 | 3748 | 8.91 | 0.001 | 14.99 | 3748 | 9.04 | 0.001 | 12.83 |
| 3P0 → 1G4 | 10![[thin space (1/6-em)]](https://www.rsc.org/images/entities/char_2009.gif) 701 701 |
1053.91 | 1.580 | 10![[thin space (1/6-em)]](https://www.rsc.org/images/entities/char_2009.gif) 701 701 |
1100.87 | 1.583 | ||
| 3P0 → 3F4 | 14![[thin space (1/6-em)]](https://www.rsc.org/images/entities/char_2009.gif) 019 019 |
7069.07 | 10.595 | 14![[thin space (1/6-em)]](https://www.rsc.org/images/entities/char_2009.gif) 021 021 |
7378.86 | 10.612 | ||
| 3P0 → 3F3 | 14![[thin space (1/6-em)]](https://www.rsc.org/images/entities/char_2009.gif) 119 119 |
0.00 | 0.000 | 14![[thin space (1/6-em)]](https://www.rsc.org/images/entities/char_2009.gif) 126 126 |
0.00 | 0.000 | ||
| 3P0 → 3F2 | 15![[thin space (1/6-em)]](https://www.rsc.org/images/entities/char_2009.gif) 469 469 |
15![[thin space (1/6-em)]](https://www.rsc.org/images/entities/char_2009.gif) 570.15 570.15 |
23.340 | 15![[thin space (1/6-em)]](https://www.rsc.org/images/entities/char_2009.gif) 465 465 |
15![[thin space (1/6-em)]](https://www.rsc.org/images/entities/char_2009.gif) 732.04 732.04 |
23.354 | ||
| 3P0 → 3H6 | 16![[thin space (1/6-em)]](https://www.rsc.org/images/entities/char_2009.gif) 224 224 |
7354.87 | 11.033 | 16![[thin space (1/6-em)]](https://www.rsc.org/images/entities/char_2009.gif) 229 229 |
7820.40 | 11.092 | ||
| 3P0 → 3H5 | 18![[thin space (1/6-em)]](https://www.rsc.org/images/entities/char_2009.gif) 450 450 |
0.00 | 0.000 | 18![[thin space (1/6-em)]](https://www.rsc.org/images/entities/char_2009.gif) 450 450 |
0.00 | 0.000 | ||
| 3P0 → 3H4 | 20![[thin space (1/6-em)]](https://www.rsc.org/images/entities/char_2009.gif) 577 577 |
35![[thin space (1/6-em)]](https://www.rsc.org/images/entities/char_2009.gif) 661.93 661.93 |
53.451 | 20![[thin space (1/6-em)]](https://www.rsc.org/images/entities/char_2009.gif) 577 577 |
37![[thin space (1/6-em)]](https://www.rsc.org/images/entities/char_2009.gif) 090.74 090.74 |
53.358 | ||
| 1D2 → 1G4 | 6953 | 519.10 | 10.516 | 202.61 | 6953 | 534.57 | 10.444 | 195.37 |
| 1D2 → 3F4 | 10![[thin space (1/6-em)]](https://www.rsc.org/images/entities/char_2009.gif) 271 271 |
1552.05 | 31.441 | 10![[thin space (1/6-em)]](https://www.rsc.org/images/entities/char_2009.gif) 272 272 |
1577.07 | 30.811 | ||
| 1D2 → 3F3 | 10![[thin space (1/6-em)]](https://www.rsc.org/images/entities/char_2009.gif) 371 371 |
164.66 | 3.336 | 10![[thin space (1/6-em)]](https://www.rsc.org/images/entities/char_2009.gif) 378 378 |
169.56 | 3.313 | ||
| 1D2 → 3F2 | 11![[thin space (1/6-em)]](https://www.rsc.org/images/entities/char_2009.gif) 721 721 |
594.01 | 12.033 | 11![[thin space (1/6-em)]](https://www.rsc.org/images/entities/char_2009.gif) 717 717 |
617.81 | 12.070 | ||
| 1D2 → 3H6 | 12![[thin space (1/6-em)]](https://www.rsc.org/images/entities/char_2009.gif) 476 476 |
571.93 | 11.586 | 12![[thin space (1/6-em)]](https://www.rsc.org/images/entities/char_2009.gif) 480 480 |
598.69 | 11.697 | ||
| 1D2 → 3H5 | 14![[thin space (1/6-em)]](https://www.rsc.org/images/entities/char_2009.gif) 702 702 |
31.37 | 0.635 | 14![[thin space (1/6-em)]](https://www.rsc.org/images/entities/char_2009.gif) 702 702 |
32.82 | 0.641 | ||
| 1D2 → 3H4 | 16![[thin space (1/6-em)]](https://www.rsc.org/images/entities/char_2009.gif) 829 829 |
1503.23 | 30.453 | 16![[thin space (1/6-em)]](https://www.rsc.org/images/entities/char_2009.gif) 829 829 |
1587.97 | 31.024 | ||
The luminescence decay curves of the 3P0 and 1D2 levels for the HGT-Pr and HGT-PrAH glasses are shown in Fig. 6(a) and (d). The fluorescent lifetimes (τexp) of the 3P0 and 1D2 levels can be derived from the fluorescence decays by the following formula:56
 | (6) |
| ηq = τexp/τrad, | (7) |
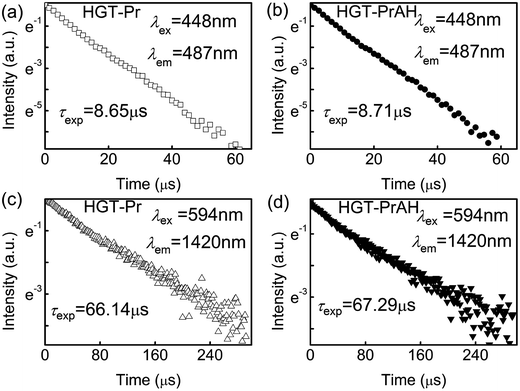 | ||
| Fig. 6 (a and b) Fluorescence decay curves of the 3P0 level for the HGT-Pr and HGT-PrAH glasses. (c and d) Fluorescence decay curves of the 1D2 level for the HGT-Pr and HGT-PrAH glasses. | ||
3.4. Absolute spectral parameters of the Pr3+ doped HGT glasses
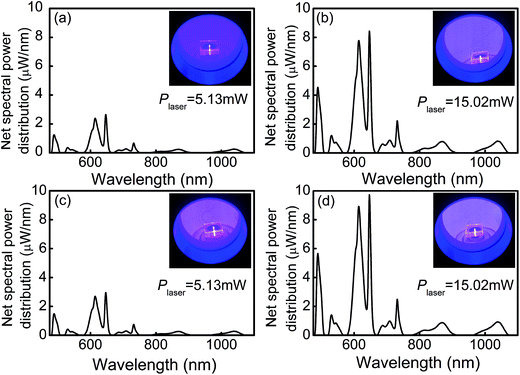
An integrating sphere coupled with a pumping laser was applied to measure an absolute spectral parameter, which provides an external quantum yield to evaluate the luminescence materials. The net spectral power distributions of fluorescence for the HGT-Pr and HGT-PrAH glasses were captured under the excitation of the 453 nm blue laser with various pump powers and presented in Fig. 7. The intense red emission is observed in the Pr3+ doped HGT glasses under the excitation of the blue laser as shown in the photographs in Fig. 7. Each spectral power distribution curve comprises seven emission bands in the red and near-infrared region located at 646, 688, 709, 732, 815, 869, and 1038 nm, which are assigned to 3P0 → 3F2, 1D2 → 3H5, 3P0 → 3F3, 3P0 → 3F4, 1D2 → 3H6, 1D2 → 3F2, and 1D2 → 3F4 transitions, respectively. Under the excitation of the 453 nm laser with a power (Plaser) of 5.13 and 15.02 mW, the net emission spectral powers for the HGT-Pr glass are obtained to 106.08 and 535.17 μW, respectively, and as high as 180.80 and 615.03 μW for the HGT-PrAH glass, respectively, confirming that the metallic Ag NPs doping HGT glasses are conducive to more efficiently utilize laser due to the LSPR of Ag nanoparticles.According to the net spectral power distribution, the 3P0 and 1D2 levels of Pr3+ were sensitized by introducing metallic Ag NPs in the Pr3+ doped HGT glasses. Table 2 demonstrates the tangible enhancement in the 3P0 and 1D2 levels under the 453 nm blue laser excitation for diverse powers, implying the sensitized difference of the disparate primary state level. With the increment of the laser power, the enhanced percentage shows an upward trend, indicating that the macroscopical sensitization can be realized under the excitation of the 453 nm blue laser.
| Transition | 5.13 mW pumping | Enhanced percentage | 15.02 mW pumping | Enhanced percentage | ||
|---|---|---|---|---|---|---|
| Emission power (μW) | Emission power (μW) | |||||
| HGT-Pr | HGT-PrAH | HGT-Pr | HGT-PrAH | |||
| 3P0 → 3F4 | 0.678 | 0.754 | 11.21% | 2.226 | 2.493 | 11.99% |
| 3P0 → 3F3 | 0.268 | 0.298 | 11.19% | 0.887 | 0.984 | 10.94% |
| 3P0 → 3F2 | 2.648 | 2.961 | 11.82% | 8.433 | 9.732 | 15.40% |
| 3P0 → 3H6 | 2.386 | 2.698 | 13.08% | 7.782 | 8.919 | 14.61% |
| 3P0 → 3H5 | 0.361 | 0.421 | 16.62% | 1.212 | 1.410 | 16.34% |
| 3P0 → 3H4 | 1.239 | 1.483 | 19.69% | 4.540 | 5.659 | 24.65% |
| 1D2 → 3F4 | 0.252 | 0.276 | 9.52% | 0.821 | 0.928 | 13.03% |
| 1D2 → 3F2 | 0.240 | 0.264 | 10.00% | 0.792 | 0.881 | 11.24% |
| 1D2 → 3H6 | 0.096 | 0.106 | 10.42% | 0.320 | 0.351 | 9.69% |
| 1D2 → 3H5 | 0.188 | 0.205 | 9.04% | 0.618 | 0.680 | 10.03% |
| 1D2 → 3H4 | 1.477 | 1.714 | 16.05% | 4.877 | 5.705 | 16.98% |
Based on the net spectral power distributions of the Pr3+ doped HGT glass samples, the photon distributions can be derived from
 | (8) |
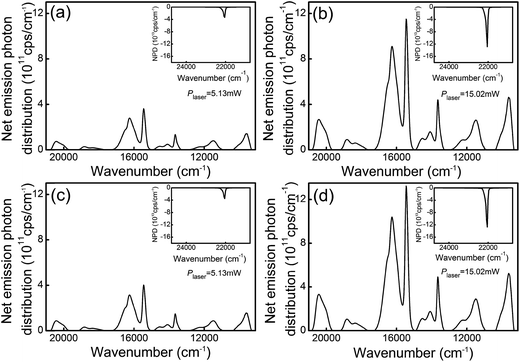 | ||
| Fig. 8 Net emission photon distributions of the HGT-Pr (a and b) and HGT-PrAH (c and d) glasses under the 453 nm laser excitation. Inset: details of the related net absorption photon distribution. | ||
The quantum yield (QY) of the luminescence material is defined as the ratio of the number of photons emitted to those absorbed, which is used as a selection criterion of the luminescence materials for potential applications in solid-state lighting devices.57 The equation is expressed as follows:
| QY = Nem/Nabs. | (9) |
Through this formula, the total QYs of the Pr3+ doped HGT glasses with and without Ag NPs under the excitation of the 453 nm blue laser with diverse powers are derived and listed in Table 3. The total QYs of the HGT-Pr and HGT-PrAH glasses are calculated to be 10.95% and 11.84% in the case of 5.13 mW pumping and 11.63% and 11.94% in the case of 15.02 mW pumping, respectively. Under the excitation of the 453 nm laser with the 5.13 mW power, the quantum yield of the HGT-PrAH glass with Ag NPs reaches 11.84%, which is higher than that in the HGT-Pr glass without Ag NPs, suggesting that the macroscopical sensitization is due to the LSPR. Higher photon release efficiency further implies the potential of the Pr3+ doped HGT glasses containing Ag NPs for laser illumination.
| Transition | 5.13 mW pumping | 15.02 mW pumping | ||
|---|---|---|---|---|
| Photon numbers (1014 cps) | Photon numbers (1014 cps) | |||
| HGT-Pr | HGT-PrAH | HGT-Pr | HGT-PrAH | |
| Net absorption | 48.88 | 50.95 | 153.22 | 170.56 |
| Net emission | 5.35 | 6.03 | 17.82 | 20.36 |
| 3P0 → 3H4 | 0.43 | 0.51 | 1.62 | 2.04 |
| 3P0 → 3H5 | 0.21 | 0.24 | 0.72 | 0.82 |
| 3P0 → 3H6 | 2.08 | 2.37 | 6.87 | 7.87 |
| 3P0 → 3F2 | 0.75 | 0.84 | 2.45 | 2.76 |
| 3P0 → 3F3 | 0.19 | 0.21 | 0.62 | 0.68 |
| 3P0 → 3F4 | 0.26 | 0.29 | 0.86 | 0.96 |
| 1D2 → 3H6 | 0.24 | 0.26 | 0.78 | 0.86 |
| 1D2 → 3F2 | 0.38 | 0.42 | 1.27 | 1.39 |
| 1D2 → 3F4 | 0.68 | 0.75 | 2.20 | 2.51 |
| 1D2 → 3H5 | 0.13 | 0.14 | 0.43 | 0.47 |
| Total quantum yield | 10.95% | 11.84% | 11.63% | 11.94% |
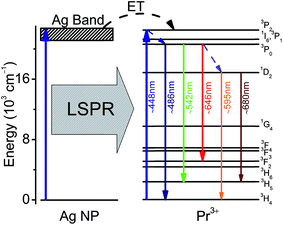
In order to comprehend the mechanism of the observed luminescence enhancement, the partial energy band diagram for Pr3+ in the vicinity of Ag NP is illustrated in Fig. 9. Under the excitation of 448 nm, initially, the 3P2 level is populated by the single-step ground state absorption, accompanying a sequence of non-radiative relaxation that populates the 3P0 state.58 Following this, the transitions occur from 3P0 to 3H4, 3H5, and 3F2 levels, emitting a series of fluorescence. Moreover, the 3P0 level depopulates non-radiatively through multiphonon-assisted decays to the 1D2 state and then jumps to the 3H4 and 3H5 levels. The emission rates of the Pr3+ ions located in the vicinity of Ag NPs increase and the major reason of increment in the emission rates is the mismatch of dielectric constants between the metal and the surroundings due to LSPR. Another approach to further enhancements can be described by an energy transfer (ET) from the surface of Ag NP to Pr3+ ion, which plays a secondary role.
3.5. Color anticipation of the Pr3+ doped germanium tellurite glass phosphor
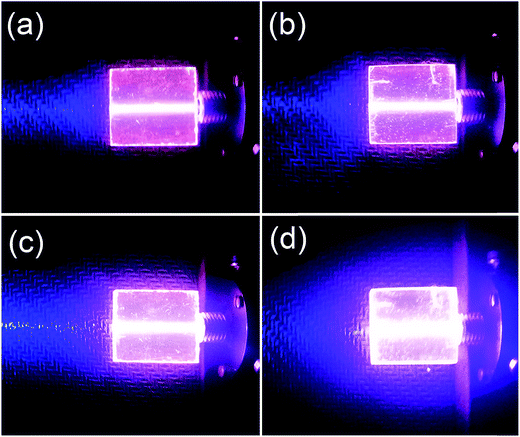
For the practicality aspect, the intense red light with an adequate intensity and good directivity in the Pr3+ doped HGT glasses provide advantageous surroundings in developing a laser illumination device. Fig. 10 displays the fluorescence photographs corresponding to the HGT-Pr and HGT-PrAH glasses with a long-path laser under the laser excitation. In addition, the fluorescence color diversification can be observed under the excitation of the 453 nm blue laser with diverse powers, demonstrating the notable tunability of color fluorescence of the Pr3+ emissions when the laser power increases from 5.13 to 15.02 mW. Moreover, there is a visible aggrandizement with regard to the brightness for the Pr3+ doped HGT glasses with Ag NPs under the same excitation condition, suggesting the macroscopical sensitization and providing a potential development in laser illumination devices.The color coordinates of the colorful fluorescence in HGT-PrAH glasses under the diverse excitation conditions are derived and marked on the CIE-1931 standard chromaticity diagram. A multicolor integral fluorescence derived from the combination of the residual laser and the Pr3+ spontaneous emission can be realized by adjusting the intensity ratio between the laser and the Pr3+ emissions as shown in Fig. 11.
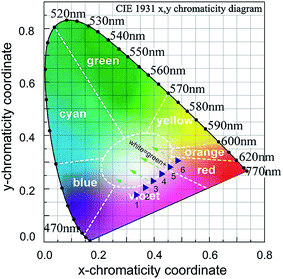 | ||
| Fig. 11 Color coordinates in the CIE 1931 chromaticity diagrams for HGT-PrAH glasses under the 453 nm laser excitation. | ||
The CIE 1931 color coordinates for the white fluorescence of the Pr3+ doped germanium tellurite glasses under different excitation conditions are calculated using the following formula
 | (10) |
 | (11) |
![[x with combining macron]](https://www.rsc.org/images/entities/i_char_0078_0304.gif) (λ), ȳ(λ), and
(λ), ȳ(λ), and ![[z with combining macron]](https://www.rsc.org/images/entities/i_char_007a_0304.gif) (λ) are three color-matching functions. On varying the intensity ratios between the residual laser and the Pr3+ emissions, the color coordinates move along the top left direction to the left boundary of the red region, passing through beneath the pure white region; the nearest-white region is point 3, whose color coordinate is derived to be (0.395, 0.225). White light would be achieved in HGT-PrAH glasses with the assistance of Tb3+, which emits a green fluorescence, which is beneficial to the white illumination. Moreover, the Pr3+ doped tellurite glasses have also been confirmed as promising materials for light emitting diodes with an additional Er3+ ion doping.59,60 On the whole, the Pr3+ doped tellurite glass is an up-and-coming material for the region of the illumination.
(λ) are three color-matching functions. On varying the intensity ratios between the residual laser and the Pr3+ emissions, the color coordinates move along the top left direction to the left boundary of the red region, passing through beneath the pure white region; the nearest-white region is point 3, whose color coordinate is derived to be (0.395, 0.225). White light would be achieved in HGT-PrAH glasses with the assistance of Tb3+, which emits a green fluorescence, which is beneficial to the white illumination. Moreover, the Pr3+ doped tellurite glasses have also been confirmed as promising materials for light emitting diodes with an additional Er3+ ion doping.59,60 On the whole, the Pr3+ doped tellurite glass is an up-and-coming material for the region of the illumination.
4. Conclusions
The Pr3+ doped heavy metal germanium tellurite glasses (HGT) containing AgCl was prepared to produce Ag nanoparticles with diameters ∼7 nm, which were evidenced by TEM images. The localized surface plasmon resonance (LSPR) band of around 500–530 nm in the prepared glass samples was demonstrated by the absorption spectra. The multichannel transition emission intensity of the Pr3+ with Ag NPs embedded HGT-PrAH glasses increased by ∼25% in comparison with that in a silver-free glass sample, which illustrates the existence of the LSPR combined the absorption spectra, thus emitting a noticeable red fluorescence. Net emission power and net emission photon number are calculated to be 615.03 μW and 20.37 × 10¹⁴ cps, respectively, and the quantum yield is as high as 11.94% in the Pr3+ doped HGT glasses with Ag NPs under the excitation of a 453 nm blue laser with a 15.02 mW power. An intense and tunable red fluorescence was observed, demonstrating macroscopical sensitization with the addition of Ag NPs. Furthermore, white light would be achieved by the addition of a green component when the residual laser and the Pr3+ emission reach an appropriate range. Moreover, the Pr3+ doped tellurite glasses can be applied to light emitting diodes on co-doping with Er3+. The results indicate that the Pr3+-doped HGT glasses with Ag NPs are an exploitable material, which provides an efficient red fluorescence in the improvement of the color-rendering index for laser illumination.Conflicts of interest
There are no conflicts to declare.Acknowledgements
The research work was supported by the Natural Science Foundation of Liaoning Province, China (2015020179, 2015020187), and the Research Grants Council of Hong Kong (AOE/P-02/12).References
- H. Fares, H. Elhouichet, B. Gelloz and M. Ferid, J. Appl. Phys., 2015, 117, 205 CrossRef.
- J. J. Li, R. F. Wei, X. Y. Liu and H. Guo, Opt. Express, 2012, 20, 10122 CrossRef CAS PubMed.
- Z. Yin, X. R. Zhang, D. L. Zhou, H. Wang, W. Xu, X. Chen, T. X. Zhang and H. W. Song, RSC Adv., 2016, 6, 89 Search PubMed.
- V. K. Tikhomirov, T. Vosch, E. Fron, V. D. Rodríguez, J. J. Velázquez, D. Kirilenko, G. Van Tendeloo, J. Hofkens, M. Van der Auweraer and V. V. Moshchalkov, RSC Adv., 2012, 2, 1496–1501 RSC.
- A. P. Carmo, M. J. V. Bell, Z. M. D. Costa, V. Anjos, L. C. Barbosa, E. F. Chillcce, J. M. Giehl and W. M. Pontuschka, Opt. Mater., 2011, 33, 1995–1998 CrossRef CAS.
- X. H. Xu, W. F. Zhang, L. M. Jin, J. B. Qiu and S. F. Yu, Nanoscale, 2015, 7, 16246 RSC.
- L. R. P. Kassab, D. M. Silva, J. A. M. Garcia, D. S. da Silva and C. B. de Araújo, Opt. Mater., 2016, 60, 25–29 CrossRef CAS.
- B. Huang, Y. X. Zhou, P. Cheng, Z. Zhou, J. Li and W. Jin, Opt. Mater., 2016, 60, 341–349 CrossRef CAS.
- I. Soltani, S. Hraiech, K. Horchani-Naifer, H. Elhouichet, B. Gelloz and M. Férid, J. Alloys Compd., 2016, 686, 556–563 CrossRef CAS.
- F. Huang, J. C. Zhou, J. Xu and Y. S. Wang, Nanoscale, 2014, 6, 2340–2344 RSC.
- E. Malchukova, B. Boizot, G. Petite and D. Ghaleb, J. Lumin., 2005, 111, 53–59 CrossRef CAS.
- T. A. de Assumpcao, D. M. da Silva, M. E. Camilo, L. R. Kassab, A. S. Gomes, C. B. de Araújo and N. U. Wetter, J. Alloys Compd., 2012, 536, S504–S506 CrossRef CAS.
- R. K. Verma, K. Kumar and S. B. Rai, Solid State Commun., 2010, 150, 1947–1950 CrossRef CAS.
- Y. Ohko, T. Tatsuma, T. Fujii, K. Naoi, C. Niwa and Y. Kubota, Nat. Mater., 2003, 2, 29–31 CrossRef CAS PubMed.
- G. H. Silva, D. P. A. Holgado, V. Anjos, M. J. V. Bell, L. R. P. Kassab, C. T. Amâncio and R. Moncorgè, Opt. Mater., 2014, 37, 281–286 CrossRef CAS.
- Q. R. Wang, F. Song, S. X. Lin, C. G. Ming, H. Y. Zhao, J. D. Liu, C. Zhang and E. Y. B. Pun, J. Nanopart. Res., 2011, 13, 3861–3865 CrossRef CAS.
- L. Bolundut, E. Culea, G. Borodi, R. Stefan, C. Munteanu and P. Pascuta, Ceram. Int., 2015, 41, 2931–2939 CrossRef CAS.
- V. A. G. Rivera, Y. Ledemi, S. P. A. Osorio, D. Manzani, Y. Messaddeq, L. A. O. Nunes and E. Marega Jr, J. Non-Cryst. Solids, 2012, 358, 399–405 CrossRef CAS.
- S. Q. Xu, Z. M. Yang, G. N. Wang, J. J. Zhang, S. X. Dai, L. L. Hu and Z. H. Jiang, Spectrochim. Acta, Part A, 2004, 60, 3025–3028 CrossRef PubMed.
- L. M. S. El-Deen, M. S. A. Salhi and M. M. Elkholy, J. Alloys Compd., 2008, 465, 333–339 CrossRef CAS.
- B. Klimesz, W. Ryba-Romanowski and R. Lisiecki, Opt. Mater., 2015, 42, 538–543 CrossRef CAS.
- M. R. Hasan, M. I. Hasan and M. S. Anower, Appl. Opt., 2015, 54, 9456–9461 CrossRef PubMed.
- Y. M. Yang, Z. P. Yang, P. L. Li, X. Li, Q. L. Guo and B. J. Chen, Opt. Mater., 2009, 32, 133–138 CrossRef CAS.
- L. Bolundut, E. Culea, G. Borodi, R. Stefan, C. Munteanu and P. Pascuta, Ceram. Int., 2015, 41, 2931–2939 CrossRef CAS.
- V. K. Rai, L. S. Menezes, C. B. de Araújo, L. R. P. Kassab, D. M. da Silva and R. A. Kobayashi, J. Appl. Phys., 2008, 103, 093526 CrossRef.
- M. Venkateswarlu, M. Prasad, K. Swapna, S. Mahamuda, A. S. Rao, A. M. Babu and D. Haranath, Ceram. Int., 2014, 40, 6261–6269 CrossRef CAS.
- V. K. Rai, C. B. de Araujo, Y. Ledemi, B. Bureau, M. Poulain, X. H. Zhang and Y. Messaddeq, J. Appl. Phys., 2008, 103, 103526 CrossRef.
- G. Lakshminarayana, K. M. Kaky, S. O. Baki, S. Ye, A. Lira, I. V. Kityk and M. A. Mahdi, J. Alloys Compd., 2016, 686, 769–784 CrossRef CAS.
- S. K. Singh, N. K. Giri, D. K. Rai and S. B. Ra, Solid State Sci., 2010, 12, 1480–1483 CrossRef CAS.
- Y. W. Qi, Y. X. Zhou, L. B. Wu, F. J. Yang, S. X. Peng, S. C. Zheng and D. D. Yin, J. Lumin., 2014, 153, 40 CrossRef.
- L. Bolundut, E. Culea, G. Borodi, R. Stefan, C. Munteanu and P. Pascuta, Ceram. Int., 2015, 41, 2931–2939 CrossRef CAS.
- G. V. Rao and H. D. Shashikala, J. Non-Cryst. Solids, 2014, 402, 204–209 CrossRef CAS.
- S. K. Singh, N. K. Giri, D. K. Rai and S. B. Rai, Solid State Sci., 2010, 12, 1480–1483 CrossRef CAS.
- M. R. Dousti, M. R. Sahar, M. S. Rohani, A. Samavati, Z. A. Mahraz, R. J. Amjad, A. Awang and R. Arifin, J. Mol. Struct., 2014, 1065–1066, 39–42 CrossRef.
- R. Driben, A. Husakou and J. Herrmann, Opt. Express, 2009, 17, 17989–17995 CrossRef CAS PubMed.
- S. P. Singh and B. Karmakar, Opt. Mater., 2011, 33, 1760–1765 CrossRef CAS.
- Y. W. Qi, Y. X. Zhou, L. B. Wu, F. J. Yang, S. X. Peng, S. C. Zheng and D. D. Yin, J. Lumin., 2014, 153, 40 CrossRef.
- H. Fares, H. Elhouichet, B. Gelloz and M. Férid, J. Appl. Phys., 2014, 116, 123504 CrossRef.
- T. Som and B. Karmakar, Plasmonics, 2010, 5, 149–159 CrossRef CAS.
- H. Tao, Y. Y. Lin, J. L. Yan and J. W. Di, Electrochem. Commun., 2014, 40, 75–79 CrossRef CAS.
- D. S. da Silva, T. A. A. de Assumpção, L. R. P. Kassab and C. B. de Araújo, J. Alloys Compd., 2014, 586, S516–S519 CrossRef CAS.
- C. B. de Araújo, T. R. Oliveira, E. L. Falcão-Filho, D. M. Silva and L. R. P. Kassab, J. Lumin., 2013, 133, 180–183 CrossRef.
- J. J. Li, R. F. Wei, X. Y. Liu and H. Guo, Opt. Express, 2012, 20, 10122–10127 CrossRef CAS PubMed.
- K. Annapurna, R. Chakrabarti and S. Buddhudu, J. Mater. Sci., 2007, 42, 6755–6761 CrossRef CAS.
- L. R. P. Kassab, C. B. de Araújo, R. A. Kobayashi, R. de Almeida Pinto and D. M. da Silva, J. Appl. Phys., 2007, 102, 103515 CrossRef.
- B. Zhou, L. Tao, Y. H. Tsang, W. Jin and E. Y. B. Pun, Opt. Express, 2012, 20, 3803–3813 CrossRef CAS PubMed.
- L. L. Zhang, G. P. Dong, M. Y. Peng and J. R. Qiu, Spectrochim. Acta, Part A, 2012, 93, 223–227 CrossRef CAS PubMed.
- Y. Y. Ma, Y. Y. Guo, F. F. Huang, Y. P. Peng, L. L. Hu and J. J. Zhang, J. Non-Cryst. Solids, 2013, 369, 23–28 CrossRef CAS.
- B. Huang, Y. X. Zhou, P. Cheng, Z. Z. Zhou, J. Li and G. B. Yang, J. Alloys Compd., 2016, 686, 785–792 CrossRef CAS.
- M. J. Berg, J. Quant. Spectrosc. Radiat. Transfer, 2012, 113, 198 CrossRef CAS.
- E. A. Carvalho, A. P. Carmo, M. J. V. Bell, V. Anjos, L. R. P. Kassab and D. M. da Silva, Thin Solid Films, 2012, 520, 2667–2671 CrossRef CAS.
- J. Massera, A. Martin, J. Choi, T. Anderson, L. Petit, M. Richardson, Y. Obeng and K. Richardson, J. Phys. Chem. Solids, 2010, 71, 1634–1638 CrossRef CAS.
- A. Tarafder, A. R. Molla, S. Mukhopadhyay and B. Karmakar, Solid State Sci., 2014, 37, 144–153 CrossRef CAS.
- R. J. Amjad, M. R. Dousti and M. R. Sahar, Curr. Appl. Phys., 2015, 15, 1–7 CrossRef.
- B. R. Judd, Phys. Rev., 1962, 127, 750–761 CrossRef CAS.
- G. S. Ofelt, J. Chem. Phys., 1962, 37, 511–520 CrossRef CAS.
- M. R. Rahimi, G. J. Yun, G. L. Doll and J. S. Choi, Opt. Lett., 2013, 38, 4134–4137 CrossRef CAS PubMed.
- L. L. Zhang, J. H. Zhang, X. Zhang, Z. D. Hao, G. H. Pan and H. J. Wu, J. Lumin., 2016, 180, 158–162 CrossRef CAS.
- K. Ozga, I. V. Kityk, M. Reben, J. Wasylak, N. Al Zayed, P. Rakus, A. Ślęzaka, M. Szota, M. Nabialek and M. Dospial, J. Alloys Compd., 2012, 536, S469–S471 CrossRef CAS.
- M. Reben, J. Wasylak, N. S. Alzayed, A. M. El-Naggar, M. G. Brik and I. V. Kityk, J. Mater. Sci.: Mater. Electron., 2012, 23, 631–634 CrossRef CAS.
| This journal is © The Royal Society of Chemistry 2017 |

