 Open Access Article
Creative Commons Attribution 3.0 Unported Licence
Understanding the temperature–resistance performance of a borate cross-linked hydroxypropyl guar gum fracturing fluid based on a facile evaluation method†
Haiming Fan *ab,
Zheng Gonga,
Zhiyi Weia,
Haolin Chena,
Haijian Fana,
Jie Genga,
Wanli Kang
 a and
Caili Daia
aShandong Provincial Key Laboratory of Oilfield Chemistry, School of Petroleum Engineering, China University of Petroleum (East China), Qingdao 266580, Shandong Province, P. R. China. E-mail: haimingfan@126.com
bState Key Laboratory of Oil and Gas Reservoir Geology and Exploitation, Southwest Petroleum University, Chengdu 610500, Sichuan Province, P. R. China
First published on 20th November 2017
Abstract
The evaluation of the temperature–resistance performance of fracturing fluid is essential for choosing suitable fracturing fluids during fracturing treatment. In this work, related parameters for characterizing the temperature–resistance performance of fracturing fluids have been analysed systematically. The maximum temperature, Tmax(η0, t0), which satisfies both the minimum viscosity requirement (η ≥ η0) of fracturing fluid and the time requirement of fracturing treatment (t ≥ t0), was used to characterize the temperature–resistance performance of fracturing fluids. A facile procedure for evaluating Tmax(η0, t0) has been proposed based on a step-by-step numerical-search method. The search for Tmax(η0, t0) starts from the upper limit temperature Tmax, which is the maximum temperature where the apparent viscosity meets the minimum viscosity requirement, i.e., η ≥ η0. Using a borate cross-linked hydroxypropyl guar gum fracturing fluid as an example, the effects of pH, and the concentrations of thickening agent (hydroxypropyl guar, HPG) and crosslinking agent (Na2B4O7) on the crosslink and temperature–resistance properties are also investigated. It has been found that the crosslinking time tc decreases with the increase of HPG concentration or Na2B4O7 concentration. However, tc was found to increase when pH increases. The variation tendencies of Tmax(η0, t0) are different from that of Tmax, viz., Tmax(η0, t0) gradually increases with Na2B4O7 concentration, whereas Tmax increases significantly at low Na2B4O7 concentration and remains almost unchanged at high Na2B4O7 concentration. The possible mechanisms are proposed for interpreting the above phenomena according to related crosslinking-reaction kinetics and thermodynamics. Our work demonstrates a facile method for evaluating the temperature–resistance performance of the fracturing fluid and provides useful insights into the understanding of the temperature tolerance performance of the borate cross-linked hydroxypropyl guar gum fracturing fluid.
1. Introduction
Hydraulic fracturing is a commonly used technique to stimulate hydrocarbon production by creating a network of highly conductive fractures in the area surrounding a wellbore.1 The network of fractures can not only improve the hydraulic conductivity of the reservoir rock, but also increase the surface area contributing to enhanced hydrocarbon production.1,2 Thus, hydraulic fracturing is used in conventional hydrocarbon reservoirs to increase permeability in damaged formations or in formations that exhibit significantly lower production owing to reservoir depletion. It is also used in unconventional reservoirs where the intrinsic permeability is too low to yield economical production.3–5 Fracturing fluid is of great significance for hydraulic fracturing treatment. The main functions of fracturing fluid include opening the fracture, and suspending and transporting proppants.1 So, a fracturing fluid is supposed to provide sufficient viscosity to ensure proper proppant transport and the even distribution of proppants along the fractures. Over the past few decades, linear or cross-linked polymer solutions,6–9 energized fluids,10–12 and viscoelastic surfactants (VES)13–18 have been developed as water-based fracturing fluids. Biopolymers such as guar gum and cellulose derivatives, synthetic polymers such as polyacrylamide, are introduced in the water-based fracturing fluids for improving the rheological performance.2 Crosslinking improves the rheological properties of the polymers for fracturing purposes, e.g. borate, Ti(IV), Zr(IV), and Al(III) ions are often used to crosslink water soluble polymers.19–21 Guar gum and its derivatives, such as hydroxypropyl guar (HPG), carboxymethyl guar (CMG) and carboxymethyl hydroxypropyl guar (CMHPG), are the most-common polymers used in fracturing fluid, accounting for up to 90% of all gelled fracturing fluids.1,22 Meanwhile, to satisfy the criterion to fracture deeper and hotter wells, synthetic terpolymer of 2-acrylamido-2-methylpropanesulfonic acid (AMPS), acrylamide and acrylate cross-linked by Zr has been developed and used as a fracturing fluid.23,24The evaluation on the temperature–resistance performance of fracturing fluid is essential for choosing the suitable fracturing fluid with excellent performance. Generally, two main methods were used to evaluate the temperature–resistance performance of fracturing fluid.25–35 One is to monitor the changes of the apparent viscosity at a constant shear rate with increasing temperature by continuously heating the fracturing fluid.25–27 The apparent viscosity decreases with increasing temperature and when it drops to a certain value, the indicated temperature is used as the thermal stability temperature of fracturing fluid. For example, Baruah et al. found that the VES fracturing fluid developed from Tween 80/NaOA/2-ethyl hexanol/clove oil/water system presented an apparent viscosity at shear rate 100 s−1 greater than 90 mPa s when the temperature is below 116.3 °C. The insertion of 500 ppm ZnO nanoparticle further improved the thermal stability temperature to 119.5 °C.25 The other method is to measure the changes of the apparent viscosity with time under constant temperature. Generally, the temperature–resistance performance of the fracturing fluid is obtained by either analysing the apparent viscosity after heating or measuring the stability time when the apparent viscosity of the fluid is above criterion value at different temperatures.28–35 For example, Holtsclaw et al. measured the apparent viscosity of zirconium cross-linked terpolymer gel as a function of time at 177, 191, 204 and 218 °C. It is found that the apparent viscosity at shear rate 40 s−1 of the gel was greater than 2000 mPa s after shearing for 4 hours at 177 °C, almost 500 mPa s after shearing for 4 hours at 204 °C, and approximately 300 mPa s after shearing for 2 hours at 218 °C.29 So they concluded the synthetic zirconium cross-linked terpolymer gel with good stability at temperature larger than 177 °C. Wang et al. found that the apparent viscosity of organic zirconium cross-linked terpolymer gel can reach 130 mPa s after 90 min of shearing at shear rate 170 s−1 at 220 °C, and but it is concluded that the fracturing fluid resists at high temperature of 220 °C.35
The duration time when the viscosity of fracturing fluid meets the required apparent viscosity for fracturing at the formation temperature should be larger than the time of fracturing treatment.1 Otherwise, it will affect the efficiency of fracturing fluid during fracturing treatment. Consequently, when evaluating the temperature–resistance performance of fracturing fluid, not only the required apparent viscosity, but also the duration time should be considered. For this reason, the second evaluation method is used more often. However, most of previous tests are not conducted under uniform standard conditions, e.g. the measurement of apparent viscosity is not at a same shear rate, so the apparent viscosities have to be measured and compared again when developed new thickening agent, crosslinking agent and other chemical additive agents. Furthermore, so far as we know, there is no evaluation method for accurately determining the maximum tolerance temperature of the fracturing fluid, which leads to the fact that the effectiveness of temperature stabilizer and chelating agent can only be indirectly reflected by measuring the apparent viscosity changes of the fracturing fluid at a certain temperature.36,37 Thus, it is still necessary to explore a standard method on evaluating the temperature–resistance performance of fracturing fluid, which will remarkably benefit researchers and users for the screening and developing of fracturing fluids.
The key point of the evaluation on the temperature–resistance performance of fracturing fluid is to establish a method for measuring the maximum tolerance temperature which meets the criteria for the apparent viscosity and the time requirement of the fracturing treatment. Our previous work demonstrated a way of evaluating the effectiveness of temperature stabilizer by measuring the difference of the maximum tolerance temperature in satisfying the criteria of fracturing treatment before and after adding the temperature stabilizer.38 However, no systematic study on the influence of main components in fracturing fluid on the temperature resistance performance has been published yet. Herein, in this work, related parameters for characterizing the temperature–resistance performance of fracturing fluid have been analysed. And the maximum tolerance temperature is determined by a step-by-step numerical search method starting from the upper limit temperature. By using this method, influence factors such as pH, the concentration of thickening agent (e.g., HPG) and crosslinking agent (e.g., Na2B4O7) on the crosslink and temperature–resistance properties of borate cross-linked hydroxypropyl guar gum fracturing fluid are investigated and the influence mechanisms are also discussed.
2. Materials and methods
2.1. Materials
Hydroxypropyl guar gum with an average molecular weight of 3.2 × 10⁶ Da is commercially available and supplied by Shandong Dongying Xinde Chemical Co., Ltd. Borax (Na2B4O7·10H2O, 99%) and sodium hydroxide (NaOH, 99%) are all A.R. grade and from Beijing Chemical Company. The water was triply distilled by a quartz water purification system. All reagents are used without further treatment.2.2. Sample preparation
The desired amount of HPG is added to the water in a 500 ml beaker and stirred at 6000 rpm for 5 min. Then 5 wt% NaOH is added dropwise to adjust the pH to desired value. These HPG solutions are continuously stirred for 5 min and sealed in a 30 °C thermostatic bath for above 4 hours, which is used as the base fluid for the preparation of fracturing fluid. The base liquid is added and stirred at 300 rpm in a 250 ml beaker. After the addition of the desired amount of cross-linked agent Na2B4O7, the mixture is continuously stirred to form a uniform fracturing fluid system. The fracturing fluid is then sealed in a 30 °C thermostatic bath for more than 6 hours before rheology measurements.2.3. Crosslinking time measurements
The crosslinking time of the borate cross-linked hydroxypropyl guar gum fracturing fluid is measured by macroscopic appearance observation at 30 °C. Typically, 100 ml base liquid is added and stirred at 300 rpm in a 250 ml beaker, and the desired amount of borate is added to the base liquid. Continue stirring until the vortex disappears and the liquid surface has just risen, and the time is defined as the crosslinking time.2.4. Rheology measurements
The rheological properties of samples are measured with a high temperature and high pressure rheometer (HAAKE MARS-III, Thermo Fisher Scientific). For measuring the viscosity–temperature curve of the fracturing fluid, the sample was continuously sheared at the shear rate of 170 s−1 and heated at the rate of 3.0 ± 0.2 °C min−1, and then the apparent viscosity was measured at the corresponding temperature. For measuring the viscosity–time curve of the fracturing fluid, the sample was continuously sheared at the shear rate of 170 s−1 and heated to the setting temperature. Then the apparent viscosity was measured as a function of time.3. Evaluation method for the temperature–resistance performance
3.1. Temperature–resistance performance of fracturing fluid
Table 1 shows the parameters for characterizing the temperature–resistance performance of fracturing fluid according to the technical requirement of fracturing treatment. η0, t0 and T0 are the minimum viscosity requirement of fracturing fluid, time requirement and formation temperature for fracturing treatment, respectively. And η is the apparent viscosity of fracturing fluid at a certain shear rate. The two temperatures, viz., Tmax and Tmax(η0, t0) and the duration time t(T) are the most important parameters to characterize the thermal stability of the fracturing fluid. Firstly, Tmax is the maximum temperature where the apparent viscosity meets the minimum viscosity requirement of fracturing fluid, and Tmax is also the highest temperature to satisfy the condition of η[T] ≥ η0. A convenient way to determine Tmax is through measuring the apparent viscosity as a function of temperature. Normally, the apparent viscosity decreases with increasing temperature and when it drops to η0, the corresponding temperature is defined as Tmax. Secondly, t(T) is the duration time where the apparent viscosity meets the minimum viscosity requirement of fracturing fluid at temperature T, and t(T) is also the longest time to satisfy the condition of η[T, t] ≥ η0. The way to determine t(T) is by measuring the apparent viscosity as a function of time at temperature T. And the difference between the time when η drops to η0 and the time when the temperature rises to the setting temperature is defined as t(T). Thirdly, Tmax(η0, t0) is the maximum temperature where the apparent viscosity meets both the minimum viscosity requirement of fracturing fluid and the duration time requirement of fracturing treatment. In other words, Tmax(η0, t0) is also the highest temperature to satisfy the condition η[T, t0] ≥ η0. It can be experimentally determined by measuring the t(T) of fracturing fluid at several temperatures, and Tmax(η0, t0) is the highest temperature to satisfy the condition t(T) ≥ t0. Furthermore, it is worth noting that Tmax is always larger than Tmax(η0, t0) because of the degradation of fracturing fluid accompanied by a decrease in apparent viscosity with the increase of heating time.| Symbol | Physical meaning | Mathematical expression |
|---|---|---|
| η0 | Minimum viscosity requirement of fracturing fluid for fracturing treatment | |
| t0 | Time requirement for fracturing treatment | |
| T0 | Formation temperature for fracturing treatment | |
| η | Apparent viscosity of fracturing fluid at a certain shear rate | |
| Tmax | Maximum temperature where the apparent viscosity meets the minimum viscosity requirement of fracturing fluid | η[T] ≥ η0 |
| η[Tmax] = η0 | ||
| t(T) | Duration time when the apparent viscosity meets the minimum viscosity requirement of fracturing fluid at temperature T | η[T, t] ≥ η0 |
| η[T, t(T)] = η0 | ||
| Tmax(η0, t0) | Maximum temperature where the apparent viscosity meets the minimum viscosity requirement of fracturing fluid and the duration time meets the time requirement of fracturing treatment | η[T, t0] ≥ η0 |
| η[Tmax(η0, t0), t0] = η0 |
The condition for fracturing fluids to meet the requirements for fracturing treatment is η[T0, t ≥ t0] ≥ η0, which means that at the formation temperature T0, the duration time t(T0) shall be larger than the time requirement for fracturing treatment t0. Thus, once t0, η0 and T0 are determined in the designed fracturing project, there are three possible situations according to the relationship between Tmax, Tmax(η0, t0) and T0. When T0 ≤ Tmax(η0, t0), the temperature–resistance performance of fracturing fluid can satisfy the requirements of fracturing treatment. When Tmax(η0, t0) < T0 ≤ Tmax, the fracturing fluid cannot meet the treatment requirements, but the initial apparent viscosity is larger than η0. Therefore, it is possible to consider delaying the reduction of viscosity by adding additives such as temperature stabilizer to meet the treatment requirements. When T0 > Tmax, the fracturing fluid has a low initial apparent viscosity thus it cannot meet the treatment requirements. So it is necessary to change the main-component concentration or the type of fracturing fluid to increase the thickening ability of fracturing fluid.
3.2. Evaluation procedure
Based on the above analysis, it can be seen that Tmax(η0, t0) is the parameter that directly reflects the temperature–resistance performance of the fracturing fluid in principle. Therefore, the key point for the evaluation method is to skilfully design experiments to determine Tmax(η0, t0) and avoid the boundless search. Owing to Tmax > Tmax(η0, t0), the Tmax(η0, t0) can be determined by a step-by-step numerical search method starting from the upper limit temperature Tmax, where the Tmax is easily determined by measuring the viscosity–temperature curve. Inspired by this idea, we designed a facile method on evaluating the temperature–resistance performance of the fracturing fluid and the specific experimental procedures are brief illustrated and shown in Fig. 1, and this method mainly includes the following steps.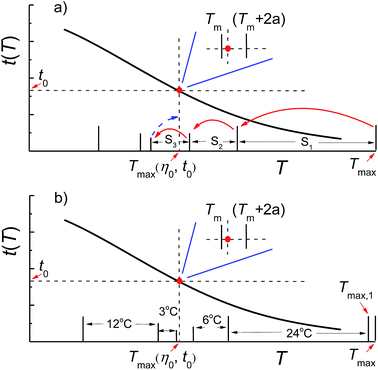 | ||
| Fig. 1 Scheme for determining the Tmax(η0, t0) of fracturing fluid by one-dimensional numerical search method. (a) Random numerical search method; (b) binary search method. | ||
(1) Setup the minimum viscosity requirement of fracturing fluid η0 and the time requirement t0 based on the requirements for fracturing treatment.
(2) Determination of Tmax by measuring the viscosity–temperature curve of fracturing fluid.
(3) Determination of Tmax(η0, t0) by numerical search method (Fig. 1a):
(i) Setup the initial search length S0 and the precision k of the numerical search;
(ii) Measure the t(T) of the fracturing fluid at (Tmax − S0 × n) °C, where n is a natural number. The test was stopped when t(T) ≥ t0, and the current temperature was recorded as T(t);
(iii) If t(T) = t0, stop search and execute step (vi); if t(T) > t0, order T(t) = Tm, where m is the number of times for execution steps (ii) and (iii), execute step (iv) until the step (v) is satisfied and then execute step (vi);
(iv) Shorten the search length to Sm and repeat steps (ii) and (iii) at (Tm + Sm−1 − Sm × n) °C in the temperature range of Tm ∼ Tm + Sm−1;
(v) Order a ≤ k, the measurement has been completed of t(Tm) and t(Tm + 2a), and meanwhile, the condition of t(Tm) > t0 and t(Tm + 2a) < t0 is also satisfied;
(vi) If t(T) = t0, the current T(t) is Tmax(η0, t0) that conforms to the precision of numerical search; if t(Tm) > t0 and t(Tm + 2a) < t0, the (Tm + a) is Tmax(η0, t0) that conforms to the precision of numerical search.
It is noted that the rigorous mathematical formulation is given in the above evaluation method. However, there are still many experimental steps that can be carried out flexibly. Firstly, the upper limit temperature Tmax,1 can be chose near Tmax, satisfying the condition of t(Tmax,1) < t0. This will facilitate the subsequent temperature setting in the test, because Tmax may be a fraction depending on the preset heating rate in the viscosity–temperature curves measurement. Secondly, the binary search method is recommended as the numerical search method. Although the golden section method, Fibonacci method and other one-dimensional numerical search method are better strategy compared to the binary search method, but the programs are relatively complex and difficult to master.39,40 In the binary search method, the step length of numerical search is reduced by half during each step, which is easy to master. Fig. 1b shows the scheme of binary search method where Tmax,1 is the upper limit temperature and 24 °C is the initial search length.
In order to further explain the determination of the specific parameters in the designed evaluation method, the fracturing fluid prepared by 0.3 wt% HPG/0.8 wt% Na2B4O7 cross-linked at pH 9 is chosen to investigate the temperature resistance performance. Since the prepared fracturing fluid is a water-based gelling fracturing fluid, the minimum viscosity requirement of fracturing fluid η0 and the time requirement t0 are set as 50 mPa s and 120 min, respectively, and the apparent viscosity is measured at shear rate 170 s−1 according to the general technical specifications of fracturing fluid in China.41 Fig. 2 shows the viscosity–temperature curve of the fracturing fluid. It can be seen that the Tmax of the fracturing fluid is 104.9 °C. And then the upper limit temperature Tmax,1, the initial search length S0 and the precision k for the binary search method are set as 105 °C, 24 °C and 0.5 °C, respectively. When the temperature is reduced by 24 °C from Tmax,1 to 81 °C, the temperature reaches the set point after 12 min heating, and the apparent viscosity is greater than 50 mPa s within the overall test time of 150 min (Fig. 3a). It is indicated that the t(T = 81 °C) of the fracturing fluid is larger than 138 min, which is higher than 120 min. Thus, the Tmax(η0, t0) of the fracturing fluid is between 81 °C and 105 °C. Fig. 3b shows the viscosity–time curve at 93 °C, and the t(T = 93 °C) is 31 min by calculating the difference between the time when η drops to η0 and the time when the temperature is raised to the setting temperature, which further limits the search range to 81–93 °C. Similarly, the viscosity–time curves of the fracturing fluid at 87 °C, 90 °C, 88 °C, 89 °C are also measured in turn and were shown in Fig. 3c–f. It is observed that the t(T = 88 °C) and t(T = 89 °C) satisfied the condition of t(T = 88 °C) > 120 min and t(T = 89 °C) < 120 min and the Tmax(η0, t0) is 88.5 °C which conforms to the preset precision of this numerical search method.
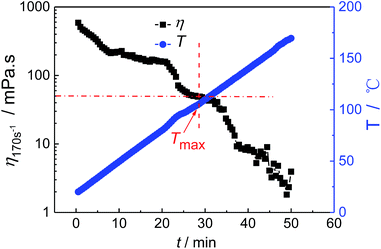 | ||
| Fig. 2 The viscosity–temperature curve of the fracturing fluid. The fracturing fluid is prepared by 0.3 wt% HPG/0.8 wt% Na2B4O7 cross-linked at pH = 9. | ||
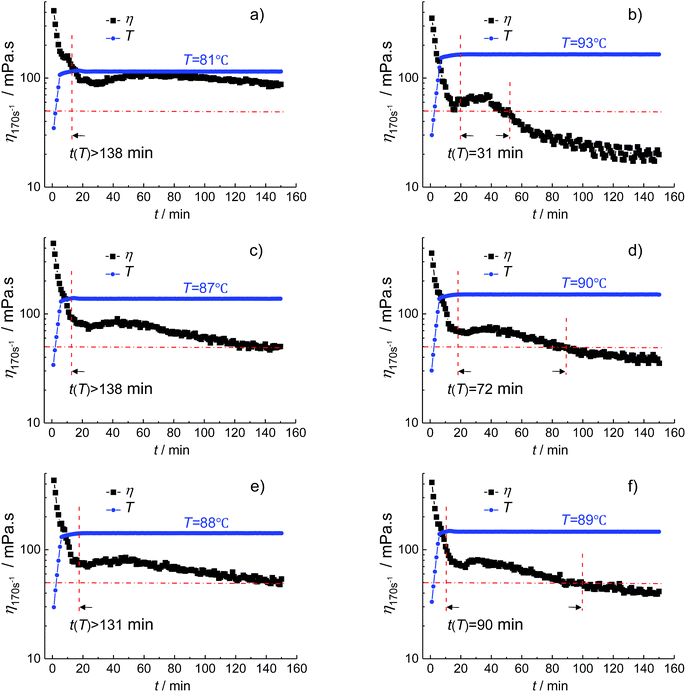 | ||
| Fig. 3 The viscosity–time curves of the fracturing fluid at different temperature. The fracturing fluid is prepared by 0.3 wt% HPG/0.8 wt% Na2B4O7 cross-linked at pH = 9. | ||
4. Influencing factors and mechanisms on the temperature–resistance performance
4.1. Influencing factors
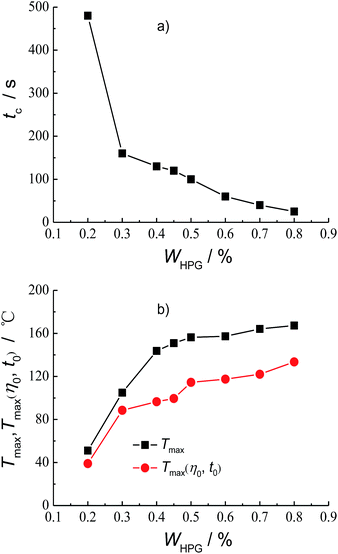
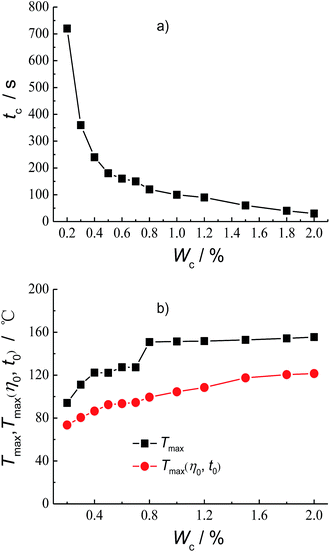
The polymer concentration is a key factor affecting the structure and properties of cross-linked gel fracturing fluid system. Fig. 4 shows the effect of HPG concentration WHPG on the crosslinking time tc, Tmax and Tmax(η0, t0). It can be seen from Fig. 4a that the crosslinking time tc is 480 s when the HPG concentration is 0.2 wt%. The crosslinking time tc will decrease with the increasing of HPG concentration and tc reaches 25 s when the HPG concentration is 0.8 wt%. Considering that the friction is too large at the initial stage of fracturing if the crosslinking is too fast, the HPG concentration isn't further increased in the cross-linked gel fracturing fluid. The experiment results on the evaluation of the temperature–resistance performance of the fracturing fluid at different HPG concentrations are shown in Fig. S1–S7 and Tables S1–S7 at the ESI.† And the effect of HPG concentration on Tmax and Tmax(η0, t0) are summarized in Fig. 4b. It can be seen that the Tmax and Tmax(η0, t0) of the fracturing fluid all increase with the HPG concentration. The Tmax and Tmax(η0, t0) are 51.1 °C and 39 °C when the HPG concentration is 0.2 wt%. When the concentration of HPG increased to 0.45 wt%, the Tmax and Tmax(η0, t0) are 150.9 °C and 99.5 °C, respectively, which increase by 99.8 °C and 60.5 °C as compared to those at 0.2 wt% HPG. Further increasing the concentration of HPG to 0.8 wt% will result in the increase of Tmax for 16.4 °C to 167.3 °C, whereas the Tmax(η0, t0) has gone up 34 °C to 133.5 °C compared to those at 0.45 wt% HPG.Another influencing factor on the crosslink and temperature–resistance properties of the fracturing fluid is the concentration of crosslinking agent. Fig. 5 shows the plots of the crosslinking time tc, Tmax and Tmax(η0, t0) as a function of Na2B4O7 concentration, WC, respectively. It can be seen from Fig. 5a that the crosslinking time tc decreases with the increase of Na2B4O7 concentration. And the crosslinking time tc is 720 s and 30 s for 0.2 wt% Na2B4O7 and 2.0 wt% Na2B4O7, respectively. The experiment results on the evaluation of the temperature–resistance performance of the fracturing fluid at different Na2B4O7 concentrations are shown in Fig. S8–S18 and Tables S8–S18 at the ESI.† And the effect of Na2B4O7 concentration on Tmax and Tmax(η0, t0) are summarized in Fig. 5b. It can be seen that both Tmax and Tmax(η0, t0) of the fracturing fluid increase with Na2B4O7 concentration, but the variation tendencies are different. Within the concentration range of 0.2–0.8 wt%, Tmax increases by 56.8 °C, whereas in the concentration range from 0.8 wt% to 2.0 wt%, Tmax only increases by 4.6 °C. In comparison, Tmax(η0, t0) gradually increases with the increase of Na2B4O7 concentration, e.g. Tmax(η0, t0) increases by 26 °C when the Na2B4O7 concentration changed from 0.2 wt% to 0.8 wt%, meanwhile, the Tmax(η0, t0) increases by 22 °C when the Na2B4O7 concentration increases from 0.8 wt% to 2.0 wt%.
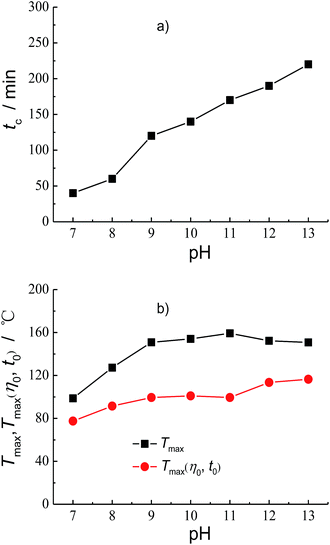
The pH when the crosslinking reaction occurs also affects the properties of fracturing fluid. Fig. 6 shows the effect of pH on the crosslinking time tc, Tmax and Tmax(η0, t0). It can be seen from Fig. 6a that the crosslinking time increases with the increase of pH. The crosslinking time tc is 40 s at pH 7 and 220 s at pH 13. The experiment results on the evaluation of the temperature resistance performance of the fracturing fluid at different pH are shown in Fig. S19–S24 and Tables S19–S24 at the ESI.† And the effect of pH on Tmax and Tmax(η0, t0) are summarized in Fig. 6b. It can be seen that the Tmax increases from 98.7 °C to 159.3 °C when the pH increases from 7 to 11. And then the Tmax gradually decreases after reaching the maximum. The Tmax reduced to 150.8 °C when the pH goes up from 11 to 13. The Tmax(η0, t0) increases from 77.5 °C to 99.5 °C with the pH rising from 7 to 9. However, the Tmax(η0, t0) almost unchanged in the pH range from 9 to 11. When the pH increases to 13, the Tmax(η0, t0) continually increases to 116.5 °C and increases by 17 °C compared with that at pH 11.
4.2. Influencing mechanisms
Through the designed evaluation method, the crosslink and temperature–resistance properties of Na2B4O7 cross-linked HPG fracturing fluid are studied in detail. It is interesting to analysis and discuss the dependence of tc, Tmax and Tmax(η0, t0) on the HPG concentration, the Na2B4O7 concentration and the pH. It is helpful to further clarify the relationship between the measured parameters and gel properties. Firstly, the crosslinking time tc reflects the rate at which the crosslinking of fracturing fluid reaches the gel state. This definition is proposed from the viewpoint of fracturing treatment. If the gel state is achieved, the friction of fracturing fluid in the initial injection process will be remarkably increased.42 It is worth noting that the gel forms in a short time when HPG mixed with Na2B4O7 as shown in Fig. 4a, 5a and 6a. However, the crosslinking reaction is still in progress with time and the gel properties such as strength are also changing. The time when the gel reaches thermodynamic equilibrium (e.g., strength does not change) is called gelation time. Experimental results indicated by Rietjens et al. show the gelation time could go up to 750–22![[thin space (1/6-em)]](https://www.rsc.org/images/entities/char_2009.gif) 000 s when the pH changes from 10.6 to 12.85 for the borate cross-linked HPG fracturing fluid.43 That is why the prepared fracturing fluids are sealed for above 6 hours in this study to obtain the relatively stable gel for evaluating the temperature–resistance performance. Secondly, it can be seen from Table 1, the measured Tmax is the maximum temperature where the apparent viscosity meets the minimum viscosity requirement of fracturing fluid. Thus, the Tmax reflects the viscosifying ability, which is closely related to the molecular weight and distribution of the crosslinking system of the fracturing fluid.44 As the temperature increases, the molecular thermal motion increases in the cross-linked gel system, so the intermolecular distance in the cross-linked gel network increases, which induces the decreases of flow resistance as well as viscosity. Thirdly, the high temperature treatment of the cross-linked gel will lead to the gel degradation owing to the cleavage of crosslinking and chemical bond induced by thermal hydrolysis, the thermal oxidation and other decomposition pathways.45–47 Because the gel degradation is a gradual process, the reduction of viscosity is highly related to the heating time, in other words, the longer the action time, the higher the degree of degradation and the more serious the viscosity decreases. Thus the measured Tmax(η0, t0) comprehensively reflects both the viscosifying ability and the degradation tolerance ability, which is not only closely related to the molecular weight and distribution of the crosslinking system, but also with the degradation process.
000 s when the pH changes from 10.6 to 12.85 for the borate cross-linked HPG fracturing fluid.43 That is why the prepared fracturing fluids are sealed for above 6 hours in this study to obtain the relatively stable gel for evaluating the temperature–resistance performance. Secondly, it can be seen from Table 1, the measured Tmax is the maximum temperature where the apparent viscosity meets the minimum viscosity requirement of fracturing fluid. Thus, the Tmax reflects the viscosifying ability, which is closely related to the molecular weight and distribution of the crosslinking system of the fracturing fluid.44 As the temperature increases, the molecular thermal motion increases in the cross-linked gel system, so the intermolecular distance in the cross-linked gel network increases, which induces the decreases of flow resistance as well as viscosity. Thirdly, the high temperature treatment of the cross-linked gel will lead to the gel degradation owing to the cleavage of crosslinking and chemical bond induced by thermal hydrolysis, the thermal oxidation and other decomposition pathways.45–47 Because the gel degradation is a gradual process, the reduction of viscosity is highly related to the heating time, in other words, the longer the action time, the higher the degree of degradation and the more serious the viscosity decreases. Thus the measured Tmax(η0, t0) comprehensively reflects both the viscosifying ability and the degradation tolerance ability, which is not only closely related to the molecular weight and distribution of the crosslinking system, but also with the degradation process.
The cis-OH pairs on the galactose side chains in HPG molecules can undergo 1–1 and 2–1 crosslinking with borate and the 2–1 crosslinking reaction can be divided into intramolecular and intermolecular crosslinking as illustrated in Fig. 7.2 These cross-linked structures are in dynamic equilibrium in solution. The intermolecular 2–1 crosslinking is effective for the formation of network structure, which significantly increases the molecular weight of the cross-linked gel system and the corresponding viscosity of the fracturing fluid (Fig. 7). With the increase of HPG concentration, more crosslinking sites will appear and higher chance of crosslinking reaction will happen. At the same time, the decrease of intermolecular distance between HPG is more favourable for intermolecular 2–1 crosslinking reaction. Thus, the rate of gelation increases, which leads to the decrease of crosslinking time tc as observed in Fig. 4a. The degree of intermolecular 2–1 crosslinking increases, which makes the increase of the molecular weight of cross-linked gels, and thereby enhances the viscosity. Hence, the Tmax of the cross-linked gel increase with the increase of HPG concentration (see Fig. 4b). When the concentration of crosslinking agent Na2B4O7 is fixed, the crosslinking reaction will approach the upper limit of crosslinking degree accompanied by the increase of HPG concentration.48,49 Although more crosslinking sites at high HPG concentration appears, the excess HPG molecules can only exist as non-cross-linked state. Therefore, in low concentration range (e.g., 0.2–0.45 wt%), the increase of Tmax value caused by the same amount of HPG is greater than that in the high concentration range (e.g., 0.45–0.8 wt%) as shown in Fig. 4b. When the cross-linked gel degrades at high temperature, the non-cross-linked HPG molecules can react with the crosslinking agent Na2B4O7 again. As a result, Tmax changed slightly, but the Tmax(η0, t0) continued to increase in the high HPG concentration range (see Fig. 4b). However, once the cross-linked system degrades at low HPG concentration, the molecular weight of cross-linked gel would decrease significantly. Therefore, the enhancement of Tmax is larger than that of Tmax(η0, t0) by adding the same amount of HPG in the low concentration range (e.g., 0.2–0.45 wt%).
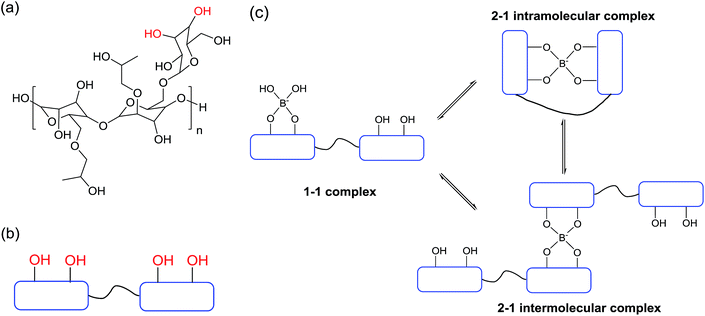 | ||
| Fig. 7 The molecular structure of HPG (a), the simplified molecular structure of HPG (b) and the crosslinking reactions between borax and HPG (c). | ||
Similarly, when the concentration of thickening agent HPG is fixed, the rate of gelation increases and the crosslinking time tc decreases with the increase of the Na2B4O7 concentration (see Fig. 5a). Meanwhile, the increase of Na2B4O7 concentration also promotes the intermolecular 2–1 crosslinking reaction, which results in the increase of the molecular weight and the viscosifying ability of cross-linked gels, and then the increase of Tmax. However, the degree of crosslinking almost reaches maximum when the Na2B4O7 concentration is above 0.8 wt%. So the molecular weight of cross-linked gel does not significantly increase by continue adding Na2B4O7, where Tmax behaves as almost a constant (see Fig. 5b). Meanwhile, those excessive Na2B4O7 can crosslink again with low molecular weight HPG molecules produced by thermal degradation, which could result in the delayed degradation. Therefore, Tmax remains unchanged but the Tmax(η0, t0) continues to increase after the Na2B4O7 concentration was higher than 0.8 wt%. Whereas before reaching the maximum crosslinking degree, the change of Tmax would be greater than that of Tmax(η0, t0) (Fig. 5b).
The crosslinking agent Na2B4O7 will be hydrolyzed in aqueous solution to yield boric acid B(OH)3 and borate anion B(OH)4−. The B(OH)3 exists as a pH dependent equilibrium with the B(OH)4− such that higher pH drives the reaction towards the formation of the B(OH)4−:
| B(OH)3 + H2O = B(OH)4− + H+ |
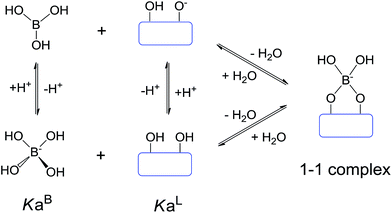
According to the experimental results of 11B NMR spectra, both boric acid and borate ion have been implicated in the crosslinking step to form the 1–1 complex as shown in Fig. 8.50 The 1–1 crosslinking reaction products will continue to undergo intramolecular or intermolecular 2–1 crosslinking reactions with HPG molecules. In the aspect of reaction kinetics, the reaction rate constant of a borate ion with cis-OH pairs is much smaller than that of boric acid.51–55 Therefore, the crosslinking reaction slows down, and the crosslinking time increases with the increase of pH and the corresponding amount of borate ion (Fig. 6a). In the aspect of reaction thermodynamics, it has been derived from equilibrium constants and mass balances that the maximum amount of 1–1 crosslinking reaction products occurs at pH = (pKBa + pKLa)/2,56–58 which will be beneficial for intermolecular 2–1 crosslinking reactions. In addition, larger amounts of NaOH are added to adjust the HPG solution to pH 12 and 13. And another possible situation is that the large number of Na+ shields the electrostatic repulsion among the ionic groups of the HPG chains, which leads to the transformation from extension to coil for the HPG chain conformation, which hinders the intermolecular 2–1 crosslinking reactions.59 So there is a maximum molecular weight of cross-linked gel with the increase of pH, and a maximum of Tmax exists at pH 11. In degradation of the cross-linked gel, thermal oxidative action decreases because the redox potential of O2 decreases and thermal alkaline hydrolysis is enhanced with increasing pH.46–48 The different change trend of molecular weight of the cross-linked gel, thermal oxidative degradation, and thermal hydrolysis makes relatively complex changes of Tmax(η0, t0) with pH (Fig. 6b). At pH 7–9, Tmax(η0, t0) increases with pH mainly because of the increase of the molecular weight of cross-linked gel. At pH 9–11, thermal alkaline hydrolysis is enhanced meanwhile thermal oxidative action decreases and molecular weight increases, which results in little change in Tmax(η0, t0) with increasing pH. At pH 11–13, Tmax(η0, t0) continually increases with pH mainly because of the significant reduction of the thermal oxidative action.
5. Conclusions
In this work, a simple and effective approach has been proposed to evaluate the temperature–resistance performance of fracturing fluid. The temperature–resistance performance can be characterized by measuring the maximum tolerance temperature Tmax(η0, t0). And Tmax(η0, t0) is determined by a step-by-step numerical search method starting from the upper limit temperature Tmax. Based on this evaluation method, the effects of various factors including HPG concentration, Na2B4O7 concentration and pH value on the crosslink and temperature–resistance properties of borate cross-linked hydroxypropyl guar gum fracturing fluid were investigated systematically. The crosslinking time tc decreases with the increase of the HPG concentration or Na2B4O7 concentration, because those chemicals bring more crosslinking sites and the chance of crosslinking reaction also increases. Whereas the crosslinking time tc increases with pH, because the amount of borate ion increases with pH and the reaction rate constant of a borate ion with cis-OH pairs is much smaller than that of boric acid. Interestingly, the variation tendency of Tmax(η0, t0) is different from that of Tmax. Tmax(η0, t0) gradually increases with the increase of the HPG/Na2B4O7 concentration, whereas Tmax increases significantly at low HPG or Na2B4O7 concentration and is almost unchanged at high Na2B4O7 concentration. With the increase of pH, the maximum of Tmax is observed at pH 11 owing to an optimal equilibrium for the intermolecular crosslinking reaction. The complex effects of pH on crosslinking reactions and degradation reactions make relatively complex changes of Tmax(η0, t0) with pH, viz., Tmax(η0, t0) increases at pH 7–9, changes slightly at pH 9–11, and continuously increases at pH 11–13. This study may provide a common method for evaluating the temperature–resistance performance of the fracturing fluid. Our results provide useful insights into the understanding of temperature–tolerance performance of borate cross-linked hydroxypropyl guar gum fracturing fluid, and advance the application to increase well productivity in fields.Conflicts of interest
There are no conflicts to declare.Acknowledgements
This work is supported by Open Fund of State Key Laboratory of Oil and Gas Reservoir Geology and Exploitation (PLN1302), the NSFC program of China (51574267), the Fundamental Research Funds for the Central Universities (15CX08003A), the Program for Changjiang Scholars and Innovative Research Team in University (IRT_14R58) and the National Science Fund for Distinguished Young Scholars (51425406).Notes and references
- M. J. Economides and K. G. Nolte, Reservoir Stimulation, John Wiley and Sons, Ltd, New York, 3rd edn, 2000 Search PubMed.
- R. Barati and J. T. Liang, J. Appl. Polym. Sci., 2014, 131, 318–323 CrossRef.
- G. A. Al-Muntasheri, SPE Prod. Oper., 2014, 29, 243–260 CrossRef.
- A. C. Barbati, J. Desroches, A. Robisson and G. H. Mckinley, Annu. Rev. Chem. Biomol. Eng., 2016, 7, 415–453 CrossRef CAS PubMed.
- H. C. Lau, H. Li and S. Huang, Energy Fuels, 2017, 31, 4588–4602 CrossRef CAS.
- P. C. Harris, J. Pet. Technol., 1993, 45, 264–269 CrossRef CAS.
- H. Quan, Z. Li and Z. Huang, RSC Adv., 2016, 6, 49281–49288 RSC.
- Y. Liu and H. A. Li, SPE Prod. Oper., 2016, 31, 325–336 CrossRef CAS.
- Q. Jiang, G. Jiang, C. Wang, Q. Zhu, L. Yang, L. Wang, X. Zhang and C. Liu, Paper SPE 180595 presented in part at the IADC/SPE Asia Pacific Drilling Technology Conference, Singapore, 2016, DOI:10.2118/180595-MS.
- K. E. Friehauf and M. M. Sharma, Paper SPE 124361 presented in part at the 2009 SPE Annual Technical Conference and Exhibition, New Orleans, Louisiana, USA, 2009, DOI:10.2118/124361-MS.
- Q. Lv, Z. Li, B. Li, S. Li and Q. Sun, Ind. Eng. Chem. Res., 2015, 54, 9456–9477 CrossRef.
- X. Sun, X. Liang, S. Wang and Y. Lu, J. Pet. Sci. Eng., 2014, 119, 104–111 CrossRef CAS.
- T. Huang and J. B. Crews, SPE Prod. Oper., 2007, 24, 60–65 CrossRef.
- Z. Yan, C. Dai, M. Zhao, Y. Sun and G. Zhao, J. Ind. Eng. Chem., 2016, 37, 115–122 CrossRef CAS.
- X. P. Wu, Y. N. Wu, S. Yang, M. W. Zhao, M. W. Gao, H. Li and C. L. Dai, Soft Matter, 2016, 12, 4549–4556 RSC.
- A. Baruah, D. S. Shekhawat, A. K. Pathak and K. Ojha, J. Pet. Sci. Eng., 2016, 146, 340–349 CrossRef CAS.
- Y. Lu, F. Yang, Z. Ge, S. Wang and Q. Wang, J. Nat. Gas Sci. Eng., 2015, 27, 1649–1656 CrossRef.
- W. Kang, P. Wang, H. Fan, H. Yang, C. Dai, X. Yin, Y. Zhao and S. Guo, Soft Matter, 2017, 13, 1182–1189 RSC.
- D. N. Harry, D. E. Putzig, M. Ralph, D. P. Tom and J. Peter, Paper SPE 50731 presented in part at the 1999 SPE International Symposium on Oilfield Chemistry, Houston, Texas, USA, 1999, DOI:10.2118/50731-MS.
- C. Lei and P. E. Clark, SPE J., 2007, 12, 316–321 CrossRef CAS.
- J. Maxey, Y. T. Hu, T. Kishore and D. Loveless, Paper SPE 173726 presented in part at the SPE International Symposium on Oilfield Chemistry, The Woodlands, Texas, USA, 2015, DOI:10.2118/173726-MS.
- S. Trabelsi and S. Kakadjian, Paper SPE 164486, presented in part at the 2013 SPE Production and Operations Symposium, Oklahoma City, 2013, DOI:10.2118/164486-MS.
- G. P. Funkhouser, J. Holtsclaw and J. Blevins, Paper SPE 132173 presented in part at the SPE Deep Gas Conference and Exhibition, Manama, Bahrain, 2010. SPE-132173-MS Search PubMed.
- L. Song and Z. Yang, Paper IPTC 18597 presented in part at the International Petroleum Technology Conference, Bangkok, Thailand, 2016, DOI:10.2118/18597-MS.
- A. Baruah, A. K. Pathak and K. Ojha, AIChE J., 2016, 62, 2177–2187 CrossRef CAS.
- A. Baruah, A. K. Pathak and K. Ojha, Chem. Eng. Sci., 2015, 131, 146–154 CrossRef CAS.
- A. Baruah, A. K. Pathak and K. Ojha, Ind. Eng. Chem. Res., 2015, 54, 7640–7649 CrossRef CAS.
- J. Mao, X. Yang, D. Wang, Y. Li and J. Zhao, RSC Adv., 2016, 6, 88426–88432 RSC.
- J. Holtsclaw and G. P. Funkhouser, SPE Drill. Completion, 2010, 25, 555–563 CrossRef CAS.
- H. Quan, Z. Li and Z. Huang, RSC Adv., 2016, 6, 49281–49288 RSC.
- K. Sokhanvarian, H. A. Nasr-El-Din and T. L. Harper, Paper SPE 176837 presented in part at the SPE Asia Pacific Unconventional Resources Conference and Exhibition, Brisbane, Australia, 2015, DOI:10.2118/176837-MS.
- R. A. Kalgaonkar and P. R. Patil, Paper SPE 151890, presented in part at the SPE Oil and Gas India Conference and Exhibition, Mumbai, India, 2012, DOI:10.2118/151890-MS.
- W. Xiaolan, Q. Qi, M. Scott, N. Jonathon, B. Kody and L. Neumann, Paper SPE 73789 presented in part at the SPE International Symposium and Exhibition on Formation Damage Control, Lafayette, Louisiana, 2002, DOI:10.2118/73789-MS.
- Y. Lv, Y. Feng, Z. Wang, A. Li, Q. Zhang, B. Huang, J. Zuo, Z. Ren and Y. Chen, Paper SPE 184577 presented in part at the SPE International Conference on Oilfield Chemistry, Montgomery, Texas, USA, 2017, DOI:10.2118/184577-MS.
- L. Wang, Z. Wen, C. Bo, Y. Lu and X. Qiu, Paper SPE 26364 presented in part at the Offshore Technology Conference Asia, Kuala Lumpur, Malaysia, 2016, OTC-26364-MS Search PubMed.
- R. Kalgaonkar and P. Patil, Paper SPE 152040 presented in part at the North Africa Technical Conference and Exhibition, Cairo, Egypt, 2012, DOI:10.2118/152040-MS.
- A. M. Elsarawy, H. A. Nasr-El-Din and K. E. Cawiezel, Paper SPE 180215 presented in part at the SPE Low Perm Symposium, Denver, Colorado, USA, 2016, DOI:10.2118/180215-MS.
- H. M. Fan, Z. X. Wang, H. J. Fan, H. G. Zhou, J. Q. Zuo, K. Chen, Z. L. Wang, W. L. Kang and C. L. Dai, J. China Univ. Pet., Ed. Nat. Sci., 2017, 41, 160–166 Search PubMed.
- B. L. Chen, Theory and Algorithms of Optimization, Tsinghua University Press, Beijing, 2005 Search PubMed.
- Q. Li, Z. X. Wang, L. Y. Shen, Y. J. Wang and X. Y. Li, Drill. Fluid Completion Fluid, 2016, 33, 57–62 Search PubMed.
- Cn-Sy, SY/T 6376-2008, General technical specifications of fracturing fluids[s], National Development and Reform Commission, China, 2008 Search PubMed.
- P. C. Harris and A. Sabhapondit, Paper SPE 120029 presented in part at the 2009 SPE Middle East Oil and Gas Show and Conference, Bahrain, Bahrain, 2009, DOI:10.2118/120029-MS.
- M. Rietjens and P. A. Steenbergen, Eur. J. Inorg. Chem., 2005, 2005, 1162–1174 CrossRef.
- I. Teraoka, Polymer Solutions: An Introduction to Physical Properties, 2002 Search PubMed.
- O. Bobleter, ChemInform, 2010, 29, 893–936 CrossRef.
- V. Soldi, in Polysaccharides: Structural Diversity and Functional Versatility, ed. Dumitriu, CRC Press, London, UK, 2nd edn, 2004, ch. 14, pp. 395–409 Search PubMed.
- R. Kivelä, T. Sontag-Strohm, J. Loponen, P. Tuomainen and L. Nyström, Carbohydr. Polym., 2011, 85, 645–652 CrossRef.
- K. Dusek and M. Duskova-Smrckova, Prog. Polym. Sci., 2000, 25, 1215–1260 CrossRef CAS.
- J. Q. Jiang, B. Qi, M. Lepage and Y. Zhao, Macromolecules, 2007, 40, 790–792 CrossRef CAS.
- J. A. Peters, Coord. Chem. Rev., 2014, 268, 1–22 CrossRef CAS.
- M. Bishop, N. Shahid, J. Yang and A. R. Barron, Dalton Trans., 2004, 2621–2634 RSC.
- S. Iwatsuki, S. Nakajima, M. Inamo, H. D. Takagi and K. Ishihara, Inorg. Chem., 2007, 46, 354–356 CrossRef CAS PubMed.
- Y. Yamamoto, T. Matsumura, N. Takao, H. Yamagishi, M. Takahashi, S. Iwatsuki and K. Ishihara, Inorg. Chim. Acta, 2005, 358, 3355–3361 CrossRef CAS.
- E. Watanabe, J. Fujii, K. Kojima, S. Iwatsuki, M. Inamo, H. D. Takagi and K. Ishihara, Inorg. Chem. Commun., 2010, 13, 1406–1409 CrossRef CAS.
- H. Monajemi, M. H. Cheah, V. S. Lee, S. M. Zain and A. T. W. A. Wan, RSC Adv., 2014, 4, 10505–10513 RSC.
- M. V. Duin, J. A. Peters, A. P. G. Kieboom and H. V. Bekkum, Tetrahedron, 1984, 40, 2901–2911 CrossRef.
- J. Yan, G. Springsteen, S. Deeter and B. Wang, Tetrahedron, 2004, 60, 11205–11209 CrossRef CAS.
- M. A. Martínez-Aguirre, R. Villamil-Ramos, J. A. Guerrero-Alvarez and A. K. Yatsimirsky, J. Org. Chem., 2013, 78, 4674–4684 CrossRef PubMed.
- S. Wang, H. Tang, J. Guo and K. Wang, Carbohydr. Polym., 2016, 147, 455–463 CrossRef CAS PubMed.
Footnote |
| † Electronic supplementary information (ESI) available. See DOI: 10.1039/c7ra11687j |
| This journal is © The Royal Society of Chemistry 2017 |

