 Open Access Article
Creative Commons Attribution 3.0 Unported Licence
An on–off–on gold nanocluster-based fluorescent probe for sensitive detection of organophosphorus pesticides
Q. J. Luoa,
Z. G. Lib,
J. H. Laib,
F. Q. Lic,
P. Qiu *a and
X. L. Wangd
aDepartment of Chemistry, Nanchang University, Nanchang 330031, China. E-mail: pingqiu@ncu.edu.cn
bJiangxi Medical Device Testing Center, Nanchang 330047, China
cDepartment of Chemistry, East China University of Technology, Nanchang 330013, China
dInstitute of Translational Medicine, Nanchang University, Nanchang, Jiangxi 330088, China
First published on 5th December 2017
Abstract
In this study, a highly sensitive fluorescent probe based on bovine serum protein-protected gold nanoclusters (BSA-AuNCs) was developed for the determination of organophosphorus pesticides (OPs). At first, BSA-AuNCs were prepared using a photo stable fluorescent substrate. Acetylcholinesterase (AChE) catalyzes the hydrolysis of acetylthiocholine iodide (ATCI) to produce thiocholine (TCh), and the sulfhydryl groups (SH–) on TCh form Au–S bonds with BSA-AuNCs; thus, the fluorescence of BSA-AuNCs weakens. On the other hand, OPs can inhibit the activity of AChE, thus preventing the generation of TCh, and the fluorescence recovery of BSA-AuNCs occurs. Under optimized experimental conditions, parathion-methyl (PM) was detected in the concentration range of 0.33–6.67 ng mL−1 with a detection limit of 0.14 ng mL−1 (S/N = 3), which is much lower than the maximum residue limits reported in the European Union pesticides database as well as that defined by the U.S. Department Agriculture. Moreover, the assay demonstrated highly sensitive applications in the quantitative determination of OPs in water and food samples.
Introduction
Organophosphorus pesticides (OPs) have been widely used in agriculture to improve the yield of crops and vegetables.1–5 However, the extensive use and inappropriate treatment of OPs can cause serious environmental pollution and destroy the ecosystem. Because of the incorrect and excessive use of OPs, OPs may remain as residues in crops, fruits, and vegetables.6,7 The maximum residue limit reported in the European Union pesticides database is 0.01 ppm,5 and the maximum contamination level of 0.001–0.25 mg L−1 for organophosphorus pesticides is defined by the U.S. Environmental Protection Agency (EPA).9 Moreover, the residues of OPs are harmful for human beings even at low concentrations.10–13 Thus, a highly sensitive method for the detection of OPs is urgently required to ensure food and environment safety. Many methods, including high performance liquid chromatography (HPLC),14,15 liquid/gas chromatography-mass spectrometry,16–19 electrochemical analysis,20–23 and enzyme-linked immunosorbent assays (ELISAs),24 have been reported for the detection of OPs. However, these assays need sophisticated instruments, tedious sample pre-treatment or purification procedures, and costly biomolecular reagents and are time consuming. To improve the sensitivity of detection, different kinds of fluorescent nanomaterials have been used such as quantum dots and nano-probes.25–29 Therefore, fluorescence measurements have been successfully developed as a qualitative and quantitative screening tool for the detection of OPs.In the past decade, metallic nanoparticles have been used as probes to detect OPs because they exhibit unique physical and chemical properties.30 In 2012, Liu et al. developed an assay based on gold nanoparticles for the determination of organophosphorus and carbamate pesticides.8 In 2017, Luo. et al. prepared AgNP–rhodamine B to detect carbamate pesticides with an LOD of 0.023 ng L−1.31 In addition to metallic NPs, fluorescent metallic nanoclusters (NCs) are widely used in the most promising applications as promising materials for sensing enzyme-related reactions because of their ultrasmall size (size-dependent emission wavelength), large Stokes displacement, good biocompatibility, satisfactory water solubility, and satisfactory photostability.32,33 Precious metal nanoclusters (NCs) usually consist of several to hundred metal atoms, and their size is less than 2 nm. Compared with semiconductor quantum dots (QDs) and organic dyes, NCs are ultrasmall and nontoxic and show high fluorescence and good biocompatibility; this means that they can be used for biological testing such as in biological imaging, specific protein detection, and biosensing. They can also be applied for the detection of pesticides and heavy metal ions such as AgNC assay for Cu2+ and Hg2+ and AuNCs for the recognition of Cu2+ and vitamin C based on fluorescent nanometers.34–38 In previous studies, a simple and green synthesis method has been proposed for the preparation of AuNCs using bovine serum albumin (BSA) as a stabilizing and reducing agent. BSA-protected AuNCs belong to the monolayer protected nanoclusters and are photo stabile, non-toxic, and biocompatible.39 In 2017, Zhao and co-workers reported a photo electrochemical method for the detection of hydrogen peroxide and dopamine based on BSA-AuNCs.40 A highly sensitive sensor based on resonance energy transfer for salicylaldehyde and zinc(II) ion detection by BSA-AuNCs has been developed by Liu and coworkers.41 Zhang and co-workers demonstrated a homogeneous assay method for the detection of Hg2+ ions by BSA-AuNCs. All the abovementioned methods are based on BSA-AuNCs.42 Due to the properties of metal nanoclusters, significant research efforts have been dedicated towards the design of fluorescent probes.
Although enzymes are becoming popular as analytical tools, their specific characteristics, such as selectivity, sensitivity, stability, and accuracy, still need to be optimized. To improve these, researchers are focusing on a new biomolecule strategy for the production of protein engineered with Tailor-made properties to improve enzyme performance.43 The use of new materials, including nanomaterials and nanostructures, should be a good choice. The enzyme biosensor with AuNCs as a fluorescent probe improved the detection efficiency and accuracy of pesticide detection. In 2017, Du's group prepared carbon quantum dots and butyrylcholinesterase (BChE) to detect OPs via fluorescence resonance energy transfer.26 In 2006, a highly sensitive enzyme biosensor based on self-assembled acetylcholinesterase (AChE) on a carbon nanotube (CNT)-modified glassy carbon (GC) electrode was described by Liu and his partner for the detection of organophosphate pesticides and nerve agents.44 According to previous studies, AChE is the most frequently used enzyme for the detection of OPs. This is because OPs can inhibit the catalytic activity of AChE with high selectivity. AChE is also a significant neural enzyme in the process of nerve impulse transmission, which can specifically catalyze the hydrolysis of acetylthiocholine iodide (ATCI), an accentual neurotransmitter, to acetic acid and choline (TCh).45,46 Pesticide poisoning occurs due to inhibition of AChE activity by a pesticide, resulting in functional failures in the human body; it has also been widely used in the detection of pesticides for environmental monitoring and food safety aspects.
In this study, we prepared a BSA-AuNC/AChE fluorescent probe to detect organophosphorus pesticides (parathion-methyl was selected as a representative OP to investigate the analytical performance of the proposed fluorescent probe) along with BSA-AuNCs. AChE catalyzes the hydrolysis of ATCI to produce TCh, and the sulfhydryl groups (SH–) on TCh form Au–S bonds with BSA-AuNCs; thus, the fluorescence of BSA-AuNCs weakens. When the activity of AChE is inhibited by OPs, the generation of TCh is prevented, and then, the fluorescence of BSA-AuNCs recovers. It was concluded that the degree of fluorescence recovery was proportional to the concentration of OPs. The BSA-AuNC/AChE fluorescent probe can be a reliable option to determine OPs in foods and water.
Experimental
Materials and reagents
Bovine serum albumin (BSA), acetylcholinesterase (AChE, 987 units mg−1), acetylcholine iodide (ATCI), and tetrachloroauric acid trihydrate (HAuCl4·3H2O) were purchased from Sigma-Aldrich chemical Co. (St. Louis, MO, USA). Tris–HCl buffer (pH = 7.5) was used to dissolve AChE (1 unit mL−1). The solution of ATCI (10 mmol L−1) was freshly prepared in ultrapure water, and it could not be used for more than 3 h. Parathion-methyl (PM) was purchased from the Nation Institute of Metrology, China. The pesticides (0.01 mg mL−1) were used without further purification and dissolved in methanol. All solutions used in the experiments were stored at 4 °C and used immediately for the experiments. All chemical used were analytical grade reagents, and all glassware was cleaned by aqua regia and double-distilled water more than three times. Ultrapure water was prepared using the Europtronic pure system and used for solution preparation.Instrumentation
Fluorescence emission spectra were obtained by an LS-55 luminescence spectrometer (Perkin Elmer Co., MA, USA). Transmission electron microscopy (TEM) images were obtained using JEM-2100 (JEOL Co., Japan). The associated point and linear resolutions were 0.23 nm and 0.14 nm, respectively, and the operational accelerating voltage was 200 kV. The sample for TEM characterization was prepared by placing a drop of the solution on a carbon-coated copper grid and drying it at room temperature.Preparation of BSA-AuNCs and BSA-AuNCs/AChE
According to the previous literature,47 BSA-AuNCs were prepared as follows: HAuCl4·3H2O (5.8 mmol L−1) and BSA (19.2 mg mL−1) were mixed under vigorous stirring to form a homogeneous solution. After 2 min, NaOH (38 mmol L−1) was used to adjust the acidity of the mixture solution (pH = 10). After five minutes, the mixed solution was kept at 100 °C and incubated for 1 h. The resulting solution was then cooled down to room temperature and stored at 4 °C.BSA-AuNCs (20 μL) were mixed with AChE (120 μL, 10 unit mL−1) and ATCh (40 μL, 10 mmol L−1), and then, the mixture was incubated for 20 min at 37 °C in a constant temperature water bath. Finally, we used a fluorescence spectrometer to obtain the fluorescence signal of BSA-AuNC/AChE. If the fluorescence of BSA-AuNCs was close to quenching, it indicated that the BSA-AuNC/AChE fluorescent probe was successfully prepared.
Detection of PM
The BSA-AuNC/AChE fluorescent probe was used to detect PM. At first, PM at different concentrations was added to BSA-AuNC/AChE. After incubation of the mixture solution in a constant temperature water bath for 20 min, ATCI was added to the mixture solution. After 15 minutes, the fluorescence signal of the solution was obtained by a fluorescence spectrometer.Pretreatment of real samples
In this study, lake water, apple, and cucumber were used for spiked experiments. The water samples (about 500 mL) were spiked with PM at different amounts (1, 2.5, and 5 ng mL−1), then filtered, and centrifuged to remove any solid impurities. A drop of phosphoric acid and 1.0 mL ferrous sulfate solution (0.1 mol L−1) were added to each water sample (250 mL) to remove any free chloride ions and oxidants. This treatment was followed by the addition of a 1.0 mL copper sulfate solution, which was added to eliminate any microorganisms in the sample. Finally, the water samples were distilled and obtained.The apples and cucumbers sprayed with OPs were chopped into pieces and then crushed to homogenates. The obtained homogenates (20 g) were dissolved in 20 mL of methanol, the resultant dispersion was filtered with a membrane to get rid of the insoluble matrixes,8 and the juice was obtained for further experiments.
Results and discussion
Characterization of the BSA-AuNCs
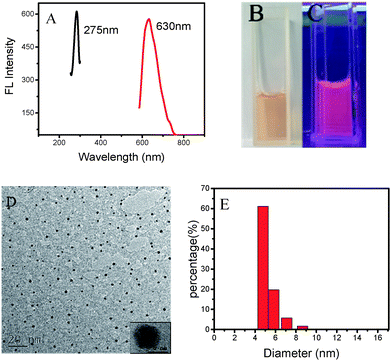
The fluorescent AuNCs were synthesized using BSA as a template and a stabilizer. BSA is a protein and suitable for the preparation of AuNCs. Fig. 1A shows that the BSA-AuNCs exhibit maximum emission at 630 nm (red line) with the excitation wavelength of 275 nm (black line); this confirms the fluorescent feature of the BSA-AuNCs. Fig. 1B and C show the images of the BSA-AuNCs under sunlight (light yellow) and under an ultraviolet lamp with a wavelength of 365 nm, respectively. It is found that BSA-AuNCs emit strong red fluorescence. The morphology of the obtained AuNCs was characterized by TEM. As displayed in Fig. 1D, BSA-AuNCs were well dispersed and revealed a spherical morphology with an average diameter around 5 nm (Fig. 1E). These results indicated that BSA-encapsulated AuNCs with bright fluorescence were successfully obtained using BSA as a precursor. Thus, BSA-AuNCs could be applied for fabrication of fluorescent probes.Mechanism of the fluorometric assay for PM
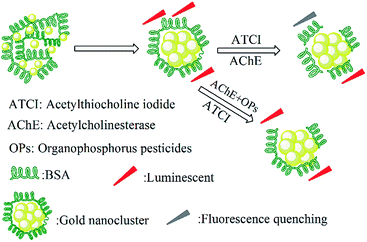
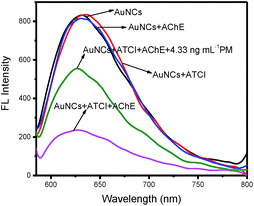
BSA is composed of 35 thiol groups including 17 disulfide bonds and 1 free radical, and it has been widely used in the preparation of AuNCs. Because these groups on BSA have a special affinity to Au, stable gold nanoclusters can be obtained by the protection of BSA. In the preparation of BSA-AuNCs, we kept the reaction solution at pH = 10 because BSA was able to stabilize Au3+ under this condition. On the other hand, Au3+ could also react with the tyrosine residues in BSA. This redox reaction reduces Au3+ to Au+ or Au to achieve AuNCs. BSA-AuNCs are strong fluorescent materials, which have been selected as a fluorescent probe to design a BSA-AuNC/AChE fluorescent probe for the detection of PM. AChE can catalyze the hydrolysis of ATCI to produce TCh with sulfhydryl groups (–SH), which have a strong covalent effect on gold atoms in BSA-AuNCs to form Au–S bonds; thus, the protective effect of BSA on gold nanoclusters is weakened; this results in fluorescence quenching. However, OPs can inhibit the activity of AChE, and the hydrolysis of ATCI to generate TCh gradually becomes slow. This means that BSA-AuNCs are released gradually, and then, the fluorescence recovers. The mechanism of the detection of OPs by the BSA-AuNC/AChE fluorescent probe is shown in Fig. 2. According to the detection mechanism, we designed an ON–OFF–ON BSA-AuNC/AChE fluorescent probe for the detection of OPs.The fluorescence quenching of BSA-AuNCs was caused by TCh, which was produced by the hydrolysis of ATCI catalyzed by AChE. To verify this, the fluorescence of BSA-AuNCs interacting with AChE, ATCI, and a mixture of AChE and ATCI is investigated separately. The experimental results are shown in Fig. 3. When AChE and ATCI were added to BSA-AuNCs, there had no significant effect on the fluorescence of BSA-AuNCs. However, once the mixture of AChE and ATCI was added to BSA-AuNCs, the fluorescence of BSA-AuNCs was quenched partially. The sulfhydryl group on TCh has a strong covalent effect on Au to form Au–S bonds. Therefore, when the interaction between BSA and Au was weakened, the protective effect of BSA on fluorescent nanoclusters became weak, and the fluorescence of AuNCs was quenched finally. The fluorescence quenching is the OFF BSA-AuNC/AChE fluorescent probe. On the other hand, OPs have an inhibitory effect on the activity of AChE, and the fluorescence of BSA-AuNCs is restored. The recovery of fluorescence is the ON process of the BSA-AuNC/AChE fluorescent probe.
Optimization of the BSA-AuNC/AChE fluorescent probe
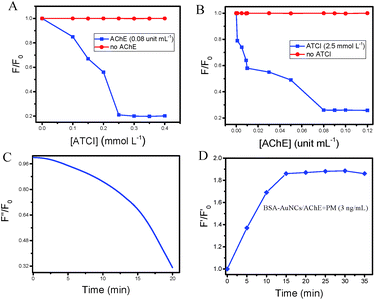
Based on the experimental results, it can be concluded that BSA-AuNCs have strong fluorescence intensity at low concentrations. For the optimal test condition for the detection of OPs by the BSA-AuNC/AChE fluorescent probe, we optimized the concentrations of AChE and ATCI to make the fluorescence of BSA-AuNCs almost quenched. Different concentrations of AChE (0, 0.001, 0.005, 0.009, 0.01, 0.03, 0.05, 0.07, 0.08, 0.09, and 0.1 unit mL−1) and ATCI (0, 0.15, 0.2, 0.25, and 0.3 mmol L−1) were used to detect the fluorescence intensity of the BSA-AuNCs at the maximum emission wavelength. As shown in Fig. 4A and B, BSA-AuNCs have the greatest degree of fluorescence quenching when the concentrations of ATCI and AChE are 0.25 mmol L−1 and 0.08 unit mL−1, respectively. The plot of F/F0 is inversely proportional to the concentration of ATCI and AChE (F is the fluorescence intensity of BSA-AuNCs with different concentrations of ATCI and AChE and F0 is the fluorescence intensity of BSA-AuNCs). Therefore, to prepare a sensitive BSA-AuNC/AChE fluorescent probe, 0.08 unit mL−1 of AChE and 0.25 mmol L−1 of ATCI were selected.To study the time of quenching of BSA-AuNCs by AChE catalyzed hydrolysis of ATCI to produce TCh, we investigated the kinetics of the reaction time to determine the optimal time required for preparing the BSA-AuNC/AChE fluorescent probe. In Fig. 4C, F′′ represents the fluorescence intensity of the BSA-AuNCs with respect to the reaction time, and F0 is the initial fluorescence intensity of BSA-AuNCs. It was found that the time required to prepare an excellent BSA-AuNC/AChE fluorescent probe was 20 minutes. In addition, we optimized the detection time for OPs. As can be seen from Fig. 4D (F′ and F′0 are the fluorescence intensities of the BSA-AuNC/AChE with and without PM, respectively), F′/F′0 increased with time and tended to be stable after 15 minutes. Based on the optimal experimental results, we chose the best conditions for the experiment to detect the OPs.
Sensitivity of the BSA-AuNC/AChE fluorescent probe
The sensitivity of the fluorescent probe is one of the important factors in analysis. It was previously noted that the fluorescence of BSA-AuNCs became weaker after the addition of AChE and ATCI. The OPs are an inhibitor of acetylcholinesterase, and the catalytic activity of acetylcholinesterase is inhibited by its pretreatment with OPs. The fluorescence intensity of BSA-AuNCs recovers proportionally with the concentration of OPs. To test the performance of this analytical method, we used the BSA-AuNC/AChE fluorescent probe to detect PM under the optimum conditions. PM solutions of different concentrations were added to the cuvettes containing the AChE (120 μL, 0.08 unit mL−1) solution; ATCI (40 μL, 0.25 mmol L−1) and the BSA-AuNCs (20 μL, 0.03 mmol L−1) were then mixed with the contents in the cuvettes. Finally, a fluorescence spectrometer was used to analyze the fluorescence intensity of the fluorescent probe. Fig. 5A shows that the fluorescence intensity of the maximal emission at 630 nm varied with respect to the concentration of PM. It was found that F′/F′0 was linear with the PM concentration in the range of 0.33–6.67 ng mL−1 (Fig. 5B); the LOD was 0.14 ng mL−1 (S/N = 3), and the correlation coefficient was 99.82%. The linear equation can be indicated as follows:| F′/F′0 = 0.38[PM] + 0.85 |
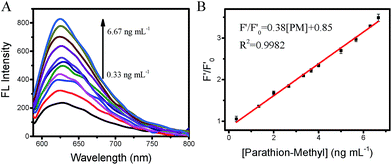 | ||
| Fig. 5 Sensitivity of the BSA-AuNC/AChE fluorescent probe. (A) Fluorescence spectra of BSA-AuNCs with the increasing concentrations of PM. (B) The plot of F′ and F′0 versus concentrations of PM. | ||
Specificity of the BSA-AuNC/AChE fluorescent probe
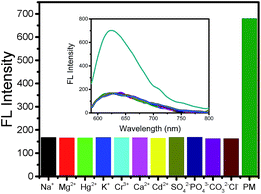
To confirm the ability of the sensing platform to display a selective and specific analytical performance, many inorganic ions and organic compounds were chosen as interfering compounds. Consequently, analyses were carried out to investigate the interference effects of some organic compounds, i.e. PM (0.13 μmol L−1), and inorganic ions, i.e. Na+, Mg2+, Hg2+, K+, Cr3+, Ca2+, Cd2+, SO42−, PO43−, CO32−, and Cl− (the concentrations of all ions were 1 μmol L−1), that might coexist with the OPs in real samples. As shown in Fig. 6, the addition of interfering ions did not affect the fluorescence of BSA-AuNC/AChE; however, the BSA-AuNC/AChE fluorescence recovered after the addition of parathion methyl; this indicated that the BSA-AuNC/AChE fluorescent probe reacted with PM with specificity and selectivity.Analytical application in real samples
OPs are often used to control pests in fruits and vegetables and easily retained in the fruit epidermis or with watering, rainfall, and other processes into the lake. The novel analytical method was also applied for the quantitative determination of OPs in spiked water samples and food. In practice, the residue of OPs is a well-recognized worldwide problem. Lake water, apple, and cucumber were chosen as the sample matrices to evaluate the PM residue levels in the real application tests of this pesticide assay. For spiked experiments, the analysis was performed with the use of the calibration curves. Different volumes of PM stock solutions were incubated in the prepared 1.0 mL of the real sample (lake water, apple, and cucumber juice), and then, BSA-AuNC/AChE and ATCI were added. The mixture was then scaled to 1.5 mL by distilled water. The data were obtained using a fluorescence spectrometer. The results are shown in Table 1. The recovery rate results of the spiked three samples were satisfactory, being in the range of 78.20–94.80%, 68.40–90.00%, and 103.00–121.00% with the average values of 86.33%, 77.87%, and 111.30% (Table 1), respectively. The relative standard deviation (RSD) ranges were 1.01–2.67%, 2.59–5.78%, and 1.20–7.72%. Compared with some other reported methods (Table 2), the fluorescent probe developed in this study showed several advantages. The instrument has simple operation, short detection time, simple sample pretreatment, and improved LOD when used for the determination of OPs in real samples. These results indicated that the novel method was a practical and an inexpensive alternative for the analysis of OPs in water and food samples.| Sample (n = 5) | Spiked (ng mL−1) | Found (ng mL−1)/(ng g−1) | Recovery (%) | RSD (%) |
|---|---|---|---|---|
| Lake water | 0.00 | 0.00 | 0.00 | 0.00 |
| 1.00 | 0.86 | 86.0 | 1.89 | |
| 2.50 | 2.37 | 94.8 | 1.01 | |
| 5.00 | 3.91 | 78.2 | 2.67 | |
| Apple | 0.00 | 0.00 | 0.00 | 0.00 |
| 1.00 | 0.90 | 90.0 | 2.59 | |
| 2.50 | 1.71 | 68.4 | 5.78 | |
| 5.00 | 3.76 | 75.2 | 3.31 | |
| Cucumber | 0.00 | 0.00 | 0.00 | 0.00 |
| 1.00 | 1.21 | 121 | 7.72 | |
| 2.50 | 2.75 | 110 | 2.92 | |
| 5.00 | 5.16 | 103 | 1.20 |
| Probe | Measurement | Pesticide | LOD | Reference |
|---|---|---|---|---|
| GCE/3DGH–AuNPs/APO | Electrochemical | DCNP | 3.45 n mol L−1 | 48 |
| Chitosan–TiO2–graphene | Electrochemical | Dichlorvos | 29 n mol L−1 | 49 |
| CdS-decorated graphene | Amperometric | Acephate | 0.7 μg L−1 | 50 |
| Sol–gel derived silica inks | Colorimetric | Paraoxon | 2 μg L−1 | 51 |
| Dopant of acetone | Ion mobility spectrometer | Fenthion | 0.07 mg L−1 | 52 |
| BSA-AuNCs/AChE | Fluorescence | Parathion-methyl | 0.14 μg L−1 | this work |
Conclusions
A novel, sensitive method for the analysis of OPs, as represented by PM, was developed with the use of the BSA-AuNCs as effective analytical probes. The method is based on the catalysis of ATCI by AChE to form TCh, which is the main factor for the fluorescence quenching of BSA-AuNCs. The key fluorescence property is affected by the OPs because they can inhibit the activity of AChE, and the degree of fluorescence recovery of the fluorescent probe is proportional to the concentration of OPs. The analysis of PM in an aqueous medium provides satisfactory results; moreover, the method is more sensitive than conventional methods.Conflicts of interest
There are no conflicts of interest to declare.Acknowledgements
This work was financially supported by the National Natural Science Foundation of China (21765015 to P. Qiu, 21461015 to X. Wang), the Open Funds of the State Key Laboratory of Electroanalytical Chemistry (SKLEAC201602 to P. Qiu), the Science Foundation of Jiangxi Province (KJLD14010 and 20153BCB23035 to X. Wang), and the Jiangxi Province Food and Drug Administration Science Foundation (2016SP04), China.References
- Z. Zheng, X. Li, Z. Dai, S. Liu and Z. Tang, J. Mater. Chem., 2011, 21, 16955–16962 RSC.
- K. Zhang, Q. Mei, G. Guan, B. Liu, S. Wang and Z. Zhang, Anal. Chem., 2010, 82, 9579–9586 CrossRef CAS PubMed.
- Y. M. Si, N. Zhang, Z. Z. Sun, S. Li, L. Y. Zhao, R. Li and H. Wang, Analyst, 2014, 139, 5466–5471 RSC.
- Y. H. Yi, G. B. Zhu, C. Liu, Y. Huang, Y. Y. Zhang, H. T. Li, J. N. Zhao and S. Z. Yao, Anal. Chem., 2013, 85, 11464–11470 CrossRef CAS PubMed.
- Q. Long, H. T. Li, Y. Y. Zhang and S. Z. Yao, Biosens. Bioelectron., 2015, 68, 168–174 CrossRef CAS PubMed.
- X. Gao, G. Tang and X. Su, Biosens. Bioelectron., 2012, 36, 75–80 CrossRef CAS PubMed.
- X. Yan, H. Li, X. Han and X. Su, Biosens. Bioelectron., 2015, 74, 277–283 CrossRef CAS PubMed.
- D. Liu, W. Chen, J. Wei, X. Li, Z. Wang and X. Jiang, Anal. Chem., 2012, 84, 4185–4191 CrossRef CAS PubMed.
- Z. Cui, C. Han and H. Li, Analyst, 2011, 136, 1351–1356 RSC.
- C. F. Chow, K. Y. F. Ho and C. B. Gong, Anal. Chem., 2015, 87, 6112–6118 CrossRef CAS PubMed.
- M. S. Kim, G. W. Kim and T. J. Park, Biosens. Bioelectron., 2015, 67, 408–412 CrossRef CAS PubMed.
- S. Qian and H. Lin, Anal. Chem., 2015, 87, 5395–5400 CrossRef CAS PubMed.
- X. Yan, H. Li, T. Hu and X. Su, Biosens. Bioelectron., 2017, 91, 232–237 CrossRef CAS PubMed.
- R. Eisert and J. Pawliszyn, Anal. Chem., 1997, 69, 3140–3147 CrossRef CAS.
- G. Hamscher, S. Sczesny, H. Hoper and H. Nau, Anal. Chem., 2002, 74, 1509–1518 CrossRef CAS PubMed.
- M. Anastassiades, S. J. Lehotay, D. Stajnbaher and F. J. Schenck, J. AOAC Int., 2003, 86, 412–431 CAS.
- N. M. Brito, S. Navickiene, L. Polese, E. F. G. Jardim, R. B. Abakerli and M. L. Ribeiro, J. Chromatogr. A, 2002, 957, 201–209 CrossRef CAS PubMed.
- J. Lee and H. K. Lee, Anal. Chem., 2011, 83, 6856–6861 CrossRef CAS PubMed.
- P. Paya, M. Anastassiades, D. Mack, I. Sigalova, B. Tasdelen, J. Oliva and A. Barba, Anal. Bioanal. Chem., 2007, 389, 1697–1714 CrossRef CAS PubMed.
- S. Viswanathan, H. Radecka and J. Radecki, Biosens. Bioelectron., 2009, 24, 2772–2777 CrossRef CAS PubMed.
- Q. Yang, Q. Sun, T. Zhou, G. Shi and L. Jin, J. Agric. Food Chem., 2009, 57, 6558–6563 CrossRef CAS PubMed.
- A. Chen, D. Du and Y. Lin, Environ. Sci. Technol., 2012, 46, 1828–1833 CrossRef CAS PubMed.
- D. Du, J. Wang, L. Wang, D. Lu and Y. Lin, Anal. Chem., 2012, 84, 1380–1385 CrossRef CAS PubMed.
- G. Qian, L. Wang, Y. Wu, Q. Zhang, Q. Sun, Y. Liu and F. Liu, Food Chem., 2009, 117, 364–370 CrossRef CAS.
- Y. Zhao, Y. Ma, H. Li and L. Wang, Anal. Chem., 2012, 84, 386–395 CrossRef CAS PubMed.
- Y. M. Si, Z. Z. Sun, N. Zhang, W. Qi, S. Y. Li, L. J. Chen and H. Wang, Anal. Chem., 2014, 86, 10406–10414 CrossRef CAS PubMed.
- X. Wu, Y. Song, X. Yan, C. Zhu, Y. Ma, D. Du and Y. Lin, Biosens. Bioelectron., 2017, 94, 292–297 CrossRef CAS PubMed.
- J. Deng, D. Lu, X. Zhang, G. Shi and T. Zhou, Environ. Pollut., 2017, 224, 436–444 CrossRef CAS PubMed.
- A. Sharma and K. Tapadia, J. Appl. Spectrosc., 2017, 83, 1068–1075 CrossRef CAS.
- E. Hutter and D. Maysinger, Trends Pharmacol. Sci., 2013, 34, 497–507 CrossRef CAS PubMed.
- Q. J. Luo, Y. X. Li, M. Q. Zhang, P. Qiu and Y. H. Deng, Chin. Chem. Lett., 2017, 28, 345–349 CrossRef CAS.
- Y. Lu and W. Chen, Chem. Soc. Rev., 2012, 41, 3594–3623 RSC.
- N. Zhang, Y. M. Si, Z. Z. Sun, L. J. Chen, R. Li, Y. C. Qiao and H. Wang, Anal. Chem., 2014, 86, 11714–11721 CrossRef CAS PubMed.
- S. Y. Li, M. M. Dong, R. Li, L. Y. Zhang, Y. C. Qiao, Y. Jiang, W. Qi and H. Wang, Nanoscale, 2015, 7, 18453–18458 RSC.
- C. Y. Ke, Y. T. Wu and W. L. Tseng, Biosens. Bioelectron., 2015, 69, 46–53 CrossRef CAS PubMed.
- L. Shang and S. Dong, J. Mater. Chem., 2008, 18, 4636–4640 RSC.
- J. Wu, K. Jiang, X. Wang, C. Wang and C. Zhang, Microchim. Acta, 2017, 184, 1315–1324 CrossRef CAS.
- X. Hu, W. Wang and Y. Huang, Talanta, 2016, 154, 409–415 CrossRef CAS PubMed.
- J. Yu, S. Choi and R. M. Dickson, Angew. Chem., Int. Ed., 2009, 48, 318–320 CrossRef CAS PubMed.
- S. Zhao, Z. Li, Y. Li, J. Yu, G. Liu, R. Liu and Z. Yue, J. Photochem. Photobiol., A, 2017, 342, 15–24 CrossRef CAS.
- N. Zhang, Y. M. Si, Z. Z. Sun, S. Li, S. Y. Li, Y. H. Lin and H. Wang, Analyst, 2014, 139, 4620–4628 RSC.
- X. Liu, C. Fu, X. Ren, H. Liu, L. Li and X. Meng, Biosens. Bioelectron., 2015, 74, 322–328 CrossRef CAS PubMed.
- Y. Zhang, M. Yan, J. Jiang, P. Gao, G. Zhang, M. M. F. Choi, C. Dong and S. Shuang, Sens. Actuators, B, 2016, 235, 386–393 CrossRef CAS.
- Q. Liu, A. Fei, J. Huan, H. Mao and K. Wang, J. Electroanal. Chem., 2015, 740, 8–13 CrossRef CAS.
- G. D. Liu and Y. H. Lin, Anal. Chem., 2006, 78, 835–843 CrossRef CAS PubMed.
- W. Li, W. Li, Y. Hu, Y. Xia, Q. Shen, Z. Nie, Y. Huang and S. Yao, Biosens. Bioelectron., 2013, 47, 345–349 CrossRef CAS PubMed.
- H. Li, Y. Guo, L. Xiao and B. Chen, Analyst, 2014, 139, 285–289 RSC.
- Q. Zhou, Y. Lin, M. Xu, Z. Gao, H. Yang and D. Tang, Anal. Chem., 2016, 88, 8886–8892 CrossRef CAS PubMed.
- H. Wu, D. Huo, Y. Zhao, N. Ma, J. Hou, M. Liu, C. Shen and C. Hou, Sens. Actuators, B, 2017, 252, 1118–1124 CrossRef CAS.
- H. F. Cui, W. W. Wu, M. M. Li, X. Song, Y. Lv and T. T. Zhang, Biosens. Bioelectron., 2018, 99, 223–229 CrossRef CAS PubMed.
- K. Wang, Q. Liu, L. Dai, J. Yan, C. Ju, B. Qiu and X. Wu, Anal. Chim. Acta, 2011, 695, 84–88 CrossRef CAS PubMed.
- S. M. Z. Hossain, R. E. Luckham, M. J. McFadden and J. D. Brennan, Anal. Chem., 2009, 81, 9055–9064 CrossRef CAS PubMed.
| This journal is © The Royal Society of Chemistry 2017 |

