 Open Access Article
Synthesis of polymer macrogels with rapid and significant response to glucose concentration changes†
Wenting Xua,
Fan Lua,
Shoumin Chena,
Xuezhen Lina,
Shiming Zhoub and
Weitai Wu *a
*a
aState Key Laboratory for Physical Chemistry of Solid Surfaces, Collaborative Innovation Center of Chemistry for Energy Materials, The Key Laboratory for Chemical Biology of Fujian Province, Department of Chemistry, College of Chemistry and Chemical Engineering, Xiamen University, Xiamen, Fujian 361005, China. E-mail: wuwtxmu@xmu.edu.cn
bHefei National Laboratory for Physical Sciences at the Microscale, University of Science and Technology of China, Hefei 230026, Anhui, China
First published on 11th December 2017
Abstract
Polymer macrogels that can undergo rapid and significant volume changes in response to an external stimulus, such as a fluctuation in blood glucose concentration, are critical for their versatility. We report here such a polymer macrogel, which is made of a highly-ordered array of poly(phenylboronic acid) microgels tethered chemically to bridging polymers (a thin hydrogel matrix). This unique microstructure makes the newly developed macrogels exhibit a rapid response rate and extraordinarily large responsive swelling ratio upon adding glucose into the bathing medium over a glucose concentration range of 0–30 mM at a physiological pH of 7.4. While the macrogels can swell (e.g., the weight of the macrogels increases by ca. 310-fold if the glucose concentration in the bathing medium increases from 0 to 30.0 mM) and reach stability shortly (reach ∼99% of the maximum change within 90 s) after increasing glucose concentration from 0 to a concentration in the 150.0 μM to 30.0 mM range, the volume changes of the macrogels can be fully reversible within the experimental error even after twenty cycles of adding/removing glucose. The macrogels in this extremely expanded state were somewhat flowable, allowing their use as injectable glucose-sensing materials. With the macrogels as carriers, in vitro insulin release can be modulated in a pulsatile profile in response to glucose concentrations, and in vivo studies revealed that these formulations may improve glucose control in streptozotocin-induced diabetic mice subcutaneously administered with the insulin-loaded macrogels.
Introduction
To create soft materials that can undergo rapid switching between two states found in living organisms is a challenge for materials chemists.1 Responsive polymer hydrogels with a three-dimensional crosslinked network structure internally can exhibit a dramatically change in their volume between the swollen state and the collapsed state, on receiving an external stimulus that is derived from even a fine change in milieu, such as a change in temperature or pH value, or that can be triggered by ultrasound, irradiation with light or exposure to an electrical and/or magnetic field.2–6 This characteristic of hydrogels, known as volume phase transition, can be useful in the development of biomimetic soft materials and manipulable devices, such as soft biomimetic machines, artificial muscles/skins, artificial enzymes, and smart coatings.6–9 If a responsive polymer hydrogel is sensitive to the fluctuation in the concentration of a biomolecule like glucose, a basic necessity of living organisms and a ubiquitous fuel for biological process, it can mimic biofeedback systems, providing both a functional and structural basis for biosensors for prospective biomedical applications.10–15 Unfortunately, the slow response (e.g., on the order of hours for the hydrogels of millimetre size) of the conventionally macroscopic hydrogels (i.e., macrogels),2–15 which is an inherent characteristic of a volume phase transition phenomenon, has prevented them from being developed technologically.In order to improve the response rate of polymer macrogels, a widely employed strategy is generating porous structures inside the hydrogel matrix.16–22 Theoretically, the swelling/shrinking processes of the hydrogels are determined by the collective diffusion of polymer networks in a fluid, so that the characteristic response time period that describes volume change of hydrogels is approximately proportional to the square of characteristic length of the hydrogels.23 When generating porous structures inside the hydrogel matrix, as the porous macrogels thereof can be regarded intuitively as an aggregate of many “tiny hydrogel” building blocks, it is not surprising that the response time can be drastically shorter than that of a homogeneous hydrogel of equal size.16–22 The volume change of improved response rate may result from the ability of the interconnecting inner pores to allow a sufficient amount of water to reach internal building blocks to produce swelling of the macrogels, and its ability to expel water from the porous hydrogel matrix.16,19 Moreover, grafting side chains onto polymer networks to generate the comb-type grafted hydrogel matrix was combined to further improve the response rate of the macrogels.24,25 However, because of the difficulty in the synthesis of macrogels with a precise pore distribution control, which typically lead to a very broad and anomalous size distribution of the building blocks of macrogels and thus may still need a long time to reach the volume change equilibrium, it is far from perfect for addressing the slow-response-rate related issue.
Since a faster volume change can be achieved on the hydrogels of a smaller characteristic length,23,26–28 one can speculate that the use of the structurally more elaborate polymer networks for downsizing the building blocks of macrogels into submicron and even nanoscale should have a positive effect on response rate. Taking the de novo synthesis approach is very hard because of the difficulty in designing polymer networks with precise three-dimensional control, a possible approach to the challenging task on achieving rapid and significant response is the use of microgels or even nanogels as building blocks for the synthesis of macrogels. Recently, a lot of such macrogels were synthesized with micro/nanogels encapsulated in a hydrogel matrix, where the embedded micro/nanogels were usually designed to provide responsiveness and the hydrogel matrix provide a suitable shape.29–40 This synthetic approach to macrogels may also combine several other advantages of micro/nanogels: easy functionalization, and tunable dimension.2–4 Although significant benefits have already been achieved, nearly all the hydrogel matrixes lay thick over the micro/nanogels encapsulated in the obtained macrogels. This could be a huge obstacle for the encapsulated micro/nanogels to induce a rapid and significant response on the constructed macrogels.29–40 A recent study indicated strong interactive effect between the hydrogel matrix and encapsulated micro/nanogels, so that a thick hydrogel matrix (of dense polymers) can no doubt restrain the volume change of the encapsulated micro/nanogels.41 It is possible that thinning the hydrogel matrix can favor the volume change of the encapsulated micro/nanogels and thus improve the response rate of macrogels.29–40 Yet, so far, the hydrogel-matrix-rich domains were generally clearly observed in the generated macrogels, and the response rate of those macrogels was still much slower (differ by one order of magnitude at least) than the corresponding individual micro/nanogel.
In this work, we develop a novel class of macrogels with rapid and significant response. It is well known that colloidal particles have been used as building blocks to create “colloidal molecules” and functional materials, such as photonic crystals, to understand various physical phenomena.42–52 Notably, various synthetic schemes have been developed to fabricate DNA-coated gold, titania, silica, poly(styrene), poly(methyl methacrylate), and silica–methacrylate colloidal particles that, upon thermal annealing, self-assemble into crystal suprastructures.45–47,50 Recently, a highly ordered structure of responsive poly(N-isopropylacrylamide) microgel colloidal crystal was stabilized by photopolymerization of its surface vinyl groups; the resulting macrogels could respond to external stimuli, including temperature and ionic strength of surrounding media.52 Interestingly, in contrast to those macrogels with the microgel building blocks embedded in a thick hydrogel matrix,29–40 in such macrogels, the swelling of the microgel building blocks was almost unaltered in a certain range of temperature and ionic strength of surrounding media, leading to a fast response to ionic strength changes.52 However, the direct connecting of the neighbouring building blocks should hinder their fully swelling/shrinking to allow extraordinary large responsive swelling ratio of the macrogels, which is a significant drawback of the technique.41,52 Herein, our intention is to use sparse polymers to bridge responsive polymer microgels. As a proof of concept, the proposed macrogels are synthesized with poly(phenylboronic acid) (pPBA) microgels as building blocks, as schematically depicted in Scheme 1. PBA, a Lewis acid that can reversibly bind to cis-diols to form a five- or six-membered boronic cyclic ester in water, is thought to be a potentially synthetic receptor for glucose.10–15 The pPBA microgels are typically designed to contain active vinyl groups on the surface of these microgels at a light penetration depth, so as to allow their tethering chemically to the bridging polymers via free radical polymerization. Under this rational design, it is possible to create the proposed macrogels that have a thin hydrogel matrix for chemically anchoring microgels. As a result, unlike those pPBA macrogels reported in previously arts as glucose sensing materials that suffer from slow swelling rate and small swelling ratio under a normal physiological pH of 7.4,10,14,15,29–34 as well as the macrogels synthesized by polymerization of the surface vinyl groups of the microgel building blocks that exhibit a limited responsive swelling ratio,52 we show that our macrogels can show rapid response rate and extraordinary large responsive swelling ratio upon adding glucose. Such a feature should provide a functional basis for the proposed macrogels as glucose sensing materials for prospective applications.
Experimental
Materials
Lyophilized recombinant human insulin (C267H393N65O77S6) and 4-vinylphenylboronic acid (4-VPBA) were purchased from Jiangsu Wanbang Biopharmaceuticals Co. and Combi-Blocks Inc., respectively, and all other chemicals were purchased from Aldrich. Styrene (St), N,N′-methylenebisacrylamide (MBAAm), ammonium persulfate (APS), 2-(dimethylamino)ethyl acrylate (DMAEA), acrylamide (AAm), sodium dodecyl sulfate (SDS), D(+)-glucose, D(+)-mannose, D(−)-fructose, D(+)-galactose, and insulin were used as received without further purification. The water used in all experiments was of Millipore Milli-Q grade.Microgels synthesis
A mixture of 4-VPBA (67.6 mg, 4.6 × 10⁻⁴ mol), DMAEA (30.0 μL, 2.0 × 10⁻⁴ mol), St (1.0 mL, 8.7 × 10⁻³ mol), MBAAm (45.5 mg, 3.0 × 10⁻⁴ mol), SDS (4.1 mg, 1.4 × 10⁻⁵ mol), and water (100.0 mL) was poured in a 150 mL three-neck flask equipped with a stirrer, a N2 inlet, and a condenser. The mixture was heated to 70.0 °C. After 1 hour, APS (100.0 mg, dissolved in 5.0 mL water) was added to initiate polymerization, and the reaction was allowed to proceed for another 5 hours. The pPBA microgels was obtained by the centrifugation (20![[thin space (1/6-em)]](https://www.rsc.org/images/entities/char_2009.gif) 000 rpm, 30 min, and 35 °C) (Thermo Electron Co. SORVALL® RC-6 PLUS superspeed centrifuge). The microgels were redispersed in water (50.0 mL), and purified by dialysis (Spectra/Por® molecularporous membrane tubing, cutoff 12
000 rpm, 30 min, and 35 °C) (Thermo Electron Co. SORVALL® RC-6 PLUS superspeed centrifuge). The microgels were redispersed in water (50.0 mL), and purified by dialysis (Spectra/Por® molecularporous membrane tubing, cutoff 12![[thin space (1/6-em)]](https://www.rsc.org/images/entities/char_2009.gif) 000–14
000–14![[thin space (1/6-em)]](https://www.rsc.org/images/entities/char_2009.gif) 000 Dalton) against frequently changed water at room temperature (∼22 °C) for at least two weeks.
000 Dalton) against frequently changed water at room temperature (∼22 °C) for at least two weeks.
Macrogels synthesis
The concentrated pPBA microgels (prepared by centrifugation at 20![[thin space (1/6-em)]](https://www.rsc.org/images/entities/char_2009.gif) 000 rpm, 30 min and 25 °C, with the supernatant discarded; 2.0 g, with the polymer concentration ca. 4.2 wt%), MBAAm (dissolved in water, 0.1 mol L−1; 10.0 μL, 1.0 × 10⁻⁶ mol), AAm (dissolved in water, 0.1 mol L−1; 20.0 μL, 2.0 × 10⁻⁶ mol), and APS (10.0 mg, dissolved in 1.0 mL water) were mixed in a small vial using a mixer (Thermo Scientific VORTEX MAXI MIX II). With the aid of the external force, the concentrated microgels can self-assemble to form highly ordered crystalline colloidal array (CCA).29–32 After crystallized, eyeable free water was removed by drying at 25 °C under vacuum for 1 hour, and then the mixture was allowed to polymerize at 60 °C for 5 days. The obtained macrogels were purified by dialysis with large quantities of water for two weeks, and rinsing with phosphate buffer solution (PBS; 5.0 mM, pH 7.4).
000 rpm, 30 min and 25 °C, with the supernatant discarded; 2.0 g, with the polymer concentration ca. 4.2 wt%), MBAAm (dissolved in water, 0.1 mol L−1; 10.0 μL, 1.0 × 10⁻⁶ mol), AAm (dissolved in water, 0.1 mol L−1; 20.0 μL, 2.0 × 10⁻⁶ mol), and APS (10.0 mg, dissolved in 1.0 mL water) were mixed in a small vial using a mixer (Thermo Scientific VORTEX MAXI MIX II). With the aid of the external force, the concentrated microgels can self-assemble to form highly ordered crystalline colloidal array (CCA).29–32 After crystallized, eyeable free water was removed by drying at 25 °C under vacuum for 1 hour, and then the mixture was allowed to polymerize at 60 °C for 5 days. The obtained macrogels were purified by dialysis with large quantities of water for two weeks, and rinsing with phosphate buffer solution (PBS; 5.0 mM, pH 7.4).
Laser light scattering (LLS) studies on microgels
All LLS measurements were made in PBS (5.0 mM, pH 7.4) at 37.0 °C. The very dilute microgel dispersions (10.0 μg mL−1) were passed through Millipore Millex-HV filters (pore size 0.80 μm or 1.2 μm) to remove dust before measurements. Standard Laser Light Scattering (LLS) spectrometer (BI-200SM) equipped with a BI-9000 AT digital time correlator (Brookhaven Instruments, Inc.) and a Mini-L30 diode laser (30 mW, 637 nm) as the light source was used for the measurement. In Dynamic LLS (DLS), the Laplace inversion of each measured intensity–intensity time correlation function in a dilute dispersion can lead to a line-width distribution G(Γ). For a purely diffusive relaxation, Γ is related to translational diffusion coefficient D by (Γ/q2)C→0,q→0 = D, so that G(Γ) can be converted to a translational diffusion coefficient distribution and the average hydrodynamic diameter (〈Dh〉) distribution by using the Stokes–Einstein equation, 〈Dh〉 = (kBT/3πη)/D, where kB, T, and η are the Boltzmann constant, absolute temperature, and solvent viscosity, respectively.53Response kinetics measurements on microgels
The response kinetics measurements were conducted on a Bio-Logic SFM300/S stopped-flow instrument equipped with a MOS-250 spectrometer, a temperature controller, and three 10 mL step-motor-driven syringes that are operated independently to carry out single- or double-mixing. For light scattering detection at a scattering angle θ = 90° and at 37.0 °C, both the excitation and emission wavelengths were adjusted to 335 nm with 10 nm slits. Using either FC-08 or FC-15 flow cells, typical dead times are 1.1 ms and 2.6 ms, respectively. Both the microgel dispersions and glucose solutions were passed through Millipore Millex-HV filters with a pore size of 0.80 μm or 1.2 μm to remove dust before the response kinetics measurements. The final concentrations of microgels (10.0 μg mL−1) and glucose (50.0 μM to 30.0 mM) were controlled by varying mixing ratio of the microgel dispersion to the glucose solutions. Data collection commenced 3.0 ms after activating pneumatic drive mechanism of the stopped flow apparatus. Each kinetic curve reported here represents an average of at least five consecutive mixing trials.Rheological measurements on gelation
Dynamic rheological analysis was performed on an AR2000ex 45 rheometer (TA Instruments Ltd.). Aluminum parallel plate geometry with a diameter of 40 mm was used. Temperature was controlled by a water bath via connecting the bottom plate to a NESLAB RTE 7 circulating water bath circulator (Thermo Electron Co.). Strain sweep tests were first carried out to define the linear viscoelastic region, and the thermal gelation during the early stage of macrogels synthesis (the mixture with eyeable free water being removed was used for a start; see above) was studied by using the small-deformation oscillatory rheological measurements, at a frequency of 1 rad s−1 and a strain of 1% that is within the linear viscoelastic region. Before measurement, temperature of the bottom plate was first set to 25 °C. In order to minimize the temperature gradient in the sample during the test, the sample gap was set to be 0.5 mm, near its propositional limit. The sample was held at 25 °C for 2 min and then heated to 60 °C. It was held at 60 °C and the change in elastic (storage) modulus G′ and viscous (loss) modulus G′′ during the gelation process was monitored as a function of time.Reflection measurements on macrogels
A macrogel sheet was deposited in a cell containing PBS (10.0 mL; 5.0 mM, pH 7.4). To study glucose-responsive properties, glucose was added to the testing buffer solution by removing 3.0 mL of PBS, dissolving glucose within that buffer, and then returning this solution to the cell. After addition of glucose, the diffraction was monitored until it stabilized by using a UV-vis spectroscopy (Varian Cary 5000). For interference tests, interferents were added together with glucose. The experiments were repeated for five times at each glucose concentration ([Glu]), and the average reflection intensity at 274 nm (I[Glu]) were used for constructing the model. To simplify the calculation model, the reflection intensity of the macrogels without sugar (I0) was used for normalization in all experiments. For glucose-responsive kinetics studies, the change in the I[Glu] was recorded as time evolved. To evaluate the ability for optical sensing of tear glucose, the macrogels were rinsed with copious amounts of artificial tear fluids and tested following the method described above. All measurements were made at 37.0 °C.In vitro insulin uploading and release experiments
A fresh solution of insulin (5.0 mg mL−1) was prepared in PBS (5.0 mM, pH 5.1; [Glu] = 6.0 mM). The dried macrogels (5.0 mg) were immersed in an as-prepared insulin solution (20.0 mL; 5.0 mM, pH 5.1; [Glu] = 6.0 mM) in an ice water bath. After stirring for 3 days, the macrogels were taken out. To remove free drug, the macrogels were the washed with PBS (5.0 mM, pH 7.4; [Glu] = 6.0 mM) at 37 °C. The purified insulin-loaded macrogels were used immediately for in vitro and in vivo tests (see below). All the solutions were collected, and the insulin content in the collected solutions was measured using a Coomassie Plus (Bradford) protein assay by UV-vis absorption spectrometry at 595 nm. The amount of the loaded insulin in macrogels was calculated from the decrease in drug content. The loading content can be expressed as the mass of loaded drug per unit weight of dried macrogels.In order to evaluate the in vitro release of insulin, the purified insulin-loaded macrogels were immersed in PBS (100.0 mL; 5.0 mM, pH 7.4) of various glucose concentrations at 37.0 °C. The solution containing the released insulin was sampled at defined time intervals and measured using a Coomassie Plus (Bradford) protein assay by UV-vis absorption spectrometry at 595 nm. Cumulative release is expressed as the total percentage of drug released from the macrogels over time. The release experiments were also performed to show the evolution of release kinetics in response to glucose concentration changes.
To evaluate the macrogels' ability to adapt to cyclical change in glucose concentrations, the purified insulin-loaded macrogels were first incubated in PBS (100.0 mL; 5.0 mM, pH 7.4) of 6.0 mM glucose for 30 min at 37.0 °C. At that point, the macrogels were taken out. The macrogels were washed twice with PBS and then incubated in fresh PBS (100.0 mL; 5.0 mM, pH 7.4) of 20.0 mM glucose for another 30 min. This cycle was repeated numerous times. The insulin content was determined using the Coomassie Plus protein assay.
In vivo studies
All experiments were approved by medical ethics committee of Xiamen University (Medical College), and were performed in compliance with the relevant laws of China and institutional guidelines of Declaration of Helsinki (developed by the World Medical Association). In vivo study of the hypoglycaemic effect of insulin-loaded macrogels for diabetes treatment were evaluated by using streptozotocin (STZ) induced diabetic mices (ca. 8 weeks old, with a body weight of 0.20–0.25 kg, the fasting blood glucose levels ≥10.7 mM, and the average random blood glucose levels of ca. 16.7 mM) as the in vivo model. The blood glucose (BG) levels of the mices were tested for 2 days before administration by collecting blood (∼3 μL) from the tail vein and measuring by the oxygen rate method making use of a Beckman glucose analyser. Five diabetic mice were selected for each group administered with PBS solution, insulin solution, empty macrogels, or insulin-loaded macrogels. These samples (150.0 μL) were injected using a 1 cc syringe with a 19 gauge needle into the subcutaneous dorsum of mice (insulin dose = 0.8 IU per kg) that had been anesthetized with 1% isoflurane. The BG level of mice was monitored every 1 hour or 2 hours in the first day of administration, and twice per day (in the morning, evening each) for following days; the count of the white blood cell (WBC) was determined once per day in the morning. To study in vivo insulin concentration, the concentration of plasma human insulin (PHI) was determined using the human insulin ELISA kit.Other characterizations
The pH values were measured on a EUTECH PH 700 instruments. FTIR spectra were recorded by using a Thermo Electron Corporation Nicolet 380 Fourier transform infrared spectrometer. SEM images were taken on a Hitachi S4800 scanning electron microscope with a field emission electron gun. The photomicrographs were taken on a Keyence VHX-600 digital microscope.Results and discussion
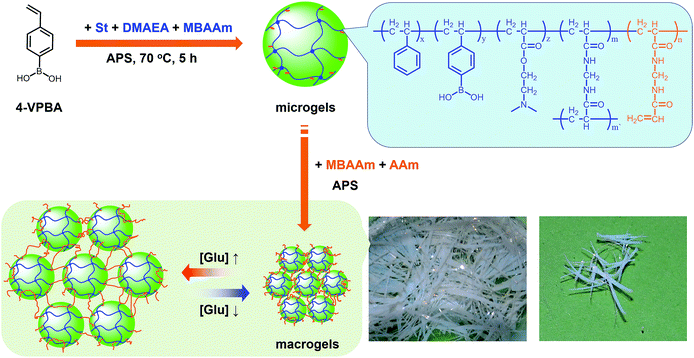
Our strategy to prepare the macrogels involves the first synthesis of pPBA microgels containing active vinyl groups on the surface of the microgels at the light penetration depth, followed by the chemically anchoring of the pPBA microgels to the bridging polymers through free radical polymerization. The synthesis of nearly monodispersed microgels has been well-established on the basis of the precipitation polymerization of poly(N-isopropylacrylamide), which precipitates from aqueous solution at temperature higher than its lower critical solution temperature (LCST; ∼32 °C) and form gel particles.2,3 Yet, heterogeneities in the microgel structures, caused by the mismatched reactivity ratios for the monomer and crosslinker during precipitation polymerization, where the reactivity ratio is a measure of the propensity of a monomer to propagate by reacting with itself or a different monomer in the synthetic mixture, are often observed.54,55 Typically, poly(N-isopropylacrylamide) microgels crosslinked with MBAAm show a radial distribution of cross-links within the particle, with the highest crosslinker concentrations residing at the microgel interior; this uneven incorporation of MBAAm has been attributed to a high reactivity ratio for the crosslinker relative to the monomer (e.g., N-isopropylacrylamide: the resonance parameter Q = 0.21, the electronic parameter e = 0.43; MBAAm: Q = 0.46, e = 0.54).54,56 In synthesis of poly(N-isopropylacrylamide) microgels by precipitation polymerization, as the consumption of the crosslinker is much faster than that of the monomer, the active vinyl groups from the unreacted parts of the crosslinker would decrease rapidly with increasing the microgel size at a long reaction time (when ≥1 hour, no vinyl groups can be found in the microgels).54–56 In this respect, following the main objective to introduce surface active vinyl groups to microgels for the subsequent synthesis of macrogels, our pPBA microgels were synthesized from the copolymerization of St, 4-VPBA, DMAEA, and the crosslinker MBAAm in water (Scheme 1), rather than the usually used N-isopropylacrylamide.42 With the large difference in Q value of St (Q = 1.00, e = −0.80) and MBAAm, and VPBA (Q = 0.38, e = −0.52)56,57 and DMAEA (Q = 0.54, e = 0.61)58 as well, the microgels should possess a relatively high crosslinker concentration residing at the microgel exterior, rendering the existing of the active vinyl groups on the surface of the microgels at the light penetration depth. It is possible that the nearly water insoluble St can only enter into the hydrophobic alkyl chain regions of the SDS aggregates, and the polymer fragments formed at the early stage of reaction can provide non-polymerized vinyl groups for further polymerization of the monomers in the presence of MBAAm as a crosslinker; with the polymerization proceeded, more polymer fragments were added onto the initially formed nuclei, leading to a continuous growth in size of gel particles until the polymerization reaction was completed.2,3 In FTIR spectrum of the purified pPBA microgels (Fig. 1a), the peak at 981 cm−1 referred to the active vinyl groups from the unreacted parts of MBAAm.54–56 FTIR analysis suggested successful incorporation of boronic acid (from 4-VPBA) and tertiary amine (from DMAEA) onto the polystyrene particles that PBA B–O stretching at 1341 cm−1 and phenyl ring deformation mode at 1117 cm−1, tertiary amine C–N flex vibration at 1373 cm−1, and St C–H aromatic tension at 3002 cm−1, 3025 cm−1, 3060 cm−1 and 3081 cm−1, were observed for the pPBA microgels.59,60 The weak bands at 1473 cm−1 and 966 cm−1 indicated the presence of the quaternary amine, due to the slight ionization of tertiary amine of the DMAEA units on the microgels.61 SEM images of the microgels (Fig. S1 in ESI†) indicated sphere-like morphology. Fig. 1b shows DLS size distribution of the microgels (10.0 μg mL−1 in 5.0 mM PBS of pH = 7.4), which indicates that the microgels are narrowly distributed with the polydispersity index μ2/〈Γ〉2 ≤ 0.005 and the average hydrodynamic diameter 〈Dh〉 = 194 nm. The microgels can be reproduced from batch to batch, with the yield ≥97%. Moreover, the size of the microgels is tunable. For instance, an increase in the feeding amount of the surfactant SDS in the synthesis can reduce the 〈Dh〉 of the microgels (see Fig. S2 in ESI† for DLS size distribution of the samples). All microgels showed good stability, with DLS size distribution kept nearly the same before and after dialysis, or even before and after three months' storage at room temperature (Fig. S2 in ESI†). The good stability of the nearly monodispersed microgels should favor the self-assemble of the concentrated microgels to form highly ordered CCA (Fig. S1 in ESI†);29–32 when subject to dialysis, the CCA would disassemble, with the microgels well dispersed in water, and DLS size distribution of the microgels kept nearly the same as the original ones (Fig. S3 in ESI†).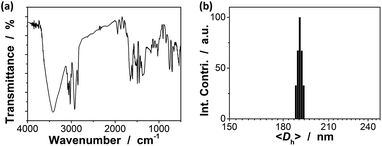 | ||
| Fig. 1 (a) FTIR spectrum and (b) DLS size distribution of pPBA microgels. DLS measurements were made in 5.0 mM PBS of pH = 7.4 at 37.0 °C. | ||
Next, the proposed macrogels were synthesized by the free radical polymerization from the active vinyl groups of the pPBA microgels and MBAAm; a few AAm was added to provide the macrogels with the hydrophilic framework segments. AAm, MBAAm and APS were dissolved in water and then mixed with the concentrated microgels. When heating the mixture to 60 °C, a thermolysis reaction on the initiator APS started to polymerize the monomer and crosslinkers. It is possible that the radicals generated in the dispersion would initiate AAm/MBAAm, and then they would propagate to meet and initiate active vinyl groups in the microgels to form longer polymer radicals, which would further propagate to form grafting polymer radicals by initiating AAm/MBAAm in the mixture.2,3,42–51 When the grafting polymer radicals met and initiated the active vinyl groups in the neighbouring microgels, the bridging polymer chains were formed to connect the neighbouring microgels; if the grafting polymer radicals were terminated by other free radicals, they would became dangling grafting polymer chains on the microgels. Finally, the proposed macrogels with the pPBA microgels bridged by poly(AAm) network chains can be constructed (Scheme 1). The thermal gelation during the early stage (first 100 min) of macrogels synthesis was studied by using the small-deformation oscillatory rheological measurements. In the kinetic studies, the systems were first quickly heated to a predetermined temperature, then the rheological properties were recorded with time. A typical trace of the elastic (storage) modulus G′ and viscous (loss) modulus G′′ against time is shown in Fig. 2: at the beginning, G′ is lower than G′′; then both G′ and G′′ increased with time, but G′ would increased faster than G′′, resulting in a crossover at certain time (i.e., the system behaved more like a solid, suggesting the formation of a macrogel network); finally, both moduli seem to approach a plateau. In contrast, no thermal gelation was observed on the simply concentrated microgels under otherwise the same conditions, for which both G′ and G′′ were low relatively, and the measured values were highly discrete (Fig. S4 in ESI†), strongly suggesting that the system was in liquid like state within the experimental time window. Upon further curing, the relatively weak attractions between the micro/nano-objects, which are screened in dispersion, might become much manifest as the solvent evaporated, initiating the assembly of the intricate and slowly evolving structures, finally resulting in macrogels of ribbon-like morphology (Scheme 1).42–51 FTIR spectra showed that the active vinyl groups existed in thoroughly dialyzed microgels (Fig. 1a) but not in the as prepared macrogels anymore (Fig. S5 in ESI†). The successful encapsulation of microgels into a hydrogel matrix is also confirmed by the fact that after two weeks' dialysis with large quantities of water, both the shape and the mass can be retained for the macrogels, while changed for the concentrated microgel samples.
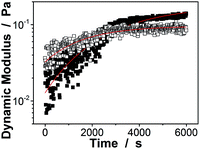 | ||
| Fig. 2 Evolution of the dynamic modulus (■: G′; □: G′′) with time during the early stage (the first 100 min) of macrogels synthesis. Lines were obtained from curve fitting. | ||
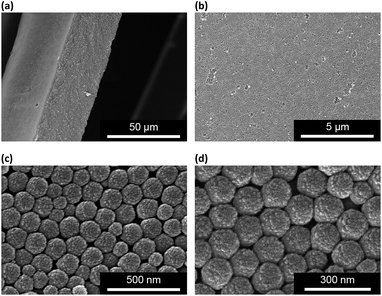
The as prepared macrogels were white coloured, semitransparent in the dry state (Scheme 1). Typical photomicrographs indicated that these macrogels were approximately 15 μm in the thickness, 50–200 μm in the width, and up to centimeters in the length (Fig. 3a; also see Fig. S6 in ESI†). These macrogels seem to display structural colours under high resolution microscope (Fig. S7 in ESI†), suggesting the existing of the ordered array of the microgels as the building blocks (i.e., CCA).29–32 This can be supported by the distinct microstructures observed in SEM micrographs of freeze-dried macrogels, where the ordered microgel array was noticeable (Fig. 4). Such microstructures of these macrogels were significantly different from the honeycomb-like microstructures of the macrogels reported in previously arts that were synthesized by encapsulation of microgels into a thick hydrogel matrix, where (the latter) the microgel building blocks were heavily coated with thick hydrogel matrix and thus barely seen directly.29–40 As for our macrogels, because of the elastic property of the bridging polymers between the microgel building blocks, the highly ordered structure of the microgels building blocks can be well inherited from the concentrated microgel samples (see Fig. S1 in ESI†) during the macrogels synthesis; whilst, the bridging polymers were observed as the embossments on the surface of the microgel building blocks.42–52 Such microstructures should be beneficial to a rapid and significant response of the macrogels as discussed following.
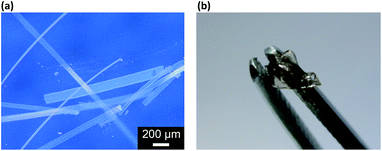 | ||
| Fig. 3 (a) A photomicrograph of the proposed macrogels in the dry state, and (b) a photograph of that in the swollen state after absorbing water. | ||
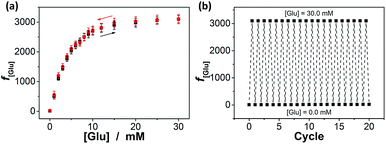
Interestingly, these macrogels can indeed absorb up to several tens of thousands percentage weight of water when compared with their dry state (see Fig. 3b for a typical photograph of the macrogels in the swollen state). Typically, the weight of a macrogel sample increased by ca. 10-fold when it was placed in PBS (5.0 mM, pH 7.4; without glucose) for three days (Fig. 5a). The absorbing ability (f[Glu] = (W[Glu] − W0)/W0, where W[Glu] and W0 are the weights of the swollen and dry macrogels, respectively; f0.0 mM ≈ 10) kept nearly the same (99–101% of the original basal value) after twenty cycles of adding/removing PBS (Fig. S8 in ESI†), in good agreement with the good stability of the macrogels subjected to dialysis as mentioned above. More importantly, we examined the effect of glucose concentration ([Glu]) in PBS on the absorbing ability f[Glu] of the macrogels. PBA is known as one of the best synthetic ligands identified for binding glucose in aqueous solution.10–15 pPBA units are in equilibrium between undissociated (trigonal, uncharged) and dissociated (tetrahedral, charged) forms in aqueous solution, of which the tetrahedral form prefers binding with glucose to form boronate ester. The tetrahedral conformation at the boron centre can be further stabilized by electrostatic attractions (Bδ−⋯Nδ+) through the amino groups of poly(DMAEA) and poly(AAm) units.34 Consequently, pPBA microgels as building blocks can bind glucose sensitively and selectively,34 which increase negative charge density (see Fig. S9 in ESI† for ζ-potential data) and thus build up a Donnan potential for the generated macrogels to swell with an increase in glucose concentration over a clinically relevant range of 0–30 mM. Fig. 5a shows the absorbing ability f[Glu] for the macrogels placed in PBS of different glucose concentrations. The increased f[Glu] at higher [Glu] verified the responsive swelling behavior of the macrogels upon adding glucose in the bathing PBS. The relative swelling ratio, in terms of f30.0 mM/f0.0 mM, is determined to be ca. 310, which is larger than that of the macrogels reported in previously arts as glucose sensing materials (<200).10,14,15,29–34 The microstructures of the macrogels that the pPBA microgel building blocks seem to be “islands” surround by a thin poly(AAm) hydrogel matrix “sea” (Fig. 4) may contribute cooperatively to the measured extraordinary large swelling ratio of the macrogels: the microgel building blocks show glucose-responsive volume phase transition behaviors (see Fig. S10 in ESI† for DLS data), meanwhile the Coulomb repulsion can be introduced between negatively charged boron atoms (see Fig. S9 in ESI† for ζ-potential data) and thus between the microgel building blocks, which lead to additional expanding of the bridging polymers compared with that in pure PBS without glucose (i.e., [Glu] = 0.0 mM).34,41 Notably, the macrogels at this extremely expanding status thereby looked like somewhat flowable, which should allow their use as injectable glucose-sensing materials (see below). The covalent bonds formed between PBA and glucose are reversible.10–15 As glucose was removed very carefully from bathing PBS by dialysis, the dissociation equilibrium can shift back from boronate ester to boronic acid, leading to almost full recovery of the pPBA microgels (Fig. S10 in ESI†) and thus the macrogels even after twenty cycles of adding/removing glucose (Fig. 5a and b).
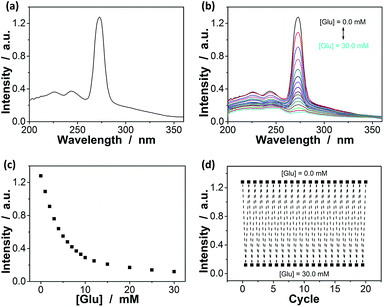
Since the thin hydrogel matrix can lock the crystalline structure of the CCA, the generated macrogels here, like polymerized crystalline colloidal array (PCCA) and other photonic crystal materials, should diffract electromagnetic waves of certain frequencies according to Bragg's law.29–34 As shown in Fig. 6a, the position of the main Bragg reflection peak of the macrogels lied at 274 nm, and the higher order reflection humps at 244 and 226 nm were also observed, indicating that the macrogels possessed a bcc structure; these peaks can be identified as (1,1,0), (2,2,0) and (2,2,2) reflections, respectively.29–34 Assuming the thin hydrogel matrix has a refractive index close to that of water, the lattice constant of the macrogels was estimated to be 212 nm. If the microgel building blocks respond to an external stimulus and change their degree of swelling, the Bragg diffraction of the PCCA will change.29–34 Therefore by detection of the optical change, the response could also be studied. Fig. 6b shows typical reflection spectra of the macrogels as a function of the [Glu]. Two effects were observed when the [Glu] increased: (a) a significant decreasing of the intensity of the reflections; and (b) a slight red shift of the position of the reflections. The observation on the changes in the intensity of the reflections is in agreement with the results of the previous macrogels that were synthesized by encapsulation of pPBA microgels into a thick hydrogel matrix.10,14,15,29–34 It is explained that as the [Glu] increased, the microgel building blocks could swell and absorb water, leading to a decreased refractive index and thus a decreased dielectric constant modulation of the PCCA, which in turn resulted in a less efficient diffraction.29–34 Yet, for those macrogels reported previously, the position of the Bragg reflections did not shift as the [Glu] increased, indicating the lattice constant remained unchanged, because the crystalline structure was locked by the thick hydrogel matrix, whose swelling degree does not change obviously with the [Glu].10,14,15,29–34 In contrast, as our macrogels possess a unique structure that the pPBA microgel building blocks seem to be the ordered “islands” surround by a thin poly(AAm) hydrogel matrix “sea” (Fig. 4), the microgel building blocks should be able to swell significantly as the [Glu] increased, which resulted in a red shift of the position of the reflections.52 Interestingly, the glucose-induced intensity decreasing (Fig. 6c) and red shift (see Fig. S11 in ESI†) of the (1,1,0) reflection as a function of the [Glu] follow the same trend, which clearly also mirrors that of the glucose-induced evolution of the absorbing ability (Fig. 5a). This observed relationship serves as further confirmation on the response of the macrogels to glucose concentration changes. In addition, the fully recoverable changes on the reflection even after twenty cycles of adding/removing glucose provided additionally direct spectroscopic proof on the good stability of the macrogels (Fig. 6d).
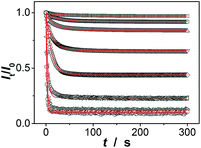
Our macrogels can exhibit a remarkable improvement in response rate. Since the glucose-induced reflection change is triggered by the volume change of the macrogels, the kinetics of reflection change depends on how fast the volume change is. In conventional polymer hydrogels, the time to swell/shrink is determined by the collective diffusion of polymer gel networks in the fluid, and the characteristic response time (τ[Glu]) that describes volume change is approximately proportional to the square of characteristic length of hydrogels.23,26–28 In an early work, a macrogel (125 μm in thickness) was synthesized by encapsulation of polystyrene colloidal particles into a thick pPBA hydrogel matrix, and the response rate increased to where it fully responded within 90 s to the normal physiological average glucose concentrations found in human blood (5.0 mM), and within 300 s to the average glucose concentrations found in tear fluid (150.0 μM).32 Recently, the response rate was further increased on a macrogel (127 μm in thickness), that was synthesized by encapsulation of pPBA microgels into a thick hydrogel matrix, to where it fully responded within 120 s with the τ[Glu] determined to be 22.1–10.1 s in the [Glu] range of 0.42–4.72 mM (the higher the [Glu] is, the faster the kinetics of the response).34 It is thought that the swelling of those macrogels upon the addition of glucose could be regarded as a consequence of three different processes: (1) diffusion of glucose through the hydrogel matrix to the encapsulated microgel building blocks; (2) the reaction between glucose and PBA, which leads to the changes in physicochemical property of the microgel building blocks; and (3) structural rearrangements of the gel due to the changed property of the microgel building blocks, which results in the (de)hydration and (de)swelling of the macrogel.14,15 Because the third step is very fast (the characteristic swelling time is estimated to be ∼10−4 s for spherical microgel particles with a radius of 100 nm, according to the theoretical model of Tanaka and Fillmore),23 for the macrogel synthesized with the microgel building blocks of similar size, the only possible rate-determining step should be the first step that is, the diffusion of glucose through the hydrogel matrix to the encapsulated microgel building blocks. This hypothesis is reasonable, according to Asher's work where the characteristic time for glucose diffusing into a 100 μm thickness poly(AAm) hydrogel film could be as long as ∼10 s, assuming that the diffusion constant of glucose in poly(AAm) hydrogel is similar to that in water (5.2 × 10⁻⁶ cm2 s−1 at room temperature).32 Under this consideration, our macrogels, which have a thin hydrogel matrix (Fig. 4), should be able to undergo a rapid response to the glucose concentration changes. Indeed, a fast kinetics of the response can be achieved over the [Glu] range of 0.0–30.0 mM (Fig. 7), which is close to the one achieved on the kinetics of the response of the microgels for the synthesis of the macrogels (Fig. S12 in ESI†). For instance, adding glucose to 150.0 μM, the intensity of the (1,1,0) reflection of the macrogels can reach ∼99% of the maximum change within 90 s, and the characteristic response time τ150.0 μM was ca. 26.7 ± 0.4 s; adding glucose to 0.5, 1.0, 2.5, 5.0, 10.0, 20.0, and 30.0 mM, the fully response occurred within 50 s, and the τ[Glu] was ca. 18.4 ± 0.3 s, 14.4 ± 0.2 s, 9.7 ± 0.2 s, 7.8 ± 0.1 s, 2.7 ± 0.2 s, 1.6 ± 0.1 s, and 1.2 ± 0.1 s, respectively. The rapid response will be an important feature for future studies in bio-systems.
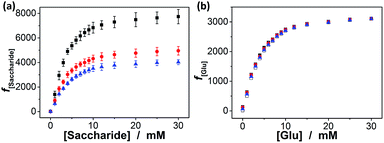
In addition, we checked the potential response of the macrogels to fructose, mannose, and galactose, which are natural stereoisomers of glucose. As shown in Fig. 8a, the swelling of the macrogels upon adding fructose, mannose, or galactose can elegantly occur over the investigated concentration window (0.0–30.0 mM), due to the high affinity of the PBA with those non-glucose monosaccharides.10–15 The relative swelling ratio f30.0 mM/f0.0 mM was ca. 774, 495 and 403 for adding fructose, mannose, and galactose, respectively. This result is in agreement with the larger formation constants for the saccharide–boronate complexes of fructose, mannose, and galactose than that of glucose.10–15 It is probable that those non-glucose monosaccharides would be the primary interferences if the macrogels were used as glucose-sensing materials in bio-systems. Fortunately, the normally physiological level of the non-glucose monosaccharides in blood of all mammals is ≤0.1 mM.63 To this end, we checked the impact of those non-glucose monosaccharides (0.1 mM) on the f[Glu] of the macrogels. It is possible that the competitive binding of the non-glucose monosaccharides to the PBA reduced the glucose binding degree, thus decreased the sensitivity of the macrogels in response to glucose. Yet, the data in Fig. 8b indicates that the macrogels serving as glucose-sensing materials can be free from significant interference of fructose, mannose, or galactose, as there was ≤8.7% variation in the f[Glu] over a physiological important glucose concentration range of 3.0–30.0 mM in the presence of 0.1 mM fructose (0.5–8.7%), mannose (0.2–7.4%), or galactose (0.1–3.8%).
Having demonstrated the rapid and significant glucose-response of the proposed macrogels with minimal interferences from common non-glucose constituents, we finally tested the insulin loading and release performance with the macrogels as carriers in view of their potential biomedical applications. Although benefits are already apparent from the current palliative treatment of diabetes (requires the frequent self-monitoring of blood glucose concentrations and the subsequent self-injection of insulin),63 it not only impinges on the quality of life of the patient but also fails to precisely control the dose of insulin. It is reported that only approximately 20% of insulin reaches the liver (the primary site of action) following the insulin injection.64 While lack of tight control of glucose concentrations may accounts for many chronic complications of diabetes, excess insulin in the body can also lead to many unwanted side effects, resulting in risks of brain damage or death.65,66 Polymer hydrogels with glucose-responsive feature therefore are receiving increase interest as insulin storage/release carriers for the treatment of diabetes.10–15 In our cases, insulin was loaded to the permeable mesh of the macrogels by co-incubation at a low temperature of ∼4 °C for a prolonged time of 3 days. The pH value (pH = 5.1) of the co-incubation medium was adjusted to around the isoelectric point (pH = 5.0–5.3) of insulin, so as to enhance the hydrogen bonding between amide groups of the macrogels and the carboxylate groups of insulin,61,62 meanwhile decrease the electrostatic repulsions among deprotonated carboxylate groups (at pH > PIinsulin) or protonated amine groups (at pH < PIinsulin) of insulin. Furthermore, at pH ≈ PIinsulin, insulin molecule adopts a relatively compact structure,67 which also favours the diffusion of insulin into the mesh of the macrogels. After the co-incubation, the insulin-loaded macrogels were purified at 37 °C and pH = 7.4 (to reduce hydrogen bonding between amide groups of the macrogels and carboxylate groups of insulin), to insure the encapsulation of insulin molecule in the macrogels mainly via physical restriction effect of the polymer network.61,62 The yield of insulin loaded into the macrogels was determined to be as high as approximately 1613.4 wt% (expressed as the mass of loaded drug per unit weight of the dried macrogels), i.e., ca. 419.5 IU per (mg dried macrogels). The macrogels upon loading with insulin still exhibited an extremely expanding status (e.g., f6.0 mM ≈ 2200), which thereby still looked like somewhat flowable and thus allowed for injection under a certain external force by hand.
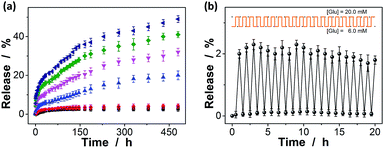
The macrogels as carriers can be effective in bringing about the controlled insulin release, as the diffusion of the physically trapped drug molecules through a hydrogel network is dependent on the changes in mesh size caused by volume change of the hydrogel.10–15,61,62 Fig. 9a shows the in vitro insulin releasing profiles from the preloaded macrogels in PBS (pH = 7.4) at 37.0 °C. Accumulated insulin release studies were performed and only limited insulin release from the macrogels was observed over the twenty days of incubation at glucose-free PBS, or PBS solution containing a normal glucose concentration ([Glu] = 6.0 mM). In contrast, the much faster insulin releases were achieved under hyperglycemic environments ([Glu] ≥ 7.0 mM), and the release can be readily gated by varying glucose concentration in the releasing medium. The time scales for insulin delivery are compatible with the patient's needs, since the macrogels can deliver insulin in less than 30 min, and the sustained release over 20 days may also meet the basal needs.68 While the glucose concentration changes clearly play a key role in the observed controlled insulin release, other phenomena might also influence the release; for instance, the hydrolysis of the cationic DMAEA segment might occurred gradually to form the negatively charged acrylic acid groups, which could enhance the Donnan potential for the macrogels to swell, favoring the long-time continuous release of insulin from the preloaded macrogels.69–71 In a further study, the recorded insulin release profile of the macrogels was found to present a pulsatile-like pattern if the glucose concentration was cyclically varied between the normal (e.g., [Glu] = 6.0 mM) and a hyperglycemic concentration (e.g., [Glu] = 20.0 mM) every 30 min for ≥20 repetitions (Fig. 9b). Clearly, the macrogels responded to the glucose concentration changes, and a maximum 38-fold increase in insulin release rate was obtained when the glucose concentration was switched to the hyperglycemic state. Collectively, these results point to the volume change of the macrogels and the subsequent insulin release is a glucose-responsive process. The observed characteristics for the glucose-gated insulin delivery can be important in treatment of diseases.
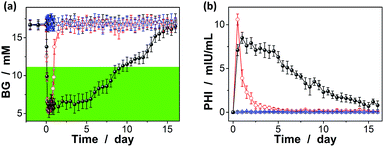
The possibility to use the macrogels as carriers for the release of insulin has been evaluated by measuring the hypoglycaemic effect of insulin to mices, using streptozotocin (STZ) induced diabetic mices (with a body weight of 0.20–0.25 kg, the fasting blood glucose levels ≥10.7 mM, and the average random blood glucose levels of ca. 16.7 mM) as the in vivo model.33 As shown in Fig. 10a (also see Fig. S13 in ESI†), the BG levels of the diabetic mice treated with an one-time subcutaneous injection of insulin-loaded macrogels (blended with PBS; to give an insulin dose of ca. 0.8 IU per kg after taking account of the release amount of insulin at [Glu] ≈ 16.7 mM) were stably maintained in the normoglycemia (<11.1 mM) range for up to eight days without distinct peaks of the hyperglycemic or hypoglycemic states; significantly, for some of the treated mices, the BG level was still maintained in the normoglycemic range for over eight days. The rapid decrease in BG levels in the first 12 hours (Fig. 10a) is likely due to the initial burst of the insulin released in the solution part or adhered on the surface of the macrogels (Fig. 10b); subsequent release of the remaining insulin encapsulated in the macrogels took place relatively slowly (Fig. 10b). The BG levels would gradually increase due to a decrease in the released insulin content or loss of bioactivity of encapsulated insulin, but were still lower than the original BG level for up to two weeks. Correspondingly, the plasma human insulin (PHI) in the mices treated with the insulin-loaded microgels can be detected over the two-week time course (Fig. 10b). In the control experiments, without a loading matrix, pure insulin (to give an insulin dose of ca. 0.8 IU per kg) was quickly cleared and resulted in a rapid decrease in plasma insulin concentration (Fig. 10b), and thus the return of the BG levels to the hyperglycemic range on the second day after administration (Fig. 10a); no significant change on the BG levels was observed on the mices injected with PBS or the empty macrogels. It is also noted that the area under the curve for pure insulin in Fig. 10b was larger than that under the curve for the insulin-loaded macrogels; it is likely that the hydrolysis of the degradable DMAEA segment might be accelerated under the complex biological environment of living mice, which can no doubt lead to the release of additional amount of insulin from the insulin-loaded macrogels.69–71 Taken together, sustained insulin release from the insulin-loaded macrogels and the pharmacological duration of insulin activity have been observed.
In addition, in vivo toxicity was assessed by analyzing changes in the amount of the white blood cells (WBC), once per day in the morning.33,72 It is well known that one of the important defense lines of animal immune systems involves WBC that can travel through the bloodstream and into tissues, searching for and attacking invaders, and a toxic change usually indicates an inflammatory leukogram that frequently accompanies a shift of the amount of the WBC in animals; that is, the amount of the WBC is highly susceptible to the cytotoxic agents.73 As for our case, after the one-time subcutaneous injection of insulin-loaded macrogels, WBC was generally displayed within the normal range (4.0–12.0 × 10⁹ L−1; see Fig. S14 in ESI†), indicating no evident leukopenia or associated toxicities.
Conclusions
We have developed a class of polymer macrogels with a highly-ordered array of pPBA microgels tethering chemically to the bridging polymers. The newly developed macrogels can exhibit rapid response rate and extraordinary large responsive swelling ratio upon adding glucose into the bathing medium over a [Glu] range of 0–30 mM at a normally physiological pH of 7.4 and at 37.0 °C. While these macrogels can swell (typically, the weight of the macrogels increase by ca. 310-fold if the [Glu] increases from 0 to 30.0 mM) and reach stable shortly (reach ∼99% of the maximum change within 90 s) after increasing [Glu] from 0 to a concentration in the range of 150.0 μM to 30.0 mM, the volume changes of the macrogels can be fully reversible within the experimental error even after twenty cycles of adding/removing glucose. While the macrogels at this extremely expanding status looked like somewhat flowable, allowing their use as injectable glucose-sensing materials, the unique microstructure of the macrogels can provide high insulin loading capacity (ca. 419.5 IU per (mg dried macrogels)), and the reversible and rapid volume change of the macrogels as a function of media glucose concentration can regulate the drug release and thereby enable a glucose-gated strategy for insulin delivery. Moreover, in vitro insulin release can be readily modulated in a pulsatile profile in response to glucose concentration changes. The preliminarily in vivo studies revealed that these formulations may improve glucose control in streptozotocin-induced diabetic mice subcutaneously administered with the insulin-loaded macrogels. Such a novel class of glucose-responsive polymer macrogels may find important biomedical applications.Conflicts of interest
There are no conflicts to declare.Acknowledgements
We gratefully acknowledge financial supports from National Science Foundation of China (21574107, 21774105, 21274118, 91227120, and 20923004), and National Fund for Fostering Talents of Basic Science (J1310024).Notes and references
- M. J. Webber, E. A. Appel, E. W. Meijer and R. Langer, Nat. Mater., 2016, 15, 13 CrossRef CAS PubMed.
- G. Z. Zhang, A. Z. Niu, S. F. Peng, M. Jiang, Y. F. Tu, M. Li and C. Wu, Acc. Chem. Res., 2001, 34, 249 CrossRef CAS PubMed.
- J. M. Hu, G. Q. Zhang and S. Y. Liu, Chem. Soc. Rev., 2012, 41, 5933 RSC.
- A. Döring, W. Birnbaum and D. Kuckling, Chem. Soc. Rev., 2013, 42, 7391 RSC.
- Y. Lu, A. A. Aimetti, R. Langer and Z. Gu, Nat. Rev. Mater., 2016, 2, 16075 CrossRef.
- Y. S. Zhang and A. Khademhosseini, Science, 2017, 356, eaaf3627 CrossRef PubMed.
- M. A. C. Stuart, W. T. S. Huck, J. Genzer, M. Müller, C. Ober, M. Stamm, G. B. Sukhorukov, I. Szleifer, V. V. Tsukruk, M. Urban, F. Winnik, S. Zauscher, I. Luzinov and S. Minko, Nat. Mater., 2010, 9, 101 CrossRef PubMed.
- X. M. He, M. Aizenberg, O. Kuksenok, L. D. Zarzar, A. Shastri, A. C. Balazs and J. Aizenberg, Nature, 2012, 487, 214 CrossRef CAS PubMed.
- I. Cobo, M. Li, B. S. Sumerlin and S. Perrier, Nat. Mater., 2015, 14, 143 CrossRef CAS PubMed.
- D. Shiino, Y. Murata, A. Kubo, Y. J. Kim, K. Kataoka, Y. Koyama, A. Kikuchi, M. Yokoyama, Y. Sakurai and T. Okano, J. Controlled Release, 1995, 37, 269 CrossRef CAS.
- J.-Y. Wu, S.-Q. Liu, P. W.-S. Heng and Y.-Y. Yang, J. Controlled Release, 2005, 102, 361 CrossRef CAS PubMed.
- V. Ravaine, C. Ancla and B. Catargi, J. Controlled Release, 2008, 132, 2 CrossRef CAS PubMed.
- M.-S. Steiner, A. Duerkop and O. S. Wolfbeis, Chem. Soc. Rev., 2011, 40, 4805 RSC.
- Q. Wu, L. Wang, H. J. Yu, J. J. Wang and Z. F. Chen, Chem. Rev., 2011, 111, 7855 CrossRef CAS PubMed.
- Y. Guan and Y. J. Zhang, Chem. Soc. Rev., 2013, 42, 8106 RSC.
- X. S. Wu, A. S. Hoffman and P. Yager, J. Polym. Sci., Part A: Polym. Chem., 1992, 30, 2121 CrossRef CAS.
- S. Matsukawa and I. Ando, Macromolecules, 1996, 29, 7136 CrossRef CAS.
- M. Antonietti, C. Göltner and H.-P. Hentze, Langmuir, 1998, 14, 2670 CrossRef CAS.
- K. Kameyama, Y. Kishi, M. Yoshimura, N. Kanzawa, M. Sameshima and T. Tsuchiya, Nature, 2000, 407, 37 CrossRef CAS PubMed.
- T. Serizawa, K. Wakita and M. Akashi, Macromolecules, 2002, 35, 10 CrossRef CAS.
- Y. Takeoka and M. Watanabe, Langmuir, 2002, 18, 5977 CrossRef CAS.
- K. Matsubara, M. Watanabe and Y. Takeoka, Angew. Chem., Int. Ed., 2007, 46, 1688 CrossRef CAS PubMed.
- T. Tanaka and D. J. Fillmore, J. Chem. Phys., 1979, 70, 1214 CrossRef CAS.
- R. Yoshida, K. Uchida, Y. Kaneko, K. Sakai, A. Kikuchi, Y. Sakurai and T. Okano, Nature, 1995, 374, 240 CrossRef CAS.
- J. Zhang, R. Xie, S.-B. Zhang, C.-J. Cheng, X.-J. Ju and L.-Y. Chu, Polymer, 2009, 50, 2516 CrossRef CAS.
- C. E. Reese, A. V. Mikhonin, M. Kamenjicki, A. Tikhonov and S. A. Asher, J. Am. Chem. Soc., 2004, 126, 1493 CrossRef CAS PubMed.
- J. Yin, D. Dupin, J. F. Li, S. P. Armes and S. Y. Liu, Langmuir, 2008, 24, 9334 CrossRef CAS PubMed.
- W. T. Wu, J. Shen, Y. X. Li, H. B. Zhu, P. Banerjee and S. Q. Zhou, Biomaterials, 2012, 33, 7115 CrossRef CAS PubMed.
- J. H. Holtz and S. A. Asher, Nature, 1997, 389, 829 Search PubMed.
- D. Nakayama, Y. Takeoka, M. Watanabe and K. Kataoka, Angew. Chem., Int. Ed., 2003, 42, 4197 CrossRef CAS PubMed.
- M.-C. Lee, S. Kabilan, A. Hussain, X. P. Yang, J. Blyth and C. R. Lowe, Anal. Chem., 2004, 76, 5748 CrossRef CAS PubMed.
- M. Ben-Moshe, V. L. Alexeev and S. A. Asher, Anal. Chem., 2006, 78, 5149 CrossRef CAS PubMed.
- Z. Gu, A. A. Aimetti, Q. Wang, T. T. Dang, Y. Zhang, O. Veiseh, H. Cheng, R. Langer and D. G. Anderson, ACS Nano, 2013, 7, 4194 CrossRef CAS PubMed.
- Y. M. Hu, X. M. Jiang, L. Y. Zhang, J. Fan and W. T. Wu, Biosens. Bioelectron., 2013, 48, 94 CrossRef CAS PubMed.
- C. E. Reese, A. V. Mikhonin, M. Kamenjicki, A. Tikhonov and S. A. Asher, J. Am. Chem. Soc., 2004, 126, 1493 CrossRef CAS PubMed.
- E. C. Cho, J.-W. Kim, A. Fernández-Nieves and D. A. Weitz, Nano Lett., 2008, 8, 168 CrossRef CAS PubMed.
- L. A. Lyon, Z. Meng, N. Singh, C. D. Sorrell and A. S. John, Chem. Soc. Rev., 2009, 38, 865 RSC.
- K. Xu, Y. Tan, Q. Chen, H. Y. An, W. B. Li, L. S. Dong and P. X. Wang, J. Colloid Interface Sci., 2010, 345, 360 CrossRef CAS PubMed.
- L.-W. Xia, X.-J. Ju, J.-J. Liu, R. Xie and L.-Y. Chu, J. Colloid Interface Sci., 2010, 349, 106 CrossRef CAS PubMed.
- Y. Tan, K. Xu, P. X. Wang, W. B. Li, S. M. Sun and L. S. Dong, Soft Matter, 2010, 6, 1467 RSC.
- W. Song, Y. Guan, Y. J. Zhang and X. X. Zhu, Soft Matter, 2013, 9, 2629 RSC.
- K. Liu, Z. H. Nie, N. N. Zhao, W. Li, M. Rubinstein and E. Kumacheva, Science, 2010, 329, 197 CrossRef CAS PubMed.
- J. Henzie, M. Grünwald, A. Widmer-Cooper, P. L. Geissler and P. D. Yang, Nat. Mater., 2012, 11, 131 CrossRef CAS PubMed.
- Y. Wang, Y. Wang, D. R. Breed, V. N. Manoharan, L. Feng, A. D. Hollingsworth, M. Weck and D. J. Pine, Nature, 2012, 491, 51 CrossRef CAS PubMed.
- E. Auyeung, T. I. N. G. Li, A. J. Senesi, A. L. Schmucker, B. C. Pals, M. O. de la Cruz and C. A. Mirkin, Nature, 2013, 505, 73 CrossRef CAS PubMed.
- T. Wang, D. LaMontagne, J. Lynch, J. Q. Zhuang and Y. C. Cao, Chem. Soc. Rev., 2013, 42, 2804 RSC.
- Y. Wang, Y. Wang, X. Zheng, É. Ducrot, M.-G. Lee, G.-R. Yi, M. Weck and D. J. Pine, J. Am. Chem. Soc., 2015, 137, 1076 Search PubMed.
- J. S. Oh, Y. Wang, D. J. Pine and G.-R. Yi, Chem. Mater., 2015, 27, 8337 CrossRef CAS.
- Q. P. Yuan, J. J. Gu, Y.-N. Zhao, L. J. Yao, Y. Guan and Y. J. Zhang, ACS Macro Lett., 2016, 5, 565 CrossRef CAS.
- É. Ducrot, M. X. He, G.-R. Yi and D. J. Pine, Nat. Mater., 2017, 16, 652 CrossRef PubMed.
- M. Zupkauskas, Y. Lan, D. Joshi, Z. Ruff and E. Eiser, Chem. Sci., 2017, 8, 5559 RSC.
- M. Chen, L. Zhou, Y. Guan and Y. J. Zhang, Angew. Chem., Int. Ed., 2013, 52, 9961 CrossRef CAS PubMed.
- B. Chu, Laser Light Scattering, Academic Press, New York, 2nd edn, 1991 Search PubMed.
- M. H. Smith, E. S. Herman and L. A. Lyon, J. Phys. Chem. B, 2011, 115, 3761 CrossRef CAS PubMed.
- L.-W. Xia, R. Xie, X.-J. Ju, W. Wang, Q. M. Chen and L.-Y. Chu, Nat. Commun., 2013, 4, 2226 Search PubMed.
- T. Hoare and D. McLean, Macromol. Theory Simul., 2006, 15, 619 CrossRef CAS.
- Z. M. O. Rzaev, S. Dinçer and E. Pişkin, Prog. Polym. Sci., 2007, 32, 534 CrossRef CAS.
- I. Sideridou-Karayannidou and G. Seretoudi, Polymer, 1999, 40, 4915 CrossRef CAS.
- C. Y. Liang and S. Krimm, J. Polym. Sci., 1958, XXVII, 241 CrossRef.
- S. H. Brewer, A. M. Allen, S. E. Lappi, T. L. Chasse, K. A. Briggman, C. B. Gorman and S. Franzen, Langmuir, 2004, 20, 5512 CrossRef CAS PubMed.
- T. Ye, X. M. Jiang, W. T. Xu, M. M. Zhou, Y. M. Hu and W. T. Wu, Polym. Chem., 2014, 5, 2352 RSC.
- W. T. Wu, N. Mitra, E. C. Y. Yan and S. Q. Zhou, ACS Nano, 2010, 4, 4831 CrossRef CAS PubMed.
- C. A. Burtis and E. R. Ashwood, Tietz textbook of clinical chemistry, W. B. Saunders, Philadelphia, PA, 3rd edn, 1999 Search PubMed.
- C. Damge, C. Pinto and P. Maincent, Expert Opin. Drug Delivery, 2008, 5, 45 CrossRef CAS PubMed.
- G. Boden, P. Cheung and C. Homko, Diabetes, 2003, 52(1), 133 CrossRef CAS PubMed.
- M. C. Villeneuve, R. E. Ostlund Jr and J. P. Baillargeon, Metabolism, 2009, 58(1), 62 CrossRef CAS PubMed.
- W. T. Wu and S. Q. Zhou, Macromol. Biosci., 2013, 13, 1464 CrossRef CAS PubMed.
- American Diabetes Association, Diabetes Care, 2016, 39, S13 CrossRef PubMed.
- N. P. Truong, Z. F. Jia, M. Burges, N. A. J. McMillan and M. J. Monteiro, Biomacromolecules, 2011, 12, 1876 CrossRef CAS PubMed.
- R. Whitfield, A. Anastasaki, N. P. Truong, P. Wilson, K. Kempe, J. A. Burns, T. P. Davis and D. M. Haddleton, Macromolecules, 2016, 49, 8914 CrossRef CAS.
- N. P. Truong, W. Y. Gu, I. Prasadam, Z. F. Jia, R. Crawford, Y. Xiao and M. J. Monteiro, Nat. Commun., 2013, 4, 1902 CrossRef PubMed.
- T. Ye, X. Bai, X. M. Jiang, Q. S. Wu, S. M. Chen, A. Q. Qu, J. W. Huang, J. Shen and W. T. Wu, Polym. Chem., 2016, 7, 2847 RSC.
- O. C. Farokhzad, J. Cheng, B. A. Teply, I. Sherifi, S. Jon, P. W. Kantoff, J. P. Richie and R. Langer, Proc. Natl. Acad. Sci. U. S. A., 2006, 103, 6315 CrossRef CAS PubMed.
Footnote |
| † Electronic supplementary information (ESI) available: SEM images (Fig. S1), DLS results (Fig. S2, S3, and S10), rheological analysis (Fig. S4), FTIR spectra (Fig. S5), photomicrographs (Fig. S6, and S7), swelling/drying cycle results (Fig. S8), ζ-potential data (Fig. S9), reflection results (Fig. S11), response kinetics (Fig. S12), and changes of the mice number in different groups within the normoglycemic range over the administration time (Fig. S13). See DOI: 10.1039/c7ra11920h |
| This journal is © The Royal Society of Chemistry 2017 |

