Apparatus for efficient utilization of isotopically-labeled gases in pulse transient studies of heterogeneously catalyzed gas phase reactions†
Adrianna
Brush
a,
Shallaco
McDonald
a,
Robin
Dupré
a,
Shruti
Kota
a,
Gregory M.
Mullen
a and
C.
Buddie Mullins
 *abcd
*abcd
aMcKetta Department of Chemical Engineering, University of Texas at Austin, 1 University Station, C0400 Austin, USA. E-mail: mullins@che.utexas.edu
bDepartment of Chemistry, University of Texas at Austin, 1 University Station, C0400 Austin, USA
cTexas Materials Institute and Center for Nano- and Molecular Science, University of Texas at Austin, 1 University Station, C0400 Austin, USA
dCenter for Electrochemistry, University of Texas at Austin, 1 University Station, C0400 Austin, USA
First published on 8th May 2017
Abstract
Transient techniques, such as Steady state isotopic transient kinetic analysis (SSITKA), are powerful methods for determining various mechanistic and kinetic insights into heterogeneously catalyzed gas-phase reactions. However, the reactor systems commonly used in these techniques underutilize the costly isotopically labeled reactants crucial to these experiments. In this manuscript, we describe a novel apparatus that allows more efficient utilization of isotopically labeled reactants. This pulse injection apparatus is relatively easy and inexpensive to install on new or existing reaction systems. Sample data and analysis of SSITKA experiments performed on this system are also included.
Introduction
Understanding the chemical reaction kinetics of a heterogeneously catalyzed system is vital for being able to design a safe, efficient, and controllable chemical system. Traditional chemical kinetic analysis tends to require performing multiple steady-state experiments of a system across a range of temperatures, compositions, and other parameters.1 In addition to being time- and resource-intensive, these techniques can be further complicated by mass transfer effects.2 In contrast, transient techniques are often able to elucidate specific kinetic parameters with relatively few experiments, making them extremely useful methods for probing the reaction kinetics and other properties of chemical reaction systems.3 One of the most powerful transient techniques is steady state isotopic transient kinetic analysis (SSITKA), first developed by Happel,4–6 Bennett,7 and Biloen.8In brief, the SSITKA technique involves bringing a catalytic reaction to steady state, then instantaneously switching one reactant with an isotopically labeled version of that same reactant. Assuming negligible kinetic isotope effects, the steady state reaction and associated kinetics are undisturbed by this switch to the isotopically labeled reactant. However, the presence and concentration of the isotopically labeled atom(s) in the reactant(s) and product(s) in the effluent can be monitored as a function of time using a mass spectrometer. Depending on the catalytic system, several valuable characteristics of the catalytic reaction can then be determined, such as mechanistic pathway insights, the presence of multiple reaction steps in series or parallel, concentration of active surface intermediates, and turnover frequency (TOF). Shannon and Goodwin produced a detailed review of the SSITKA technique in 1995,9 and Ledesma et al. have produced an updated review covering the advancements from 1995 to 2014.10 These reviews provide a comprehensive explanation of the SSITKA technique, as well as the deeper concepts, mathematics, and reaction system requirements needed for full interpretation of transient experimental results. While this manuscript will review some of the basic concepts as they relate to the data gathered using the described apparatus, readers are encouraged to consult these reviews for a more complete understanding of the SSITKA technique.
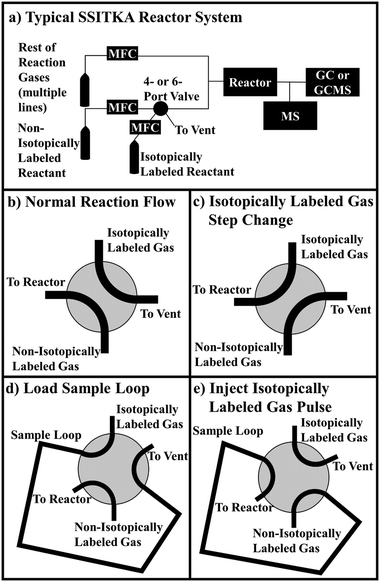
Despite the valuable mechanistic and kinetic information that can be acquired, SSITKA studies are not as widely used as they could be. Part of this is likely due to the high costs of isotopically labeled gases. Deuterium labeled gases are often some of the cheapest, but one liter (at STP) of deuterium labeled methane still costs ∼$120 (as of publication date). More expensive gases, such as 13C or 18O labeled species often cost $260 or more for one liter at STP. This is on the order of 10![[thin space (1/6-em)]](https://www.rsc.org/images/entities/char_2009.gif) 000× more than the non-isotopically labeled version of these reactants. In addition, the most common apparatus used to introduce the isotopically labeled gas underutilize much of it. A typical SSITKA reaction system is displayed in Fig. 1a, as well as the flow patterns of a 4-port valve (Fig. 1b and c, used for step-change experiments) and a 6-port valve (Fig. 1d and e, used for pulse experiments). A mass flow controller (MFC) flows the non-isotopically labeled reactant on one side of the valve, while a separate MFC flows the isotopically labeled version on the other side of the valve. A backpressure regulator is often used to match the pressure in the isotopically labeled reactant stream to the reactor pressure, before the stream is vented to atmosphere. The 4- or 6-port valve is then turned, causing the isotopically labeled reactant to flow into the system as a step change or as a pulse replacing the non-isotopically labeled reactant. These system designs waste isotopically labeled gas by venting some of the gas prior to the switch. In addition, once the pressure in the bottle of isotopically labeled gas reaches the pressure used in the experiment, the residual gas left in the bottle and tubing cannot be easily recovered and used. Since the lecture bottles commonly used for these gases are not pressurized very high (typically less than 30 psig for 1 L at STP), the unrecoverable residual gas in the bottle can represent a significant portion of the total gas (∼30% or so).
000× more than the non-isotopically labeled version of these reactants. In addition, the most common apparatus used to introduce the isotopically labeled gas underutilize much of it. A typical SSITKA reaction system is displayed in Fig. 1a, as well as the flow patterns of a 4-port valve (Fig. 1b and c, used for step-change experiments) and a 6-port valve (Fig. 1d and e, used for pulse experiments). A mass flow controller (MFC) flows the non-isotopically labeled reactant on one side of the valve, while a separate MFC flows the isotopically labeled version on the other side of the valve. A backpressure regulator is often used to match the pressure in the isotopically labeled reactant stream to the reactor pressure, before the stream is vented to atmosphere. The 4- or 6-port valve is then turned, causing the isotopically labeled reactant to flow into the system as a step change or as a pulse replacing the non-isotopically labeled reactant. These system designs waste isotopically labeled gas by venting some of the gas prior to the switch. In addition, once the pressure in the bottle of isotopically labeled gas reaches the pressure used in the experiment, the residual gas left in the bottle and tubing cannot be easily recovered and used. Since the lecture bottles commonly used for these gases are not pressurized very high (typically less than 30 psig for 1 L at STP), the unrecoverable residual gas in the bottle can represent a significant portion of the total gas (∼30% or so).
In this paper, we describe a novel apparatus for introducing pulses of isotopically labeled gases into a flow reactor system. This novel design eliminates the wasteful venting to atmosphere and allows the full contents of the gas bottle to be accessed. We estimate that a well-designed pulse injection apparatus can utilize 90% of the isotopically labeled gas for experiments, compared to ∼52% for typical SSITKA systems (please refer to the ESI† for these calculations). The apparatus utilizes a 5-port valve, a sample loop, a vacuum pump, and a novel “bellows pump” component to introduce pulses of an isotopically labeled reactant to the reactor. In addition, the apparatus removes the requirement of using a mass flow controller for the isotopically labeled gas, reducing some capital expense. This apparatus costs slightly more than an independent line and mass flow controller for the isotopically labeled gas, the set up for a typical SSITKA apparatus. The return on investment on the extra $500 spent installing the pulse injection apparatus, is recovered within 5 bottles of isotopically labelled gas used (this calculation assumed 13CH4 as the sample gas). A cost breakdown of this system compared to a typical SSITKA system is provided in the ESI.†
This apparatus has been previously used to study the dissociation mechanism of methane over a Mo2C catalyst.11 Earlier studies had used a 13CH4 experiment to assert that carbon exchange occurred between methane and the Mo2C catalyst above 550 °C.12 However, by performing 13CH4 and CD4 pulse experiments at several temperatures, it was demonstrated that carbon exchange did, in fact, not occur, and that methane likely adsorbed on Mo2C via a single C–H bond dissociation/recombination mechanism. Finally, while we primarily describe use of this apparatus for SSITKA experiments, it likely can be used or modified for use in many different types of transient pulse experiments.
Description of apparatus and system
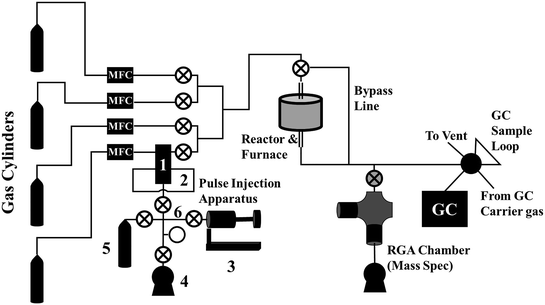
A diagram of our reactor system, including the pulse injection apparatus, is shown in Fig. 2. From left to right, our reaction system consists of:- The reactant gas cylinders, the bottom of which contains the non-isotopically labeled reactant, typically mixed with a small amount of inert tracer gas, such as Ar or He.
- Mass flow controllers for controlling the flow of the reactant gases (labeled “MFC”),
- The pulse injection apparatus, described in more detail below.
- A reactor, which, in our system, consisted of a vertical quartz reactor tube heated by an external furnace,
- An in-line mass spectrometer. In our system, this consists of a 6-way cross UHV chamber, an Extorr XT100 residual gas analyzer (RGA) equipped with a quadrupole mass spectrometer, a leak valve connected inline for continuous sampling of the effluent stream, a turbomolecular pumped backed by a mechanical vacuum pump, and an ion gauge for measuring chamber pressure.
- A gas chromatograph for quantitatively measuring the chemical composition of the product stream.
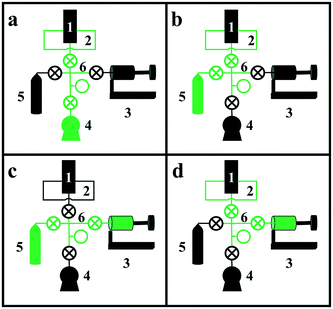
The apparatus consists of six basic components, labeled with numbers in Fig. 3: 1) a two-position, five-port valve, 2) a sample loop connected to the 5-port valve, 3) the “bellows pump,” which can be expanded and contracted to move gas between components and adjust pressure, 4) a vacuum pump, 5) the isotopically labeled gas cylinder, and 6) the valve manifold. Although each component will be described in more detail below, Fig. 3 depicts the four basic steps for loading the sample loop with the isotopically labeled gas. In each diagram, the green lines indicate open valves and connected components. In Fig. 3a, the vacuum pump is connected to the sample loop to evacuate the sample loop. In Fig. 3b, the isotopically labeled gas cylinder is connected to the sample loop to fill it with isotopically labeled gas. In Fig. 3c, the bellows pump is connected to the isotopically labeled gas cylinder and expanded to extract gas from the cylinder, if needed. Finally, in Fig. 3d, the bellows pump is connected to the sample loop, and is expanded or contracted to adjust the pressure in the sample loop to match that in the reactant stream. To inject the pulse, the switch on the 5- or 6-port valve is flipped, diverting the reactant stream to the sample loop and causing the non-isotopically labeled reactant gas to push a pulse of isotopically labeled reactant gas through the reactor system.
Some SSITKA experiments use volatile organic compounds (VOC's) for the reactants that are volatile liquids at ambient conditions. These types of experiments typically use parallel saturators, one with the non-isotopically labeled reactant, and one with the isotopically labeled reactant.13,14 While this system is not designed specifically for SSITKA experiments using a VOC reactant, we believe it is possible to modify the system to perform these types of experiments. A theoretical schematic and operational diagram, similar to Fig. 3, can be found in the ESI,† Fig. S2. It should be stressed that this is a proposed theoretical design, and we have not attempted to fabricate or test the practicality of this design.
1) 5-port valve
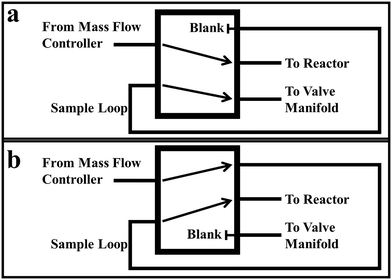
The 5-port valve operates similarly to a common 6-port GC injection valve. In fact, a 6-port GC valve with one port capped (the port that would otherwise lead to vent) could easily substitute for the 5-port valve we employ. The flow patterns of the 5-port valve in the “load” and “inject” positions are depicted in Fig. 4a and b, respectively. In the “load” position, the non-isotopically labeled reactant flows directly in and out of the valve. Meanwhile, the sample loop is connected through the 5-port valve to the valve manifold on one end, and a blank or cap on the other. In the “load” position, the sample loop can be vacuumed out and charged with the appropriate pressure of isotopically labeled gas without affecting the reactant gas stream. In the “inject” position, the non-isotopically labeled reactant flowrate is diverted to the sample loop, before continuing on to the reactor, pushing the pulse of isotopically labeled reactant through the reactor system. In this position, the piping from the valve manifold is connected to a blank or plug. Once the pulse has worked its way through the reactor system, the 5-port valve can be switched back to the “load” position with no effect on the ongoing experiment, and another pulse of isotopically labeled gas can be loaded into the sample loop.The 5-port valve we used in designing this system is a Sizto Tech Corporation (www.STCValve.com) manual hand valve (model # MPV522), though any valve with good leak properties under vacuum and functionally similar flow patterns as Fig. 3a and b is adequate for this process. Short male NPT (MNPT) to female VCR (FVCR) connections were installed onto each port. These connections allowed easier installation onto the existing reactor system tubing. In addition, these allowed greater versatility in using and changing sample loops.
2) Sample loop(s)
As indicated before, the 5-port valve was fitted with short MNPT to FVCR connections. Sample loop(s) are fabricated by fitting a male VCR (MVCR) connection onto each end of a length of tubing, then coiling and shaping the tubing so the MVCR connections can be connected to the proper FVCR connections on the 5-port valve, and so the tubing fits in its allocated physical space. The volume of a sample loop can be determined by multiplying the length by the internal cross-sectional area of the tubing. The exposure time of the isotopically labeled pulse to the reaction system can be determined by dividing the sample loop volume by the reactant flowrate. In addition, multiple sample loops can be fabricated, providing a range of sample loop sizes that can easily be exchanged on the 5-port valve. While the valve is in the “load” position, the sample loop can be removed and exchanged during a reaction run without disturbing the ongoing experiment.3) Bellows pump
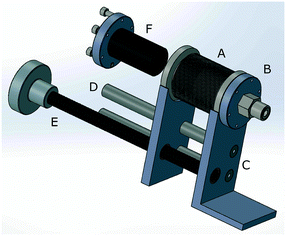
A key component of the pulse injection apparatus described in this paper is the “bellows pump.” An exploded diagram of the bellows pump can be seen in Fig. 5. In addition, a 3-D PDF diagram and SolidWorks file are downloadable in the ESI.† A compressible/expandable edge welded bellows (A) with ConFlat (CF) connections, one of which (B) connects to valve manifold, is attached to a steel mounting plate (C) on each end. The plates are connected to each other by two rods and bushings (D), as well as a worm gear with a hand crank (E). Thus, by turning the hand crank, the bellows is expanded or compressed, increasing or decreasing the volume inside the bellows pump, respectively. When the bellows pump is connected to the sample loop via the valve manifold, expanding or compressing the bellows pump allows the pressure in the sample loop to be adjusted. In addition, by expanding the bellows pump while connected to the isotopically labeled gas cylinder, gas can be extracted from the cylinder, even at pressures less than atmospheric pressure. Then, the bellows pump can be compressed while connected to the sample loop, delivering the extracted gas to the sample loop at the desired pressure. An off-the-shelf Ultra-high vacuum linear translator, such as those sold by Kurt J. Lesker (www.lesker.com), could be modified to work as a bellows pump for those not interested in custom building a bellows pump.A key feature of the bellows pump that increases gas transfer efficiency is the cylindrical plug attached to one flange of the bellows pump (F). The purpose of this plug is to occupy the empty space in the bellows pump when the bellows is completely compressed. The less empty space in the bellows pump and tubing there is, the more efficient the bellows pump will be. Our solid aluminum cylindrical plug is attached to the cap using a small threaded rod, and does not need to have an air-tight seal to the cap. In our design, we found that the stationary end of the bellows pump should be connected to the valve manifold tubing, while the cylindrical plug is attached to the flange on the moveable end. This allows a short piece of fixed, hard tubing to be used in the connection between the bellows pump and the valve manifold.
4) Vacuum pump
The vacuum pump we used was a common rotary vane mechanical vacuum pump. A convectron gauge was installed near the inlet of the vacuum pump to monitor the pressure as well as allow leak-checking of the apparatus. In our apparatus, achieving a base pressure in the low 10−2 Torr range for each section indicated acceptably low leakage rate.5) Isotopically labeled gas cylinder
This section of the isotope sample loop apparatus is relatively simple. It typically consists of a lecture bottle of isotopically labeled gas, a CGA 170 regulator, and tubing to connect the regulator to the valve manifold. To improve gas recovery efficiency, the length of tubing used between the regulator and valve manifold should be as short as possible.6) Valve manifold and pressure gauge
The various sections of the apparatus are all connected to each other using a valve manifold, each separated from the manifold using a ball valve. The simplest and shortest setup would be a 4-way cross connected to four ball valves. A tee can be added in between the cross and one of the ball valves to accommodate the pressure gauge, if desired. It should be noted that longer tubing lengths in the valve manifold contribute to more waste and less efficient gas transfer, as the gas in the manifold is lost when the manifold is used to connect the vacuum pump to the sample loop in between gas loadings.In our diagrams, a pressure gauge is part of the valve manifold, depicted by the open circle in Fig. 2 and 3. The primary use of this pressure gauge is to match the pressure in the sample loop with the pressure of the reactant in the reactor system. A mechanical gauge is generally preferable since convectron gauge readouts are affected by a gas' molecular weight. However, with proper calibration for each gas used, a convectron gauge would likely provide better accuracy. A compound gauge is used, since the system will be subject to both vacuum and pressures at or above atmospheric pressure regularly. While we only used one pressure gauge, attached to the valve manifold, in our initial construction, we recommend that other researchers also install a pressure gauge on the reactant gas line of the reactor system. This allows researchers to better match the pressure in the sample loop to the pressure in the reaction system. We found that there was benefit to having the pressure gauge as part of the valve manifold, as it allowed measurement of the pressure in the bellows pump section and isotopically labeled gas cylinder section.
Suggestions regarding vacuum
Working with vacuum requires constant attention to the possibility of leaks. Leaks are inevitable, even in well-sealed systems. As such, we have compiled some general rules for operating this system:- Periodically leak-check the system. Leak-checking involves connecting a portion of the apparatus to the vacuum pump and monitoring the final base pressure, which should not change significantly day-to-day. Leak-checking the bellows pump leg and the isotopically labeled gas cylinder leg is often done after installing a new isotopically labeled gas cylinder onto the apparatus, since these lines must be vacuumed out anyways.
- Use tubing and connections designed to hold vacuum. Stainless steel tubing, ConFlat (CF) connections and VCR connections are preferred. NPT and Swagelok™ type fittings may also be acceptable, but tend to leak more than CF and VCR fittings.
- The valve manifold and 5-port valve leg, including the sample loop, should be pumped out immediately prior to filling with isotopically labeled gas for a pulse experiment. Keeping the tubing below atmospheric pressure without active vacuum pumping allows air to leak in and possibly contaminate the isotopically labeled gas. The vacuum step should also be used as a leak check of the valve manifold, 5-port valve, and sample loop.
- The bellows pump leg and the isotope gas cylinder leg should be kept above atmospheric pressure except during sample loop loading. This ensures any leakage is a small amount of isotopically labeled gas out to atmosphere, not air into the tubing. Allowing air to leak in can contaminate much/all of the isotopically labeled gas. If a leg has been below atmospheric pressure for a significant amount of time, it may be best to pump out that line instead of risk contaminating the rest of the isotopically labeled gas.
- Gas that would be otherwise lost (such as the isotopically labeled gas in the valve manifold) can be partially recovered by expanding the bellows to extract the gas.
Observations and suggestions for designing the rest of the reactor system
Since our apparatus can be used by researchers just starting transient experiments, we would like to share some observations we have made that may be useful to others designing their own system. Researchers should consult previous literature for the design of reactors, catalyst beds, etc. that are most relevant to them.When designing the system, one should minimize the possibility of pulse broadening by minimizing mass transfer effects through the rest of the reactor system as much as is feasible. Minimizing the time the pulse spends traveling through the reactor system minimizes broadening due to mixing or diffusion. As a result, the length of tubing from the pulse injection apparatus to the reactor and then to the analytical instruments should be as short as feasibly possible. In addition, dead legs, which also contribute to broadening, should be avoided or minimized. These suggestions can apply to any SSITKA system, since it is desirable to minimize broadening of any pulse or step change function.
Researchers also must choose the type of analytical instruments to use. The most common choice is using an on-line mass spectrometer and/or a gas chromatography/mass spectrometer (GCMS). Each has their benefits and downsides.
With an on-line mass spectrometer, the masses of interest are essentially monitored continuously (typically with a resolution of one second or less, depending on number of masses monitored, dwell time, and other factors). This resolution allows phenomena to be observed that might not be detectable with the GCMS resolution. In addition, one is able to track the changes in the baseline for each mass, which can improve accuracy. However, there are several downsides. First, since all species are being detected by the mass spectrometer at once, careful consideration must be given to the fragmentation patterns of each species, including the isotopically labeled species. The National Institute of Standards and Technology provides the mass spectrometer fragmentation patterns of most common molecules.15 This means that reactions involving only relatively simple species with minimal fragmentation overlap will be the easiest to interpret. This is especially true for C2+ species, which often tend to have significant overlap with each other. In addition, the inert tracer and inert carrier gas must be carefully chosen so there is zero-to-minimal overlap with each other or any other species. Finally, mass spectrometry is only semi-quantitative, so a second analytical technique, such as gas chromatography, must also be used to quantitatively determine conversion, selectivity, etc.
Using a gas chromatograph/mass spectrometer (GCMS) is the other analytical technique often used for transient studies. In general, multiple samples are collected in separate sample loops, then analyzed using the GCMS. The resolution achieved with this technique is limited by the number of samples taken and the length of time over which they were taken, and is unlikely to achieve comparable resolution to an online mass spectrometer. However, using a GCMS has several benefits. Since the GC separates components prior to analysis with the MS, fragmentation overlap between species is not as big of a concern. This allows more complex reactants and products to be studied, though their fragmentation patterns must still allow detection of the isotopically labeled atom in the species. Other techniques generally require the use of a GCMS, such as methanation of C2+ species after separation by GC,16–21 which is useful for studying Fischer–Tropsch reactions.22,23
Data obtained from pulse experiments
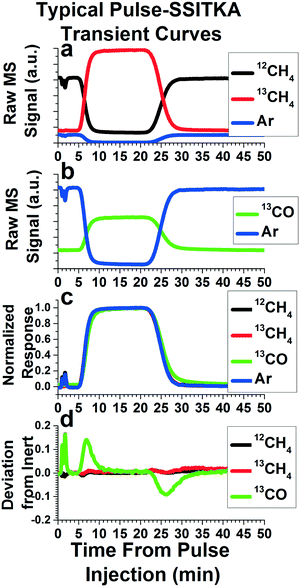
The data obtained from these pulse experiments can be treated as with any other pulse or transient methods. The reviews by Shannon and Goodwin9 and Ledesma et al.10 provide extensive explanations of the various analyses that can be made, along with the assumptions and mathematics required. While most of these techniques are described for step functions, they can apply to pulse functions as well. In fact, if the length of the pulse is long enough for the isotopically labeled species to saturate the system, these pulse functions can represent two step functions in the same experiment. One step introduces the isotopically labeled species to the system, and one step reintroduces the non-isotopically labeled species back into the system. Here, we will present some preliminary data we have acquired from our pulse injection apparatus, along with the most common analysis performed in SSITKA studies.Fig. 6 depicts the results and analysis of a Pulse-SSITKA experiment performed to probe a dry methane reforming reaction (CH4 + CO2 → 2CO + 2H2) over a Mo2C catalyst. This data is presented for demonstration purposes only, in order to provide the reader with an idea of the type of data and analysis gained from this apparatus and experiments performed on it. In this experiment, a pulse of isotopically labeled reactant, 13CH4, replaced the non-isotopically labeled reactant, 12CH4, and the resulting isotopically labeled product, 13CO, was monitored. The non-isotopically labeled reactant (12CH4) contains 5% Ar, used as an inert tracer. Addition of an inert tracer gas is a common method used in SSITKA experiments for determining the gas phase holdup of the reactor system, essentially the mass transport function of the pulse without influence from any reaction. In Fig. 6a, the raw mass spectrometry signals of 12CH4, 13CH4, and Ar are depicted. Note that the pulse is characterized by the disappearance of the inert tracer and 12CH4, and a corresponding increase in 13CH4, as would be expected. Fig. 6b depicts the mass spectrometer signal of the Ar inert tracer as well as 13CO, which shows an increase during the pulse, as would be expected.
Fig. 6c depicts one of the most common first analysis performed on a SSITKA experiment. The mass spectrometry signals for each species are normalized, and some are inverted (in this case, Ar and 12CH4), so that all of the MS signals to span from zero to one during the time period of the transient pulse experiment. As stated earlier, the normalized curve of the Ar inert tracer's mass essentially represents the mass transport function of the isotopically labeled pulse. The normalized curves of both 12CH4 and 13CH4 line up with the inert tracer curve, indicating that the reactant does not experience any significant delay compared with the gas phase holdup of the system. However, the 13C atom in the 13CH4 takes some time making its way through the mechanistic steps of the reaction before emerging from the catalyst into the gas stream as isotopically labeled product. This causes a delay in the emergence of the 13CO compared with the mass transport function of the pulse. As a result, the normalized curve of 13CO will exhibit a deviation from the normalized Ar inert tracer curve, as can be seen in Fig. 6c.
One key parameter often determined is the mean surface residence time of the isotopically labeled atom (13C) on the catalyst surface. Physically, this is the average time the isotopically labeled atom spends on the catalyst's surface, a function of both reaction rates and the number of active surface intermediates that the isotopically labeled atom can reside in. Graphically, this is represented by the space between the normalized inert tracer curve and the isotopically labeled product curve. The simplest way to determine the mean surface residence time is to subtract the normalized curve of a species of interest from the normalized inert tracer curve. This “residual” function for our sample data is plotted versus time in Fig. 6d, and is calculated by subtracting the 12CH4, 13CH4, and 13CO curves from the Ar curve in Fig. 6c. Since both 12CH4 and 13CH4 did not deviate significantly from the inert tracer, their plots in Fig. 6d do not exhibit any significant peaks. However, due to kinetic steps causing a deviation of the isotopically labeled product (13CO) from the gas phase holdup, two peaks can be easily seen for 13CO in Fig. 6d. Integrating the area under the peaks produced by this analysis is the area between the inert and isotopically labeled product curve, providing the mean surface residence time. This is true no matter the complexity of the system, reaction pathway, or reaction order. Other methods, such as fitting exponential decay curves or more complex modeling can also be used, but must be tailored to match a postulated reaction pathway.9,10 Note that, in Fig. 6c, deviations of 13CO from the Ar inert curve are seen both at the beginning and the end of the pulse. In Fig. 6d, this results in two peaks of approximately equal size, with the first positive and the second negative. As a result, two kinetic measurements of the reaction system can be made.
It should be noted that the pulse is not an ideal square pulse function. Rather, the pulse function at the introduction and exit of the pulse resembles a sigmoidal curve, or a similar form of exponential decay curve. These deviations from an ideal square pulse are due to broadening via mass transfer effects. Further, the “slope” of the pulse introduction is always steeper than the “slope” of the pulse exit, since there has been more time for broadening to occur by the pulse exit. The degree of deviation from an ideal square pulse primarily depends on flowrate, with faster reactant flowrates (both for the reactant being switched and the remaining gases) producing a curve more similar to a square pulse function. This is likely due to the shortened amount of time between injection and detection for faster flowrates, minimizing diffusion and other mass transfer broadening effects. This also explains why the pulse exit has a less sharp “slope” than the introduction. As a result, the measurement made from the pulse introduction is likely more accurate than the measurement made from the pulse exit. This is manifest in that the peak area measurement made from the pulse exit tend to be slightly greater (∼0–15% greater, depending on choices for baseline correction) than the measurement made from the pulse introduction. As a result, the measurement made from the pulse introduction should be the primary measurement, with the measurement from the pulse exit used as confirmation. A set of pulse functions from our system at different gas flowrates can be found in Fig. S3.†
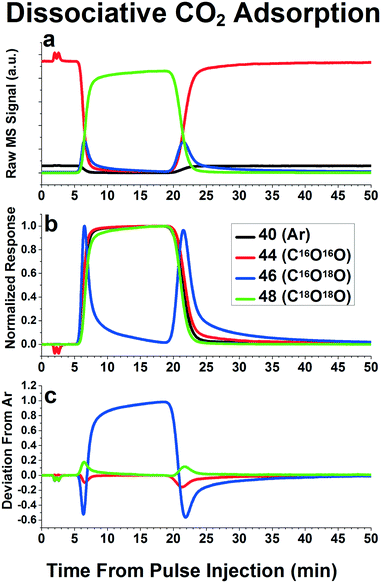
The review by Shannon and Goodwin9 provides several qualitative observations one can make about the reaction mechanisms based on the shape of the isotopically labeled product curves. One special case we found easily distinguishable in the pulse experiments inherent to our system was that of rapid dissociation/recombination of a molecule containing two isotopically labeled atoms. Fig. 7 depicts an example of this phenomenon using C16O2/C18O2, but we have also seen this phenomenon with H2/D2 and CH4/CD4.11 Since the pulse function is not a perfect square pulse function, there is a period of time where both C16O2 and C18O2 are in the reactant stream at the same time. For a reaction system that involves rapid dissociation and recombination of CO2, C16O18O will be formed during these periods of overlap, as can be seen as peaks of C16O18O in Fig. 7a. Since both C16O2 and C18O2 are being consumed to create C16O18O, during the switch from C16O2 to C18O2, the C16O2 seems to disappear faster than the Ar inert tracer, while the C18O2 appears to emerge slower than the Ar inert tracer disappears, as can be seen in Fig. 7b. At the end of the pulse, during the switch back from C18O2 to C16O2, a similar behavior is seen: the C18O2 seems to disappear faster than the Ar tracer reappears, while the C16O2 seems to reappear slower than the Ar tracer. This results in the distinctive phenomenon of both peaks of C16O2 in the residual plots curve being negative and both C18O2 peaks being positive, as can be seen in Fig. 7c. As a result, the mean residence time of the species involved cannot be measured simply by integrating the area under the peaks in the residual plots curve, but must be calculated using the gas phase holdup function (i.e. Ar inert tracer function) as well as the dissociation and recombination probabilities. However, one can gain insights into dissociation mechanisms via this technique, as was done previously by Brush et al., who used this technique to determine the dissociation mechanism of CH4 over Mo2C.11 Peaks of CH3D and CD3H were present during these “overlap” periods, but not CH2D2, indicating that the dissociation mechanism involved dissociation of a single C–H bond, not multiple C–H bonds, as had been previously suggested. Similar reaction mechanism insights could be gained by using reactants with multiple isotopically labeled atoms, and monitoring the relative emergence and disappearance of products containing zero, one, two, etc. of the isotopically labeled atoms.
Conclusions
Transient studies are extremely powerful tools for probing the mechanisms and kinetics of reaction systems. However, the high cost of isotopically labeled gases combined with the relatively few experiments each bottle provides makes these experiments quite expensive.We have designed and fabricated a new apparatus for introducing isotopically labeled gases into a flow reactor system for the purpose of performing transient kinetic experiments. This apparatus is relatively easy and inexpensive to build, and can be installed onto new or existing systems. This apparatus allows significantly more efficient utilization of the isotopically labeled gas. Experimental studies that would normally have been prohibitively expensive due to the cost of the isotopically labeled gas are now more feasible with the use of this apparatus. In addition, pulse studies have some advantages over step studies. Pulse experiments inherently produce two measurements of the reaction transients and often can provide mechanistic insights that step experiments cannot. This apparatus could make isotopic transient studies and other pulse transient studies more accessible to more researchers, while potentially providing more mechanistic insight than currently used methods.
Acknowledgements
We would like to thank the following people for their assistance in this work: Butch Cunningham, and Jim Smitherman for their help in designing, fabricating, and installing the reactor system. Kevin Haynes for helping manage the isotopically labeled gases. Edward Evans for his suggestions and insight. The authors also wish to acknowledge the generous support of the Welch Foundation (grant no. F-1436).References
- A. N. R. Bos, L. Lefferts, G. B. Marin and M. H. G. M. Steijns, Appl. Catal., A, 1997, 160, 185–190 CrossRef CAS.
- C. Mirodatos, Catal. Today, 1991, 9, 83–95 CrossRef CAS.
- R. J. Berger, F. Kapteijn, J. A. Moulijn, G. B. Marin, J. De Wilde, M. Olea, D. Chen, A. Holmen, L. Lietti, E. Tronconi and Y. Schuurman, Appl. Catal., A, 2008, 342, 3–28 CrossRef CAS.
- J. Happel, Chem. Eng. Sci., 1978, 33 Search PubMed.
- J. Happel, I. Suzukl, P. Kokayeff and V. Fthenakis, J. Catal., 1980, 65, 59–77 CrossRef CAS.
- J. Happel, H. Y. Cheh, M. Otarod, S. Ozawa, A. J. Severdia, T. Yoshida and V. Fthenakis, J. Catal., 1982, 75, 314–328 CrossRef CAS.
- C. O. Bennett, Catal. Rev.: Sci. Eng., 1976, 13, 121–148 CAS.
- P. Biloen, J. Mol. Catal. A: Chem., 1983, 21, 17–24 CrossRef CAS.
- S. Shannon and J. G. J. Goodwin, Chem. Rev., 1995, 95, 677–695 CrossRef CAS.
- C. Ledesma, J. Yang, D. Chen and A. Holmen, ACS Catal., 2014, 4, 4527–4547 CrossRef CAS.
- A. Brush, G. M. Mullen, R. Dupré, S. Kota and C. B. Mullins, React. Chem. Eng., 2016, 1, 667–674 CAS.
- D. C. LaMont, A. J. Gilligan, A. R. Darujati, A. S. Chellappa and W. J. Thomson, Appl. Catal., A, 2003, 255, 239–253 CrossRef CAS.
- M. El-roz, P. Bazin, M. Daturi and F. Thibault-starzyk, ACS Catal., 2013, 3, 2790–2798 CrossRef CAS.
- M. El-roz, P. Bazin, M. Daturi and F. Thibault-starzyk, Phys. Chem. Chem. Phys., 2015, 17, 11277–11283 RSC.
- D. NIST Mass Spec Data Center, S. E. Stein, in NIST Chemistry WebBook, NIST Standard Reference Database Number 69 Search PubMed.
- H. Shou and R. J. Davis, J. Catal., 2013, 306, 91–99 CrossRef CAS.
- N. Lohitharn and J. G. Goodwin, Catal. Commun., 2009, 10, 758–762 CrossRef CAS.
- J. Gao, X. Mo and J. G. Goodwin, J. Catal., 2010, 275, 211–217 CrossRef CAS.
- D. M. Stockwell and C. O. Bennett, J. Catal., 1988, 110, 354–363 CrossRef CAS.
- D. M. Stockwell, J. S. Chung and C. O. Bennett, J. Catal., 1988, 112, 135–144 CrossRef CAS.
- S. Hanspal, Z. D. Young, H. Shou and R. J. Davis, ACS Catal., 2015, 1737–1746 CrossRef CAS.
- Y. Qi, J. Yang, D. Chen and A. Holmen, Catal. Lett., 2015, 145, 145–161 CrossRef CAS.
- C. Ledesma, J. Yang, E. A. Blekkan, A. Holmen and D. Chen, ACS Catal., 2016, 6, 6674–6686 CrossRef CAS.
Footnote |
| † Electronic supplementary information (ESI) available. See DOI: 10.1039/c7re00038c |
| This journal is © The Royal Society of Chemistry 2017 |

