Conversion of a resistant pollutant, phenol, into green fuels by gasification using supercritical water compressed up to 1000 bar†
Nicolas
Martin-Sanchez
 ,
M. Jesus
Sanchez-Montero
 ,
Carmen
Izquierdo
 and
Francisco
Salvador
 *
*
Dpto. Química Física, Facultad de Ciencias Químicas, Universidad de Salamanca, Plaza de la Merced s/n, 37008 Salamanca, Spain. E-mail: nicolas_martin@usal.es; chusan@usal.es; misiego@usal.es; salvador@usal.es; Tel: +34 677549970
First published on 5th September 2017
Abstract
For green sustainable chemistry, it is crucial to investigate the destruction of such a common pollutant as phenol. This study reports the gasification of phenol with steam and supercritical water (SCW) and shows that gasification under high-pressure SCW is a method that destroys and efficiently converts phenol into valuable products. To the best of our knowledge, the widest pressure range ever investigated in this field is utilized, i.e., from atmospheric pressure steam to SCW at 1000 bar. The high temperature used (700 °C) leads to fast degradation of phenol under all the conditions studied but the amount of phenol gasified does strongly depend on pressure. During gasification, polymeric compounds such as naphthalene and phenanthrene are generated. They play a key role in the proposed degradation–gasification mechanism since they are difficult to degrade and can lead to the formation of char. High-pressure SCW can more efficiently degrade and gasify such polymeric compounds compared to steam. Then, the supercritical fluid leads to the conversion of a greater amount of phenol into gas than steam: 68% of the pollutant is gasified at 750 bar and 700 °C after 16.5 min with no generation of pollutant by-products, except CO2. Furthermore, the gaseous stream contains the valuable green gases H2 and CH4. The use of highly compressed SCW implies not only the production of more gases but also the enrichment of the gas mixture in H2 and CH4. H2 and CH4 concentrations up to 35 and 30%, respectively, are obtained at 1000 bar.
1. Introduction
Phenol is widely used in the paper, textile, pharmaceutical, and petrochemical industries. Owing to the poor management of the wastes generated from these industries, phenol is typically released in water as a pollutant. Despite its low concentration in water, it is a toxic species and it must be removed from polluted streams. A few methods employed to purify such polluted streams involve the separation of phenol,1 such as extraction with organic solvents or adsorption on activated carbons. However, these methods do not solve the basic problem as phenol is not destroyed, and it can return to the environment. Nevertheless, they allow obtaining more concentrated streams of phenol. As these streams are more concentrated in phenol, they become suitable to be purified by some existing methods focused on the destruction of phenol; these methods require harsh reaction conditions (use of chemical reagents, electric current, and/or high temperatures), and because of these conditions, the destruction of highly diluted phenol in water streams with considerable flows is not feasible.Busca et al.1 have reported an exhaustive revision of the methods for the destruction of phenol. Most of these methods are based on phenol oxidation, which generates CO2 and water as main products, both of them with scarce or no energetic or commercial interest. Among the methods utilized, some promising alternatives exist, e.g., conventional homogeneous Fenton reaction, direct anoxic oxidation, or photocatalytic oxidation. All these methods are cost-effective, simple, and relatively efficient. However, these methods also suffer from drawbacks: treatment times are lengthy (generally greater than 1 h); typically, phenol is not completely converted into CO2 and water; the generated by-products (hydroquinone and benzoquinone) are even more toxic than the original pollutant; and some methods utilize expensive reagents. Most of these methods demonstrate improvement with the use of catalysts, but this route also suffers from disadvantages, apart from the evident necessity of synthesizing the catalysts. Catalysts are easily deactivated; homogeneous catalysts must be recovered by employing an additional separation step; and heterogeneous catalysts can suffer from structural damage and loss by leaching.
The gasification of phenol using supercritical water (SCW) is one of the least investigated, albeit most interesting, methods for phenol destruction. This process is energetically exigent as it is carried out at high pressures (Pc: 221 bar) and temperatures (Tc: 374 °C), but it exhibits important advantages. SCW dissolves organic compounds and gases, leading to high reaction rates (low diffusion restriction). In addition, the use of SCW is environmentally friendly; since supercritical fluids behave not only as solvents but also as reagents, neither organic solvents nor additional reagents (e.g., ozone, hydrogen peroxide, or ferrate ions) are required. The formation of chlorinated organic compounds, dioxin and furan, produced during other high-temperature processes, is also avoided. Finally, it is not only a clean and efficient method, but is also capable of converting the pollutant into valuable products: two gases qualified as green fuels, H2 and CH4, are among the produced species.
The gasification of phenol using SCW is also important from another viewpoint. Supercritical gasification of biomass is one of the most promising methods to produce H2. Phenol is within the lignin's structure, one of the most raw materials used in this field. Furthermore, it appears as a by-product of the gasification of other types of biomass2 and it is one of the last barriers for gasifying it completely owing to its inert nature;3 hence the analysis of how this compound behaves in contact with SCW becomes really interesting.
Only a few studies have reported on this topic despite its importance. Temperatures greater than 600 °C are required to convert meaningful amounts of phenol into gas. Sometimes, the energy requirements of the process are decreased and/or the reaction is accelerated using catalysts.2,4–6 Some authors have suggested that the use of Ni-containing alloys in the reactors to support the harsh reaction conditions may also play a catalytic role in gasification.7 The effect of pressure on the reaction is not clear because only a few studies have reported the effect of this variable and the ranges investigated are not considerably wide, namely, 220 to 490. Gökkaya et al.6 have reported that the percentage of phenol gasified is reduced from 64.6% at 215 bar to 58.1% at 435 bar during gasification at 600 °C of solutions with different phenol concentrations for 60 min. Professor Savage's group initially affirmed the existence of an optimal pressure within the interval they studied, from 275 to 321 bar.8 However, in a later study, his group reported that the gas yields of the gaseous products of the reaction tend to increase when SCW was compressed from 275 to 490 bar.9
In this study, we report the degradation and gasification of phenol with water within the widest pressure range ever utilized in this field, from 1 to 1000 bar. We show the true effect of pressure on the process by investigating how the reaction behaves at pressures never assayed in the above-cited studies. Both the comparison between the use of steam and SCW as gasification agents and the compression of SCW to pressures above 500 bar to gasify phenol are reported. By this way, the conditions that actually favor the degradation and gasification of this pollutant are clarified.
The high temperatures required suggest that the reaction occurs via free-radical formation,10 but there is no unanimity in the identification of the pathways of the reaction mechanism (see the ESI†). Although different reaction pathways have been proposed, a general pattern can be deduced.4,5,7–13 Phenol can be gasified in a somewhat direct route or can produce other intermediate products via different reactions. Depending on the nature of the intermediates, they are also finally gasified or they participate as precursors to form char. The analysis of how the compounds produced change with the reaction time at the different pressures utilized herein can provide valuable information about the reaction mechanism. In particular, the presence of these compounds can aid not only in the identification of the pathways implied in the gasification of phenol but also in the analysis of the importance of each pathway depending on the gasification pressure.
2. Experimental
2.1. Gasification
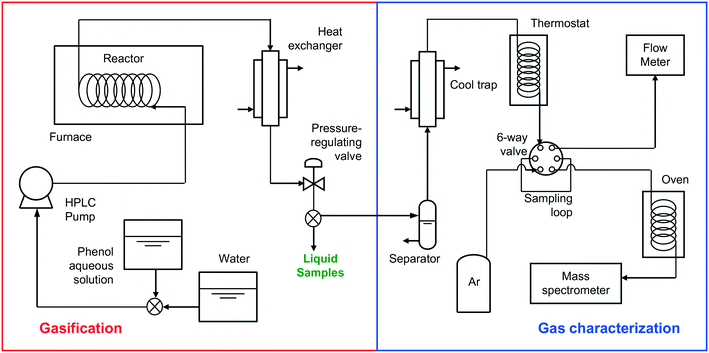
Fig. 1 shows the schematic of the installation used for the gasification experiments.A tubular Hastelloy reactor was introduced into an electric furnace able to heat up to 700 °C, where it was heated to the desired gasification temperature, while a stream of water was passed through the reactor. All experiments were carried out at 700 °C since at lower temperatures the gas flow produced was too low to be measured using the flow meter. Once the desired temperature was attained, the water stream was replaced by an aqueous solution of phenol at a known concentration (1 × 10⁻¹ M or 1 × 10⁻² M), which was pumped through an HPLC ChromTech UHP 1500 pump. The stream leaving the reactor went through a heat exchanger, where it was cooled to ambient temperature. Next, the stream was discharged through an automatic pressure-regulating valve, which was used to control the gasification pressure. Once the stationary state was attained, the process was maintained for 60 min to assess the stability of the reaction. After 60 min, a water stream replaced the aqueous phenol solution for 30 min to remove any pollutant remaining in the reactor. Three reactors of different sizes, 17, 190, and 250 cm3, respectively, were used. Despite the different tube cross-sections used, all the assays were carried out under laminar regime conditions (Reynolds number <600). The residence time of each assay was calculated by allowing the concentration of the solution to approach that of pure water at the same pressure and temperature.
2.2. Analysis of the produced gaseous stream
The flow, composition, and concentration of the produced gases were analyzed. The gases were separated using a liquid–gas separator and passed through a cool trap at −20 °C to retain the remaining humidity and a thermostat at 30 °C until they reached a six-way valve. This valve was used to analyze the flow of gas generated with a Restek ProFLOW 6000 electronic flow meter (measurement range: 1 to 500 cm3 min−1) continuously and the concentration of the gases produced with a mass spectrometer (Omnistar GSD 300) accurately. The gas concentrations were analyzed four times in each assay. In all of the assays, the gas concentration did not change once the stationary state had been attained.The characterization of the gaseous stream permits the calculation of the carbon gasification efficiency (CGE), eqn (1):
 | (1) |
Here, the carbon contained in the gas is calculated using the molar flow of CO, CO2, and CH4 produced, and the carbon in the feed is calculated based on the molar flow of phenol fed to the reactor.
2.3. Analysis of the liquid stream
In each assay, a liquid sample was directly taken from the pressure-regulating valve to subsequently analyze its composition by gas chromatography coupled to mass spectrometry (GC-MS). More details related to this procedure are described in the ESI.† The percentage of phenol degraded is calculated from this analysis, eqn (2): | (2) |
3. Results and discussion
Three different products were generated from the experiments, those present in the aqueous effluent leaving the reactor, the gaseous products, and others that formed a carbonized solid residue, char. The first two products were analyzed by the techniques described in the previous section. The solid residue was detected during the periodic cleaning of the reactor. Small carbonized particles were deposited on the surface of the reactor. However, the installation used herein hindered the measurement of the amounts of char under different reaction conditions.3.1. Degradation and gasification of phenol at high temperature
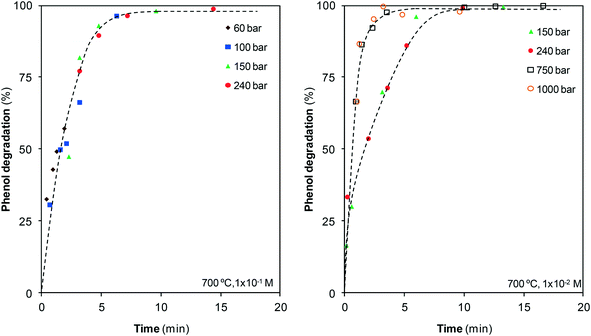
The phenol–water reaction is a complex process starting from phenol degradation followed by conversion into other species. As aqueous phenol solutions are extremely stable to temperature, the possibility of degrading phenol using steam and SCW at 700 °C was first examined. Fig. 2 depicts the results obtained from the GC-MS analysis of the liquid stream, which shows the effect of pressure and residence time on the percentage of phenol degraded.Under these conditions, rapid phenol degradation is observed as, regardless of pressure, all of the pollutant disappears after 10 min or earlier. Phenol is rapidly degraded at the earliest moments. However, with the progress of the reaction, degradation becomes slower, although finally phenol is completely destroyed. No differences are observed at the different pressures investigated within the vapor phase and near the critical point; however, once the supercritical region is reached, the degradation rate noticeably increases with the compression of SCW. Above 750 bar, pollutant degradation is so rapid that no meaningful differences are observed in comparison with the reaction at 1000 bar.
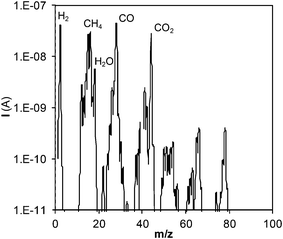
Once the phenol molecules are degraded, different reactions occur in the bulk of the steam/SCW, some of which will finally produce gaseous products. The analysis of the generated gaseous stream permits the calculation of the percentage of the phenol fed into the reactor that is finally converted into gas. To perform this analysis, the gaseous species produced were first identified. Fig. 3 shows the mass spectra of the gaseous stream; the main species produced are H2, CO, CO2, and CH4.
Only these four gases are considered since their concentrations are approximately 20 times greater (or even more) than those of other species contained in the gas. Spectral measurements were repeated under other experimental conditions, and the same conclusion was attained.
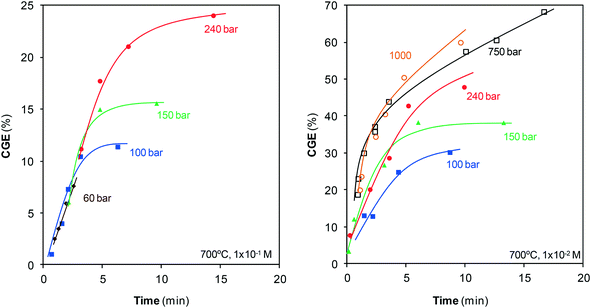
Once the gases generated are identified, the efficiency of gasification, CGE, is calculated, Fig. 4.
The pressure range employed for gasification was 1–1000 bar, but the treatments at atmospheric pressure revealed that steam cannot gasify phenol under these conditions. Gasification only begins at pressures greater than 50 bar. CGE rapidly increases with pressure when compressing from 60 to 150 bar and maintains the same trend once the critical point is surpassed until a pressure of 750 bar is attained. This effect of pressure agrees with that reported by Huelsman and Savage.11 The gasification rate also increases during compression from 750 bar up to 1000 bar, although this acceleration is less remarkable than the acceleration observed at lower pressures.
The results obtained can be interpreted as a result of the considerable changes suffered by the structure and properties of water with varying pressure. The highly ordered structure of liquid water is the result of an infinite network of hydrogen bonds, but this structure changes with the variation in temperature and pressure. At the critical point, a small fraction of the network is still preserved. Once within the supercritical region, the number of bonds will depend on the temperature and pressure of water as these bonds tend to form with the compression of water, but they are destroyed when the water is heated.
The changes in the number of hydrogen bonds lead to the variation in the dielectric constant of water.14 This phenomenon implies that the interactions that exist among the water particles experience considerable changes with the change in the pressure and/or temperature. The same phenomenon occurs when a solute is present in water. Solute–water interactions change, and if a reaction occurs, these interactions affect the rate constant by modifying the free energy of activation and the transmission coefficient.15
Previous studies have indicated that solvation effects are also important for free-radical reactions. For example, for the dissociation of hydrogen peroxide in SCW, the rate constant increases with pressure until the critical density of water is attained.16 The transition state theory explains the dependence of the reaction rate on pressure as follows, eqn (3):
 | (3) |
In highly compressible media, such as supercritical fluids in the vicinity of the critical point (density(700°C,240bar) = 0.06 g cm−3), the ΔV# value becomes progressively more negative with pressure and the reaction rate progressively increases. As the density of the fluid becomes similar to the critical density, the solvation shell becomes more saturated because of the high fluid compressibility and the effect of pressure progressively disappears.15 Maybe because of that reason, the compression of SCW from 750 (density(700°C,750bar) = 0.21 g cm−3) to 1000 bar (density(700°C,1000bar) = 0.28 g cm−3) only leads to slight acceleration of gasification (relative density(700°C,1000bar) = 0.73).
In summary, the data suggested that the changes suffered by the structure of water during compression ease the transformation of reagents into products. Consequently, the highest CGEs are obtained at the highest pressures.
Fig. 4 also shows the evolution of gasification with residence time. Gases are generated from the start, suggesting the existence of some pathway via which phenol is gasified almost immediately. In fact, CGE increases noticeably at the initial instants of the reaction. Phenol will not be converted directly into gas, but will have to pass through some stage in which it will be decomposed into other lighter species, which will be the actual precursors for gasification. The peaks observed in the mass spectra of the gases with m/z of 50–70 (Fig. 3) may correspond to those species that can be gasified easily. These species are present in extremely low concentrations compared with those of the main products; hence, in this study, they were not analyzed in detail. Furthermore, we can assure that they do not appreciably affect the calculation of CGE.
The increase of CGE is mitigated with the progress of the reaction until a plateau is reached, which shows that gasification does not progress further. The final CGEs at low pressures are lower than those at supercritical pressures because the slowdown occurs earlier under these conditions. For the highest pressures, the plateau is not yet traced at the residence times investigated although it is suspected that probably the same behavior would be observed.
Fig. 2 and 4 confirm the efficiency of this method, particularly when SCW at high pressures is used. In barely 10 min, all of the phenol has disappeared and noticeable amounts of the pollutant have converted into gas. For example, at that reaction time, the compression of steam from 100 bar to SCW at 240 bar allows for the increase of CGE from 30% to 48%, and the compression of SCW up to 1000 bar increases the CGE to 60%. Furthermore, an important fraction of this gas contains two valuable species such as H2 and CH4, as discussed in section 3.3.
The lack of studies for the supercritical gasification of phenol limits the comparison of these results with those already published, Table 1.
| Authors | Pressure (bar) | Temp (°C) | Time (min) | Concentration (M) | Catalyst | Reactor material | CGE (%) |
|---|---|---|---|---|---|---|---|
| a GCB: graphitized carbon black. b Calculated from the molar yields of CO, CH4, and CO2. c Symbol ≈ is used when CGE is approximated using graphical values. | |||||||
| Yu et al.2 | 271 | 500 | 32 | 0.59 | Ru/GCBa | SS316 | 100 |
| Guan et al.4 | 300 | 550 | 20 | 0.53 | Ru/CeO2 | SS316 | 87 |
| Gökkayaet al.6 | 215 | 600 | 60 | ∼0.39 | — | SS316 | 64.6 |
| 435 | 600 | 60 | 2.48 | — | SS316 | 58.1 | |
| 215 | 600 | 60 | ∼0.39 | K2CO3 | SS316 | 82.5 | |
| Goodwin and Rorrer7 | 250 | 750 | 0.4 | 0.213 | — | Hastelloy | ≈65c |
| DiLeo et al.8 | 489 | 600 | 60 | 0.56 | — | Quartz | ≈33 |
| 275 | 600 | 60 | 0.22 | Ni | Quartz | ≈100 | |
| 489 | 600 | 60 | 0.56 | Ni | Quartz | ≈75 | |
| Huelsman and Savage9 | 280 | 600 | 60 | 0.1 | — | Quartz | ≈1.4b |
| 490 | 600 | 60 | 0.1 | — | Quartz | ≈3b | |
| 321 | 700 | 30 | 0.095 | — | Quartz | ≈13b | |
| Yong and Matsumura10 | 250 | 450 | 1.4 | 0.011 | — | SS316 | ≈ 10 |
The CGE values reported in other studies are lower than those shown in Fig. 4, although the gasification conditions are different (lower pressures and temperatures). Using a higher temperature, 700 °C, than those reported in the studies shown in Table 1 has different consequences. Energy requirements increase but the efficiency of the method improves (endothermic reaction) and leads to high CGEs. Efficient destruction of the pollutant is achieved at short residence times so that the energy consumption at high temperature may not be as great as expected in comparison with low temperature. Regarding the effect of pressure, Fig. 4 clearly shows that the CGEs reported here are higher than those reported in Table 1 because higher pressures are investigated. On the other hand, CGE noticeably increases with the use of catalysts, even reaching complete gasification.2,8 The study by Goodwin and Rorrer is the only one in which the CGE values approach (and in fact exceed) the values reported herein. Gasification was carried out at 750 °C and in only 27 s of reaction time, with no catalyst, a 65% CGE value was attained.7 These authors affirm that these high values are related to the use of Ni-containing materials in the reactor, which could catalyze the reaction. This catalytic effect is not observed in the remaining previously reported studies as the reactors are made of inert materials (quartz, SS316). The low CGE values observed in Fig. 4 for such short residence times (CGE240bar,700°C,15seg = 7.6%) suggest that herein, the reaction is not catalyzed by the reactor materials, at least in a noticeable manner. Regardless of this inference, the compression of SCW at high pressures can be concluded as a rapid, efficient method to destroy and upgrade phenol.
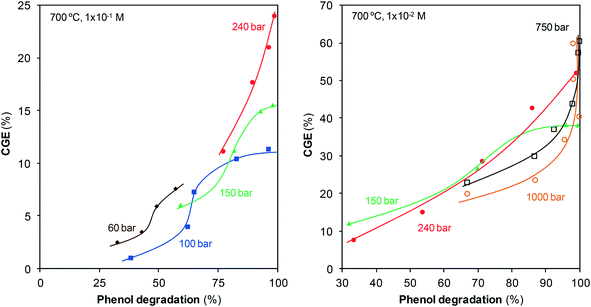
As can also be observed in Fig. 2 and 4, the percentages of degraded and gasified phenol evolve in a similar manner, although some differences exist. Fig. 5, which plots CGE as a function of the percentage of degraded phenol, highlights these differences and provides new details about the process.
The data corresponding to the lowest pressures, 60 and 100 bar, indicate that the reaction goes through three stages. At the start of analysis, greater than 25% of phenol is already degraded, but gasification is only starting, as confirmed by the horizontal trend. After some time, degradation continues, but it is slower, while noticeable amounts of gases appear, leading to a vertical curve. At the last stage, degradation continues but gasification begins to stop, which makes the curve turn horizontal again. This last stage is clearer at 150 bar: as the reaction approaches 100% degradation, gasification stops, and no more gases are produced despite the increase in the reaction time.
Under supercritical conditions, the measurable residence times are longer than those under steam conditions because of the high fluid density and, furthermore, the degradation is rapid. As a result, the initial stage at which gasification has not begun cannot be observed during SCW treatment. The stage at which gasification is more rapid than degradation is also observed during the supercritical treatment, but the last stage in which the gas production stops is not observed. On the other hand, and in contrast to steam treatment, once all of the phenol is degraded, gasification continues.
These results suggest that gasification goes through different pathways or that the rates of those pathways change depending on the physical state of water. The analysis of the species found in the aqueous effluent provides more information about this topic.
3.2. Composition of the liquid effluent
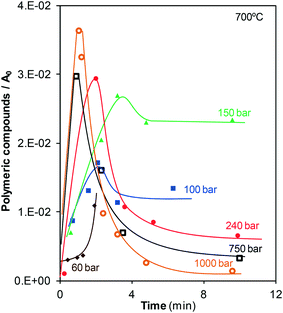
GC-MS analyses revealed the presence of two compounds in the liquid samples: extremely low concentrations of monoaromatic compounds, e.g., ethylbenzene and xylenes, and polymers with two (naphthalene) and three (phenanthrene) aromatic rings, which were present in considerably higher concentrations than the monoaromatic compounds. These compounds have been reported as precursors for the formation of char,9,10 although char may also be directly formed from phenol.4,10 Some studies concerning the supercritical gasification of other types of biomass also state that the formation of char occurs because of cross-linking reactions between degradation intermediates. Cross-linking produces high-molecular-weight fragments that ultimately form char.17 For example, this char formation pathway has been observed in the supercritical gasification of lignin and its model monomeric compound, guaiacol.17–19 In those cases, a phenolic char is formed since oxygen-containing intermediates such as catechol and 2-phenoxybiphenyl are produced. Here, the nature of the char could not be analyzed but the identified non-oxygen-containing intermediates suggest that it may be an aromatic char.Fig. 6 shows the amount of polymeric compounds present in the liquid effluent as a function of time at the different pressures investigated.
In general, the same trend is observed at all the pressures investigated. The behavior observed is characteristic of an intermediate in a mechanism with several consecutive reactions. Polymers are formed since the start of the reaction; consequently, the polymers are possibly formed directly from the unique precursor present at the start, i.e., phenol. After a certain time, the rates of formation and consumption of polymers become equal to each other, and the curve shows a maximum. The reaction continues and the rate at which the polymers are consumed becomes greater than that at which polymers are formed. As observed in Fig. 2, at reaction times greater than 3–5 min, there is almost no phenol remaining in the bulk fluid and it is logical that the formation of polymers becomes slow. Finally, the formation and consumption rates are equal to each other again, and a plateau is observed. The value of the final plateau depends on the gasification pressure. At 100 and 150 bar, the naphthalene and phenanthrene concentrations slightly decrease once the maximum is surpassed, and then these concentrations become stable, indicating that only a fraction of the polymers formed is consumed at low pressures. On the other hand, at pressures greater than the critical pressure, almost all of the formed polymers disappear at long enough residence times. Furthermore, it seems that the ability of SCW to react with the polyaromatic compounds slightly increases with pressure. For example, all of the polymers formed are almost consumed by SCW at 1000 bar after 10 min. It is logical to state that this high consumption is related to the increase in the reactivity of water as it is compressed, a phenomenon that has been previously described.
A relationship can be established between the data shown in Fig. 6 and 4. For subcritical treatment, the end of gasification is in agreement with the appearance of the plateau for polymers. Since no phenol is present at these reaction times (Fig. 2), the direct pathway of gasification of phenol cannot occur. Then, the polymers are the major products contained in the bulk fluid liable to be gasified. However, the data indicate that water can consume only a fraction of all of the polymers formed below the critical point. Because of that reason, when the consumption of naphthalene and phenanthrene by steam ends, the production of gas also stops. On the other side, Fig. 6 reveals that polyaromatic compounds are effectively consumed during supercritical treatment because of the higher reactivity of SCW. Because of this high reactivity, although the majority of phenol has already disappeared, the generation of gases continues, and CGE keeps increasing with time, especially at the highest pressures investigated, 750 and 1000 bar. Again, the polymers are not directly gasified. They decompose into other lighter products because of the action of steam and SCW and these easily gasifiable species will be finally converted into gas.
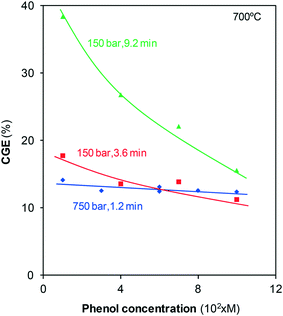
These results indicate that the fraction of phenol that is finally converted into gas strongly depends on the formation of polymers and their later consumption. The decomposition of such compounds has already been identified as the rate-determining step in previously reported studies on supercritical gasification.20 The polymers are formed from phenol so that different concentrations of the precursor possibly lead to the formation of different amounts of naphthalene and phenanthrene. To delve into that hypothesis, a series of tests were carried out in which the phenol solution concentration, pressure, and residence time were modified, and CGE was calculated, Fig. 7.
For the treatments at 750 bar for 1.2 min, CGE is almost constant and near 13–14%. At short residence times, gas formation mainly occurs via direct phenol gasification; the polymers are still being formed, and the step in which their reaction with water determines CGE is not yet reached. Furthermore, the properties of SCW at such high pressures allow for the efficient gasification of not only highly diluted solutions but also more concentrated solutions. Thus, the proportion of the gasified pollutant is independent of the solution concentration.
For the treatments at 150 bar, greater than 70% of phenol disappears after 3.6 min, Fig. 2. At this reaction time, only some gases are generated via direct gasification as only approximately 30% of phenol remains. Under these conditions, several polymers are already formed (Fig. 6), but the steam at 150 bar cannot efficiently gasify the polymers. As the higher the concentration of phenol, the greater the amount of polymers formed, the steam can gasify diminishing fractions of the polymers. Consequently, CGE slightly decreases with concentration.
For the same pressure, 150 bar, and a residence time greater than 9 min, gasification has reached the final plateau, Fig. 4. According to the hypothesis considered, under these conditions, the amount of phenol converted into gas strongly depends on the amount of polymers that have reacted with steam. The data in Fig. 7 indicate that CGE noticeably decreases as the solutions are progressively more concentrated. This tendency confirms that the increase in the phenol concentration generates high amounts of polymers that the steam cannot gasify, leading to low CGE values. Then, if highly concentrated phenol streams had to be treated, SCW at high pressures and/or temperatures should be used to achieve an efficient gasification.
The data in Fig. 7 may explain the decrease in the CGE values with pressure reported by Gökkaya et al.6 These authors investigated the gasification of phenol using batch reactors. To achieve different gasification pressures, the authors use different concentrated phenol solutions (from 0.55 g/15 mL to achieve 200 bar up to 3.5 g/15 mL to achieve 425 bar). In this manner, more polymers may be formed with increasing pressure and concentration, which may hinder gasification; hence, in that case, the lowest CGE is obtained at the highest pressure investigated.
3.3. Composition of the gaseous stream
It is crucial to estimate the concentrations of the gases generated not only to calculate the concentration of phenol gasified but also to examine their evolution with time and pressure as it provides information about the pathways involved in the phenol–water reaction. Fig. 8 shows the evolution of the concentrations of the main four gases identified during gasification of 10−2 M phenol solution at 700 °C in a pressure range from 100 to 1000 bar. The evolution of these concentrations for the gasification of 10−1 M phenol solution at 700 °C in a pressure range from 60 to 240 bar is shown in the ESI.†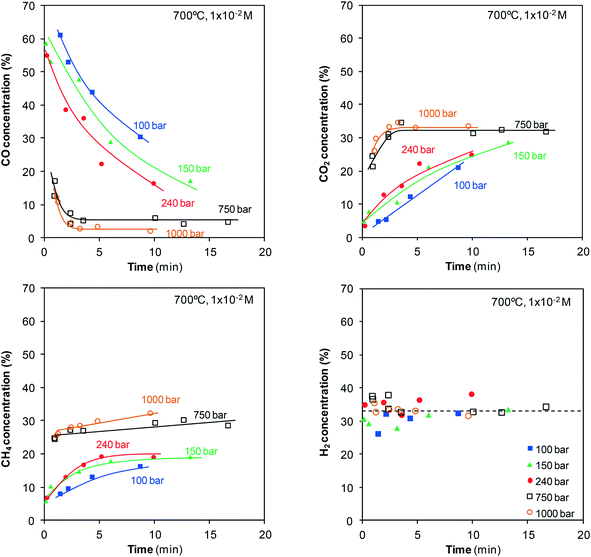 | ||
| Fig. 8 Evolution of the concentrations of CO, CO2, CH4, and H2 produced during the gasification of phenol. | ||
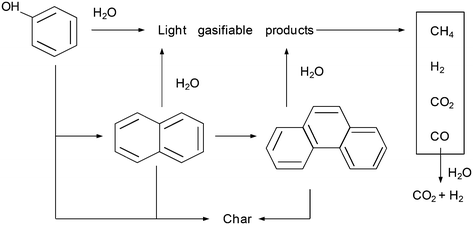
These results can be interpreted considering a mechanism for the degradation/gasification of phenol such as that shown in Fig. 9.
According to this mechanism, phenol can be consumed as a result of its decomposition to light products that are easily gasified or its conversion into polymeric compounds, which are more difficult to gasify. The results discussed in the previous sections clearly suggest that the gases generated at the beginning of gasification mainly originate from phenol, whereas those generated with the progress of the reaction mainly originate from the polymeric compounds. The mechanism also considers other secondary reactions occurring among the gases produced.
As shown in Fig. 8, CO accounts for greater than half of the gas generated at the start at low pressures. On the other hand, H2 accounts for a relatively high percentage (>30%). The other two gases, CO2 and CH4, are present in much lower concentrations. However, at pressures of 750–1000 bar, only marginal concentrations of CO are generated, whereas those of CO2 and CH4 increase to 25–30%. The H2 concentration barely changes, remaining constant at 30–35%. In other words, the use of highly compressed SCW implies not only the production of more gases but also appreciable changes in their concentrations. The gas concentrations also change as the residence time is lengthened (Fig. 8). Some inferences can be made even though a few individual reactions simultaneously occur. The CO concentration decreases with time, whereas the CO2 concentration shows an opposite trend. This behavior is evidence of water-gas shift reaction, eqn (4):
| CO + H2O ↔ CO2 + H2 | (4) |
The considerable decrease in CO concentration as the water is more compressed is related to the changes observed in the water-gas shift reaction with pressure. At low pressures in the steam state, it is a slow reaction that occurs via an ionic mechanism, but it changes to a radical mechanism under supercritical conditions. Once the supercritical region is reached, the formation of CO2 and H2 is enhanced by pressure because of the incorporation of a growing number of molecules into the clusters of water molecules that surround the CO molecules.21–23 The reaction becomes rapid, and high conversion is observed. In our study, the small amounts of CO generated by the direct gasification of phenol and the high conversion for the water-gas shift reaction at 750–1000 bar permit attaining the equilibrium after only a few minutes. At 750 bar, the CO concentration becomes stable around 6%, whereas it diminishes to 3% at 1000 bar. This result confirms the displacement of the equilibrium toward the formation of CO2 and H2 as SCW is compressed.
The evolution of the number of the moles of each gas generated during the reaction at some of the pressures investigated, Fig. 10, supports that the water-gas shift reaction occurs.
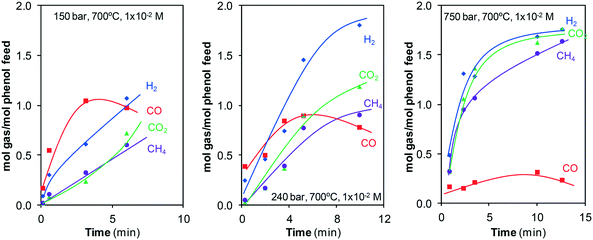 | ||
| Fig. 10 Moles of H2, CO, CO2, and CH4 generated during the gasification of phenol at different pressures. | ||
Noticeable amounts of CO are generated at the start of gasification, above all at 150 and 240 bar. However, there must be individual reactions that consume CO because a maximum appears after which the number of moles of CO decreases. Meanwhile, the number of moles of CO2 and H2 continuously increases. That is, a fraction of the CO first generated is later consumed in one (or a few) secondary reactions. Then, all of the evidence (evolution of the concentration and moles of CO, CO2, and H2 generated) is related to the water-gas shift reaction.
As can also be observed in Fig. 8, the CH4 concentration slightly increases with the reaction time. This increase may be related to the methanation equilibrium, eqn (5):
| CO + 3H2 ↔ CH4 + H2O | (5) |
The conversion achieved by this reaction increases with pressure, but it is not probable that CH4 is generated through this pathway inside a system with an excess of water. An estimative mass balance reveals that this reaction does not occur in this system, at least in an appreciable manner (see the ESI†); in the case that CH4 is generated from CO, high amounts of H2 would be consumed, which in turn would lead to the decrease in the H2 concentration with time.
As previously discussed, phenol is polymerized, and naphthalene and phenanthrene, which play a key role in gas production, are generated with the progress of the reaction. Studies related to the gasification of such compounds are scarce. Vostrikov et al.24 have reported that a mixture of gases with concentrations of approximately 34% H2, 13% CO, 13% CO2, and 40% CH4 is generated from the gasification of naphthalene at 300 bar and 710 °C for 10 min. Park and Tomiyasu25 have reported the RuO2-catalyzed gasification of naphthalene for 120 min at 450 °C and 400 bar and obtained 48.8% CH4, 42.7% CO2, and 8.5% H2. Other studies been reported the gasification of aromatic polycyclic hydrocarbons with large molecular weights, e.g., asphaltene26,27 and anthracene.28 All of these studies also conclude that CH4 is the main product from gasification. In summary, the gasification of phenanthrene and naphthalene generates high amounts of CH4, which may explain the observed slight increase in CH4 concentration.
Regarding H2, it is a product generated not only by the gasification of phenol and polymers but also by the water-gas shift reaction. As a result, increasing amounts of H2 are generated throughout the whole reaction (Fig. 10).
Finally, it is useful to characterize the gaseous stream not only for completing mechanistic analysis but also for assessing the method from a practical viewpoint. For example, it is concluded that 48% of phenol present in 10−2 M solution is converted into gas (38% H2 and 19% CH4) when it is gasified with SCW at 700 °C and 240 bar for 10 min. The over-compression until the pressure limit reached in this study exhibits some clear drawbacks. The experimental devices must be able to support such high pressures, and the safety measures must be more stringent. However, it implies important advantages for the process. In comparison to steam, the size of the gasification reactors with SCW is considerably reduced because of the rapid gasification kinetics and long residence times achieved because of its higher density. The CO amount is nearly zero and it will not be necessary to add another reactor to reform CO and maximize H2 production as reforming occurs in the same gasification reactor.
In conclusion, under the optimal conditions in this study (700 °C, 750 bar, 16.5 min) 68% of phenol is converted into gas without the release of any by-products that pollute the liquid or gaseous effluents, except CO2. Furthermore, 2.14 moles and 1.60 moles of green fuels H2 and CH4, respectively, are produced per mole of the treated phenol. This result highlights that it is not only an efficient destruction method but also an interesting alternative from both energetic and environmental viewpoints.
3.4. Considerations about the degradation–gasification mechanism
In other studies for the gasification of phenol with SCW, naphthalene and phenanthrene are obtained in low concentrations and they are not considered to play an important role in the mechanism.10,11 However, naphthalene is the main product detected in the liquid residue from the gasification of benzene.10 Benzene is converted into phenyl radicals, which dimerize to produce naphthalene.29 On the other hand, benzene has been identified as one of the main by-products from the SCW–phenol reaction. Two pathways have been described to explain the formation of benzene from phenol; (i) the displacement of the hydroxyl group by an H atom liberated in the formation of other free radicals11 and (ii) the hydrogenation by the H2 generated in other reactions.7Considering the inferences made in those studies, the polymers detected herein possibly originate from the polymerization of benzene, which may be generated from phenol. However, the GC-MS analysis of the liquid effluent did not reveal the presence of benzene. On the other hand, the mass spectra of the gaseous stream produced (Fig. 3) show a peak (low and negligible signal relative to those of H2, CO, CO2, and CH4) at m/z = 78, possibly related to benzene. This species is probably present in the gaseous stream because of the sharp expansion of the effluent when it leaves the reactor, at the pressure-regulating valve. In this manner, this species whose normal boiling point is relatively low (normal boiling point of benzene: 80 °C) may pass into the gaseous stream. Despite this fact, the amounts of this generated product will be less than those of H2, CO, CO2, and CH4, so that this phenomenon does not have any repercussion on the calculation of CGE.
On the other hand, the main conclusion of this study is not the proposed mechanism (which is quite similar to that proposed by other authors and fits the general pattern previously stated), but the analysis of the important effects of pressure on the rate and the conversion achieved by each one of those pathways and the manner in which this effect influences the destruction of the pollutant and the characteristics of the gas obtained.
4. Conclusions
At 700 °C, steam and SCW can rapidly degrade phenol, but the percentage of phenol converted into gas increases with the progressive compression of the gasification fluid. This process is considerably affected by the formation of intermediate polymeric products, which are difficult to gasify. Compressed steam cannot degrade these polymers and the CGEs obtained under these conditions are lower than those using SCW. The use of the supercritical fluid does not prevent the formation of those polymeric compounds, but aids in the degradation and final gasification once they have been formed. Then, the destruction and upgrading of the pollutant is more efficient with the use of SCW. A degradation–gasification mechanism is proposed whose general pattern is in agreement with those proposed previously. Phenol can be gasified or can produce those polymers, which are also precursors to the gas and carbonized solid residue. Nevertheless, the highlight of this study is that phenol can be converted into valuable green fuels using SCW at high pressures. At 750 bar, 68% of phenol is converted into gas after 16.5 min of treatment with the release of no pollutant by-products, except CO2. Under these conditions, 2.14 moles of H2 and 1.60 moles of CH4 are generated per mole of phenol treated. Furthermore, CO is barely produced and its separation and reforming in an additional reactor to maximize H2 production is not required.Conflicts of interest
There are no conflicts of interest to declare.Acknowledgements
Financial support from the Ministerio de Economía y Competitividad (Project CTQ2015-64339-R) and Anticipos Fondos Feder is acknowledged.References
- G. Busca, S. Berardinelli, C. Resini and L. Arrighi, J. Hazard. Mater., 2008, 160, 265–288 CrossRef CAS PubMed.
- J. Yu, Q. Guan, Q. Chen, P. Ning, J. Gu, X. Huang, Y. Shi and R. Miao, RSC Adv., 2016, 6, 75512–75521 RSC.
- A. Kruse, Biofuels, Bioprod. Biorefin., 2008, 2, 415–437 CrossRef CAS.
- Q. Guan, X. Huang, J. Liu and J. Gu, et al. , Chem. Eng. J., 2016, 283, 358–365 CrossRef CAS.
- G. J. DiLeo, M. E. Neff and P. E. Savage, Energy Fuels, 2007, 21, 2340–2345 CrossRef CAS.
- D. S. Gökkaya, M. Saglam, M. Yüksel and L. Ballice, Int. J. Hydrogen Energy, 2015, 40, 11133–11139 CrossRef.
- A. K. Goodwin and G. L. Rorrer, Energy Fuels, 2009, 23, 3818–3825 CrossRef CAS.
- G. J. DiLeo, M. E. Neff, S. Kim and P. E. Savage, Energy Fuels, 2008, 22, 871–877 CrossRef CAS.
- C. M. Huelsman and P. E. Savage, J. Supercrit. Fluids, 2013, 81, 200–209 CrossRef CAS.
- T. L. K. Yong and Y. Matsumura, J. Jpn. Pet. Inst., 2013, 56, 331–343 CrossRef CAS.
- C. M. Huelsman and P. E. Savage, Phys. Chem. Chem. Phys., 2012, 14, 2900–2910 RSC.
- T. L. K. Yong and Y. Matsumura, J. Supercrit. Fluids, 2014, 87, 73–82 CrossRef CAS.
- Y. Guo, S. Wang, Y. Wang and J. Zhang, et al. , Int. J. Hydrogen Energy, 2012, 37, 2278–2286 CrossRef CAS.
- M. Uematsu and E. Frank, J. Phys. Chem. Ref. Data, 1980, 9, 1291–1306 CrossRef CAS.
- N. Akiya and P. E. Savage, Chem. Rev., 2002, 102, 2725–2750 CrossRef CAS PubMed.
- N. Akiya and P. E. Savage, J. Phys. Chem. A, 2000, 104, 4441–4448 CrossRef CAS.
- T. L. K. Yong and Y. Matsumura, Ind. Eng. Chem. Res., 2013, 52, 9048–9059 CrossRef CAS.
- T. L. K. Yong and Y. Matsumura, Ind. Eng. Chem. Res., 2012, 51, 11975–11988 CrossRef CAS.
- H. Pinkowska, P. Wolak and A. Zlocinska, Chem. Eng. J., 2012, 187, 410–414 CrossRef CAS.
- H. Jin, Y. Wu, L. Guo and X. Su, Int. J. Hydrogen Energy, 2016, 41, 3837–3843 CrossRef CAS.
- C. F. Melius and N. E. Bergan, Twenty-Third Symposium (International) on Combustion/The Combustion Institute, 1990, pp. 217–223 Search PubMed.
- S. F. Rice, R. R. Steeper and J. D. Aiken, J. Phys. Chem. A, 1998, 102, 2673–2678 CrossRef CAS.
- J. D. Taylor, C. M. Herdman, B. C. Wu, K. Wally and S. F. Rice, Int. J. Hydrogen Energy, 2003, 28, 1171–1178 CrossRef CAS.
- A. A. Vostrikov, D. Y. Dubov and S. A. Psarov, Russ. Chem. Bull., 2001, 50, 1481–1484 CrossRef CAS.
- K. C. Park and H. Tomiyasu, Chem. Commun., 2003, 694–695 RSC.
- L. Han, R. Zhang and J. Bi, Fuel Process. Technol., 2009, 90, 292–300 CrossRef CAS.
- L. Han, R. Zhang, J. Bi and L. Cheng, J. Anal. Appl. Pyrolysis, 2011, 91, 281–297 CrossRef CAS.
- H. Jin, S. Liu, W. Wei and D. Zhang, et al. , Energy Fuels, 2015, 29, 6342–6346 CrossRef CAS.
- S. J. Chang and Y. C. Liu, J. Environ. Sci., 2007, 19, 1430–1435 CrossRef CAS.
Footnote |
| † Electronic supplementary information (ESI) available. See DOI: 10.1039/c7re00081b |
| This journal is © The Royal Society of Chemistry 2017 |

