 Open Access Article
Ultrafast transient IR spectroscopy and DFT calculations of ruthenium(II) polypyridyl complexes†
Qinchao
Sun
,
Bogdan
Dereka
,
Eric
Vauthey
,
Latévi M.
Lawson Daku
and
Andreas
Hauser
*
Département de Chimie Physique, Université de Genève, 30 Quai Ernest-Ansermet, 1211 Genève, Switzerland. E-mail: andreas.hauser@unige.ch
First published on 11th August 2016
Abstract
Ultrafast time-resolved infrared spectroscopy of [Ru(bpy)3]2+ (bpy = 2,2′-bipyridine), [Ru(mbpy)3]2+ (mbpy = 6-methyl-2,2′-bipyridine) and [Ru(mphen)3]2+ (mphen = 2-methyl-1,10′-phenanthroline) in deuterated acetonitrile serves to elucidate the evolution of the system following pulsed excitation into the 1MLCT band at 400 nm. While for [Ru(bpy)3]2+ no intermediate state can be evidenced for the relaxation of the corresponding 3MLCT state back to the ground state, for [Ru(mbpy)3]2+ and [Ru(mphen)3]2+ an intermediate state with a lifetime of about 400 ps is observed. The species associated IR difference spectra of this state are in good agreement with the calculated difference spectra of the lowest energy 3dd state using DFT. The calculated potential energy curves for all the complexes in the triplet manifold along the metal–ligand distance show that for [Ru(bpy)3]2+ the 3dd state is at a higher energy than the 3MLCT state and that there is a substantial barrier between the two minima. For [Ru(mbpy)3]2+ and [Ru(mphen)3]2+, the 3dd state is at a lower energy than the 3MLCT state.
Introduction
The role of ligand field or dd states in the photophysical and photochemical properties of ruthenium(II)-polypyridyl complexes is a recurring topic1–12 and has become of renewed interest due to the advent of ultrafast spectroscopic techniques.13,14 Thus, the lowest energy 3dd state is generally held responsible for the quenching of the triplet metal–ligand charge transfer (3MLCT) luminescence of [Ru(bpy)3]2+ (bpy = 2,2′-bipyridine) via thermal population at higher temperatures.11 For ligands with lower ligand-field strengths, this state falls below the 3MLCT and quenches luminescence efficiently at all temperatures.14–16 However, it turns out to be very difficult to actually capture its spectroscopic signature.16–18 For [Ru(bpy)3]2+, for which it is higher in energy than the 3MLCT state, and for which at room temperature there is a fast equilibrium between the two states, the population of the 3dd state is always too low for it to be picked up spectroscopically.13,14 Likewise, for complexes for which it lies well below the 3MLCT state, its population as a transient state remains very low because in this case its lifetime is usually substantially shorter than the feeding time from the 3MLCT state.16 Only recently, trapping of the 3dd state as an intermediate state of ruthenium(II) polypyridyl complexes has been achieved by introducing methyl groups into the ortho positions of bipyridine and phenanthroline.13,14 Such a substitution reduces the ligand-field strength comparatively little so that the 3dd state falls to only just below the 3MLCT state. As a consequence, the internal conversion from the 3MLCT state to the 3dd state is in the Marcus normal region, whereas the intersystem crossing process back to the ground state is in the Marcus inverted region and obeys the energy gap law.14 From UV-Vis transient absorption (TA) spectra, the lifetimes of the 3MLCT states of the non-luminescent [Ru(mbpy)3]2+ (mbpy = 6-methyl-2,2′-bipyridine) and [Ru(mphen)3]2+ (mphen = 2-methyl-1,10′-phenanthroline) complexes at room temperature in acetonitrile have been determined to be about 1.6 and 4 ps, respectively, from the rapid decay of the excited state absorption (ESA) band below 400 nm attributed to the mbpy− and mphen− moieties of the 3MLCT state.13,14 Along with the decay of the 3MLCT state, an intermediate state was detected for both complexes with lifetimes of around 450 ps based on ground state recovery. This intermediate state was assigned to the lowest energy 3dd state.Time-resolved infrared spectroscopy (TRIR) has been used as a tool to characterise electronically excited states for some time, for instance in ruthenium(II),19,20 osmium(II)21 and rhenium(I)21,22 complexes, and it has also helped to tentatively assign a transient dd state in a tungsten(0)23 complex. But only recently have ultrafast TRIR methods become available, which in addition allow the evolution of the nuclear structure toward metastable states21,24 and in photochemical transformations25 upon absorption of a photon to be followed in real time. Herein we present ultrafast TRIR spectra in the region of the ring stretching and C–H bending modes from 1350 to 1650 cm−1.19,20,24 This allows us to further characterize the intermediate state, given that the IR spectrum in this region is very sensitive to the charge distribution and transient geometry of the intermediate species. The experimental results are furthermore compared to density functional theory based calculations.
Results and discussion
Time resolved infrared spectroscopy
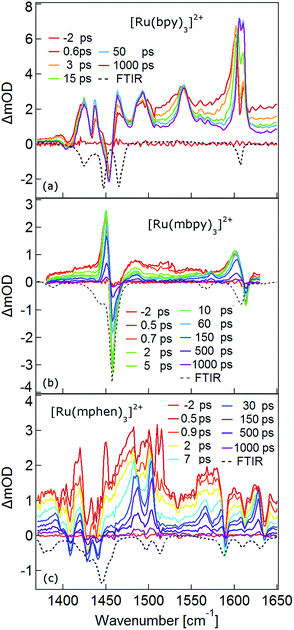
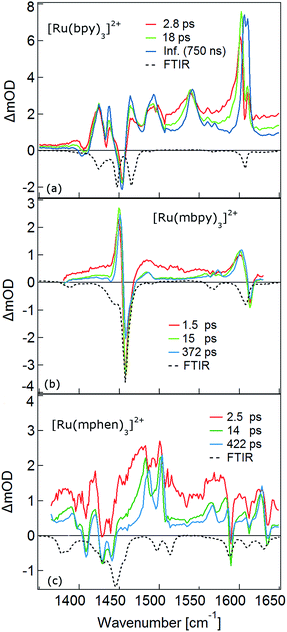
The TRIR spectra between 1350 and 1650 cm−1 for [Ru(bpy)3]2+, [Ru(mbpy)3]2+ and [Ru(mphen)3]2+ in deuterated acetonitrile following pulsed excitation at 400 nm, that is, into the intense 1MLCT band, and with an instrumental response function (IRF) of 300 fs are shown in Fig. 1.The temporal evolution of the TRIR spectrum of [Ru(bpy)3]2+ shown in Fig. 1a over the first 1000 ps agrees well with the published results for this complex.19,21,24 It can be described as the sum of two exponentials with time constants of τ1 = 2.8 ps and τ2 = 18 ps, respectively, and a final spectrum which would decay with a luminescence lifetime of the 3MLCT state of 750 ns. Global fitting and target analysis with an A −τ1 → B −τ2 → C decay scheme results in the species associated difference IR spectra (SADS) shown in Fig. 2a, which are proportional to the difference in excited and ground IR extinction coefficients ε* and ε0, respectively.
The long-lived species C in [Ru(bpy)3]2+ can be assigned to the thermally relaxed 3MLCT state.19,26–29 The SADS of species A and B are not very much different from the one of C. Overall the excited state absorption is stronger than the ground state absorption. All three show a complex structure in the region of the ground state absorption around 1450 cm−1, with derivative type components due to ground state bleaching and only small frequency shifts in the excited state. They also show two totally new bands at 1495 and 1545 cm−1, and a more complex evolution of a band structure at 1600 cm−1. As has been shown by TA spectroscopy, intersystem crossing from 1MLCT to 3MLCT occurs within the first 130 fs![[thin space (1/6-em)]](https://www.rsc.org/images/entities/char_2009.gif) 30–34 following excitation and is not resolved in the TRIR spectra with the IRF of 300 fs. Species A and B therefore reflect the evolution of the IR spectrum during intramolecular vibrational relaxation,35–38 charge localisation on one of the ligands19,20,39,40 and vibrational cooling.26–28 The band structure around 1450 cm−1 shows hardly any evolution and can be attributed to the only slightly shifted vibrational frequencies of the two formally neutral ligands in the 3MLCT state. Of particular interest is the new band at 1545 cm−1. This band starts off as quite a large band on a broad background and sharpens up rapidly within τ1. It exemplifies that within the third ligand, the C–C frequencies have changed quite dramatically because of the extra electron in the π* orbital and also that the excess energy resides on this ligand. The evolution of the band structure at 1600 cm−1, as mentioned above, is more complex. In principle it also starts off as a comparatively broad band and then sharpens up. In addition, it looks split due to the dip caused by ground state bleaching but does not show derivative type structure because the excited state absorption is stronger and broader than the ground state absorption.24
30–34 following excitation and is not resolved in the TRIR spectra with the IRF of 300 fs. Species A and B therefore reflect the evolution of the IR spectrum during intramolecular vibrational relaxation,35–38 charge localisation on one of the ligands19,20,39,40 and vibrational cooling.26–28 The band structure around 1450 cm−1 shows hardly any evolution and can be attributed to the only slightly shifted vibrational frequencies of the two formally neutral ligands in the 3MLCT state. Of particular interest is the new band at 1545 cm−1. This band starts off as quite a large band on a broad background and sharpens up rapidly within τ1. It exemplifies that within the third ligand, the C–C frequencies have changed quite dramatically because of the extra electron in the π* orbital and also that the excess energy resides on this ligand. The evolution of the band structure at 1600 cm−1, as mentioned above, is more complex. In principle it also starts off as a comparatively broad band and then sharpens up. In addition, it looks split due to the dip caused by ground state bleaching but does not show derivative type structure because the excited state absorption is stronger and broader than the ground state absorption.24
In the TRIR spectra of [Ru(mbpy)3]2+ shown in Fig. 1b two derivative type signals are observed at around the ground state absorption bands at 1450 cm−1 and 1600 cm−1. Global fitting and target analysis with an A −τ1 → B −τ2 → C −τ3 → GS decay scheme results in values of τ1 = 1.5 ps, τ2 = 15 ps and τ3 = 372 ps and the corresponding SADS are shown in Fig. 2b. The long lifetime of 380 ps of species C is consistent with that of 450 ps of the intermediate state determined previously via UV-Vis TA spectroscopy.13 The spectra of species B and C are very similar, thus the process with τ2 showing only a slight sharpening of the signals corresponds to vibrational cooling in the intermediate state. At very short times an additional broad and almost structureless signal between 1470 and 1540 cm−1 appears, which decays with τ1. This is in line with the time constant of 3MLCT decay monitored via the characteristic UV band of the mbpy− radical at 380 nm.13 It should be noted that this very short-lived and broad band is the only new band observed for [Ru(mbpy)3]2+. At longer times only derivative type signals are observed, indicating that the electron distribution on all ligands is not very different from that of the ground state, in line with the attribution of the intermediate state to the lowest energy 3dd state.
The TRIR spectra of [Ru(mphen)3]2+ are depicted in Fig. 1c. In view of the fact that there are more IR active vibrational modes for [Ru(mphen)3]2+ in the region of the polypyridine-localised vibrations than for the other two complexes, it is difficult to separate new bands from derivative type signals just by visual inspection. Global fitting and target analysis with the same three sequential processes as used for [Ru(mbpy)3]2+ gives a satisfactory description of the experimental results. The corresponding time constants are τ1 = 2.5 ps, τ2 = 14 ps and τ3 = 422 ps. The respective SADS are shown in Fig. 2c. The lifetimes of the short-lived species τ1 = 2.5 ps and of the long-lived species τ3 = 422 ps observed in the TRIR spectra are consistent with those of the UV-Vis TA measurements.14 The SADS of species A and C can therefore be reasonably assigned to the IR response of the 3MLCT state and the intermediate state, respectively, the SADS of species B being only a little broader and with tails to the low energy side but otherwise quite similar to that of species C corresponds to a hot intermediate state. τ2 then corresponds to vibrational cooling in the intermediate state.
In conclusion, the TRIR spectra of the three complexes in solution confirm the existence of an intermediate state in the deactivation process of the 3MLCT state in [Ru(mbpy)3]2+ and [Ru(mphen)3]2+ as previously inferred from UV-Vis TA experiments. The necessity of having to use three rather than two time constants stems from the fact that the TRIR spectra are more sensitive to vibrational cooling than UV-Vis TA spectra. While the UV-Vis TA spectra clearly demonstrate the disappearance of the 3MLCT population within a few picoseconds for both complexes, they did not show any clear-cut spectroscopic signature of the nature of the intermediate state. TRIR spectra are more suited to actually monitor geometric changes in the relaxation cascade. As mentioned above, derivative type signals indicate that the chemical bonding in the excited state with regard to the vibrating moiety is not very different from that in the ground state, whereas new and strong excited state absorption signifies that there is substantial electronic rearrangement in the excited state. Thus qualitatively for [Ru(bpy)3]2+ in the 3MLCT state, derivative type signals have been assigned to the ring stretch and C–H bending modes of the two formally neutral ligands and the new excited state absorption bands to the bpy− radical.19,24 For [Ru(mbpy)3]2+ only derivative type signals are observed in the intermediate state. This would be expected for the 3dd state, for which the rearrangement of the d-electrons does not greatly influence the ligand centred vibrations. The following DFT based calculations will serve to substantiate this qualitative discussion of the experimental results.
DFT calculations
DFT calculations are becoming increasingly important for elucidating the photophysical properties of ruthenium(II) complexes.1,41,42 In a first step the ground state structures of all three complexes of the present study in the gas phase were optimised by DFT calculations (for details see the Experimental section and ESI†). Table 1 gives the key structural and energetic parameters for all three from computational work and X-ray structure determination. The agreement between the two is very good. Subsequently the vibrational frequencies and the corresponding IR intensities were computed. Fig. 3 shows the computed IR spectra in the region between 1000 and 1650 cm−1 with the main contributions from ligand ring breathing (C![[double bond, length as m-dash]](https://www.rsc.org/images/entities/char_e001.gif) C and C
C and C![[double bond, length as m-dash]](https://www.rsc.org/images/entities/char_e001.gif) N) and C–H bending modes for all three complexes together with the experimental spectra recorded in KBr pellets. The computed spectra were scaled with a scaling factor of 0.96. Vibrational mode analysis shows that the band structure at 1450 cm−1 corresponds mainly to C–H bending modes, while the 1600 cm−1 is a combination of both ring breathing and C–H bending modes (for details see Fig. S1 to S7 in the ESI†). The calculated ground state IR spectra for the two low-symmetry complexes [Ru(mbpy)3]2+ and [Ru(mphen)3]2+ show very good agreement with the experimental spectra. The agreement is somewhat less good but still fair for [Ru(bpy)3]2+.
N) and C–H bending modes for all three complexes together with the experimental spectra recorded in KBr pellets. The computed spectra were scaled with a scaling factor of 0.96. Vibrational mode analysis shows that the band structure at 1450 cm−1 corresponds mainly to C–H bending modes, while the 1600 cm−1 is a combination of both ring breathing and C–H bending modes (for details see Fig. S1 to S7 in the ESI†). The calculated ground state IR spectra for the two low-symmetry complexes [Ru(mbpy)3]2+ and [Ru(mphen)3]2+ show very good agreement with the experimental spectra. The agreement is somewhat less good but still fair for [Ru(bpy)3]2+.
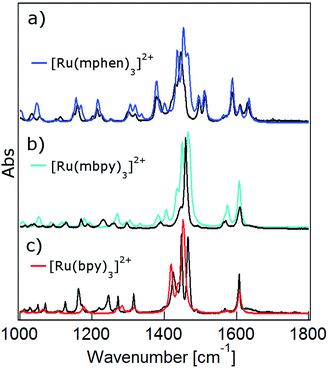 | ||
| Fig. 3 Calculated ground state IR spectra in the gas phase (colour) and FTIR spectra in KBr pellets (black) of (a) [Ru(bpy)3]2+, (b) [Ru(mbpy)3]2+ and (c) [Ru(mphen)3]2+. | ||
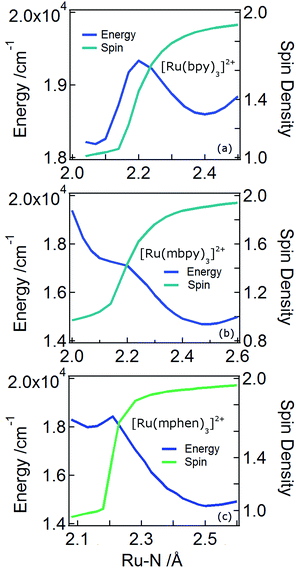
In order to understand the experimentally observed SADS, DFT calculations on the triplet excited states of [Ru(bpy)3]2+, [Ru(mbpy)3]2+ and [Ru(mphen)3]2+ were performed using the Polarizable Continuum Model (PCM)45 to take into account solvent effects. For [Ru(bpy)3]2+, the calculations easily converge to the 3MLCT state as the lowest excited state when starting from the ground state geometry as the starting geometry, in line with the observation of 3MLCT luminescence. It was also possible to locate the 3dd state as a local minimum at a slightly higher energy by starting from a different starting geometry (see Table 1). For the 3MLCT state the excited electron is localized on one of the three ligands according to the results of the spin density analysis shown in Fig. 4a. For this state, the Ru–N bond lengths are not very different from those of the ground state. For the 3dd state, the coordination octahedron is strongly distorted due the Jahn–Teller effect. Indeed two axial bond lengths change significantly from ∼2.07 Å to ∼2.45 Å on going from the 3MLCT to the 3dd state, the remaining Ru–N bond lengths change slightly from 2.07 Å to 2.12 Å (for details see Table S1 in the ESI†). The reaction pathway between the two triplet states can be traced by linearly expanding the Ru–N bonds from the 3MLCT to the 3dd state, while optimising all other structural parameters. The corresponding cut through the potential energy surface (PES) is shown in Fig. 5a together with the spin density on ruthenium. The latter unequivocally identifies the 3dd state with its two unpaired electrons on the ruthenium ion in the direction of the Jahn–Teller axis, as also shown in Fig. 4a.
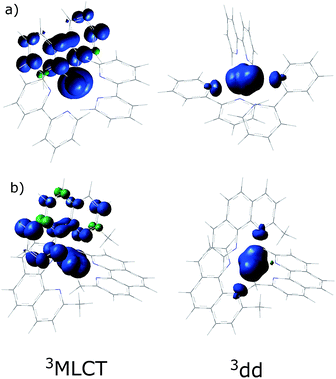 | ||
| Fig. 4 The spin density distribution in the 3MLCT and the 3dd states of (a) [Ru(bpy)3]2+ and (b) [Ru(mphen)3]2+ with the PCM model for acetonitrile. | ||
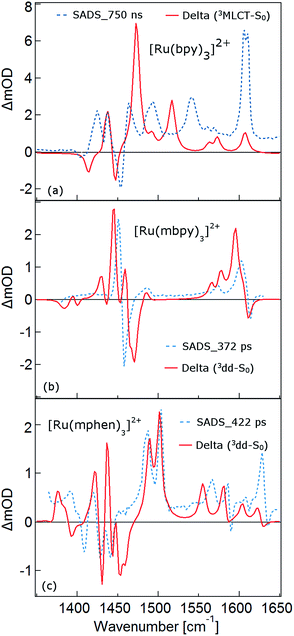
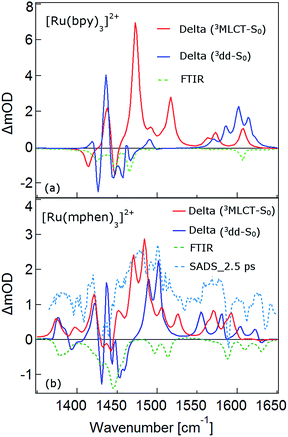
As mentioned above, the two minima are true minima and the corresponding vibrational analysis results in the calculated difference spectra for the 3MLCT state shown in Fig. 6a together with the experimental SADS of the long-lived species. Fig. 7a, in turn, shows the direct comparison of the calculated SADS of the 3MLCT and the 3dd state for [Ru(bpy)3]2+. The difference between the calculated difference spectra for the 3MLCT and the 3dd state is obvious. For the 3dd state only derivative type signals or weak excited state absorption around the ground state absorption would be expected. For the 3MLCT state with its electron localised on one ligand, new and quite intense bands corresponding to polypyridine-localised vibrations involving this ligand are expected. Even though the actual agreement between the calculated frequencies and the experimental excited-state absorption bands that have no counterpart in the ground-state spectrum is not perfect, the number of new bands, which according to normal mode analysis correspond to vibrations localised on the negatively charged ligand, is in line with the experimental TRIR spectrum. The quantitative disagreement might be caused by the fact that the PCM model cannot perfectly mimic real solvent effects, in particular with regard to the modes most affected in the charge transfer state. In any case, for [Ru(bpy)3]2+, there is no indication of any sizable population of the 3dd state during the relaxation processes.
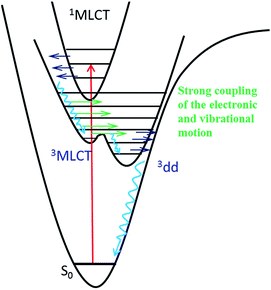
Also for [Ru(mphen)3]2+ it was possible to locate both states, but in this case the 3dd state is lower in energy than the 3MLCT state. Likewise for [Ru(mbpy)3]2+, the 3dd state is below the 3MLCT state. However, with the computational method chosen for the present study, irrespective of starting geometry, the calculations always converged to the 3dd state. Already the ground state symmetry of the two methyl-substituted meridional complexes is C1. According to the spin density distribution for [Ru(mphen)3]2+ shown in Fig. 4b, in the 3MLCT states, the electron is located on the sterically less hindered mphen ligand, and in the 3dd state the axial distortion involves the two trans methyl-substituted moieties that have strongly elongated bonds (see Tables S2 and S3 in the ESI† for details). Following the procedure as outlined for [Ru(bpy)3]2+, the cut through the PES included in Fig. 5b and c can be calculated. Since with Gaussian09 it was not possible to converge [Ru(mbpy)3]2+ to the 3MLCT state, the ground state geometry with regard to the ruthenium–nitrogen bonds is used to approximate the 3MLCT geometry in the calculation of the PES along the reaction pathway. For both methyl-substituted ligands the 3dd state, characterised by a spin density corresponding close to two electrons on the ruthenium ion, is lower in energy. As explained above, for [Ru(mbpy)3]2+ there is no local minimum for the 3MLCT state, and even for [Ru(mphen)3]2+ the minimum is actually very shallow, leading to an early transition state in which the two states are strongly coupled vibronically. This also explains the fast non-radiative transition within ∼1.5 and ∼3 ps for [Ru(mbpy)3]2+ and [Ru(mphen)3]2+, respectively, from the 3MLCT to the 3dd state observed in the TA and TRIR experiments.
For the complexes of both methylated ligands, [Ru(mbpy)3]2+ and [Ru(mphen)3]2+, vibrational analysis in the 3dd state results in the calculated difference spectra displayed in Fig. 6b and c. These can be directly compared to the experimental SADS for the long-lived components included in the figures. The agreement between the calculated and the experimental difference spectra is very good indeed. In particular the fact that all transient bands correspond to comparatively small shifts with respect to the ground state vibrations, possibly some small splittings and a slight overall enhancement of the intensities in the transient state provide further proof that the intermediate state corresponds to the postulated 3dd state, in which the polypyridine-localised vibrations of the ligands are only slightly affected.
What about the TRIR spectra at early times? For [Ru(bpy)3]2+ the SADS of the short-lived species (τ1 = 2.8 ps) is not much different from the SADS of the long-lived species and the somewhat longer lived component (τ2 = 18 ps). Thus all three SADS essentially refer to the 3MLCT state, with the first one representing a hot 3MLCT state and the two time constants approximate the not necessarily exponential vibrational relaxation and charge localisation on one ligand. Since for [Ru(mphen)3]2+ it was possible to optimise also the 3MLCT state, the experimental SADS of the short-lived species should be compared to the one calculated for the 3MLCT state. This is done in Fig. 7b. Direct comparison with the calculated difference spectrum of the 3dd state shows significant differences. Again, frequency shifts, excited state absorption and the number of expected bands is higher for the 3MLCT state. The calculated 3MLCT difference spectrum agrees very well with the SADS of the short-lived species, the experimental spectrum being only somewhat broader due to the system not being fully relaxed.
Conclusions
The intermediate state of [Ru(mbpy)3]2+ and [Ru(mphen)3]2+ induced by photoexcitation was experimentally characterized by the corresponding SADS using ultrafast TRIR spectroscopy. The good agreement between the SADS and the DFT calculated IR difference spectrum of the 3dd state provides solid evidence that it is this state that is successfully trapped with a lifetime about 400 ps. The PES shows no barrier for the conversion from the 3MLCT state to the 3dd state for [Ru(mbpy)3]2+ and only a shallow barrier for that of [Ru(mphen)3]2+. This indicates strong vibronic coupling between the 3MLCT and 3dd states close to the 3MLCT equilibrium geometry, resulting in an ultrafast transition from the 3MLCT state to the 3dd state for both complexes. The TRIR experiments presented here together with the previously presented UV-Vis TA experiments give unique and detailed insight into the sequence of events from the initial excitation to the population of the intermediate 3dd state. Fig. 8 summarises these findings. As pointed out in ref. 14, the range of relative energies of the 3MLCT and the 3dd states, for which a sizeable population of the latter with comparatively long lifetime can be observed, is quite small. Depending upon the envisioned application, either as photosensitiser in dye-sensitised solar cells46 or in cancer phototherapy,5–8 the efficient population and long lifetime of the 3dd state is either detrimental or beneficial.The results of ultrafast TRIR spectroscopy presented above prove this method to be a valuable tool for the photophysical and photochemical investigation of transition metal complexes. Although at the present stage it is restricted to vibrational frequencies above 900 cm−1 it is generally applicable to differentiating between states of different nature, be it via a spectator ligand such as CO21,22,25 or via a ligand directly involved in the process as in the present case for the MLCT states. The method will become even more powerful once the accessible range is extended to the far IR either via TRIR itself or via time-resolved Raman spectroscopy,47 in order to study metal–ligand vibrations directly.
Experimental and computational details
Time-resolved infrared (TRIR) spectroscopy
TRIR spectra were recorded by pumping in the UV and probing in mid-IR. The details of the experimental setup have already been reported elsewhere. In general, a pump beam at 400 nm was generated by frequency doubling the output of a Ti:sapphire amplifier (pulse duration 100 fs, repetition rate 1 kHz). The mid-IR probe beam was provided by optical parameter amplification and difference frequency generation of the signal and idler beams. The pump pulse energy was typically in the order of μJ mm−2. A flow cell with an optical path length of 50 μm was used. The concentration of the respective ruthenium(II) complexes was adjusted such that the optical density at the pump wavelength was 0.2. The instrumental response function is estimated to be around 300 fs.The temporal evolution of the transient IR spectra was first fitted to a sum of a minimum number of exponentials, with corresponding wavelength dependant amplitudes. Based on an A −τ1 → B −τ2 → C kinetic model, the decay-associated amplitudes were transformed to species associated difference spectra, SADS (for details see the ESI†).
Computational details
DFT calculations were performed with the Gaussian 09 program package48 using the mPW1PW91 functional,49 the D95V basis set for H, C and N atoms50 and the LANL2DZ basis set for ruthenium.51 [Ru(bpy)3]2+, [Ru(mbpy)3]2+ and [Ru(mphen)3]2+ were characterised in the singlet ground and in the lowest-energy excited triplet states. Frequency calculations performed on the optimized geometries show that all the converged states correspond to true minima (no imaginary frequencies). IR spectra were simulated by convoluting the calculated intensities with Lorentzian functions of FWHM of 10 cm−1 by GaussSum.52 Calculations were performed in the gas phase and with the PCM method in order to take solvent effects into account.Acknowledgements
The authors thank N. Amstutz for her help in sample preparation. This work was financially supported by the Swiss National Science Foundation (grant number 200020_137567).Notes and references
- L. Salassa, C. Garino, G. Salassa, R. Gobetto and C. Nervi, J. Am. Chem. Soc., 2008, 130, 9590–9597 CrossRef CAS PubMed.
- G. Shi, S. Monro, R. Hennigar, J. Colpitts, J. Fong, K. Kasimova, H. Yin, R. DeCoste, C. Spencer, L. Chamberlain, A. Mandel, L. Lilge and S. A. McFarland, Coord. Chem. Rev., 2015, 282, 127–138 CrossRef.
- O. A. Borg, S. S. Godinho, M. J. Lundqvist, S. Lunell and P. Persson, J. Phys. Chem. A, 2008, 112, 4470–4476 CrossRef CAS PubMed.
- J. D. Knoll, B. A. Albani and C. Turro, Acc. Chem. Res., 2015, 48, 2280–2287 CrossRef CAS PubMed.
- C. Mari, V. Pierroz, S. Ferrari and G. Gasser, Chem. Sci., 2015, 6, 2660–2686 RSC.
- E. Wachter, D. K. Heidary, B. S. Howerton, S. Parkin and E. C. Glazer, Chem. Commun., 2012, 48, 9649–9651 RSC.
- S. L. H. Higgins and K. J. Brewer, Angew. Chem., Int. Ed., 2012, 51, 11420–11422 CrossRef CAS PubMed.
- B. S. Howerton, D. K. Heidary and E. C. Glazer, J. Am. Chem. Soc., 2012, 134, 8324 CrossRef CAS PubMed.
- J. N. Demas and G. A. Crosby, J. Am. Chem. Soc., 1971, 93, 2841–2847 CrossRef.
- J. P. Sauvage, J. P. Collin, J. C. Chambron, S. Guillerez, C. Coudret, V. Balzani, F. Barigelletti, L. Decola and L. Flamigni, Chem. Rev., 1994, 94, 993 CrossRef CAS.
- J. V. Houten and R. J. Watts, J. Am. Chem. Soc., 1976, 98, 4853–4858 CrossRef.
- B. Durham, J. V. Caspar, J. K. Nagle and T. J. Meyer, J. Am. Chem. Soc., 1982, 104, 4803 CrossRef CAS.
- Q. Sun, S. Mosquera-Vazquez, L. M. L. Daku, L. Guenee, H. A. Goodwin, E. Vauthey and A. Hauser, J. Am. Chem. Soc., 2013, 135, 13660 CrossRef CAS PubMed.
- Q. Sun, S. Mosquera-Vazquez, Y. Suffren, J. Hankache, N. Amstutz, L. M. L. Daku, E. Vauthey and A. Hauser, Coord. Chem. Rev., 2015, 282, 87–99 CrossRef.
- J. R. Winkler, T. L. Netzel, C. Creutz and N. Sutin, J. Am. Chem. Soc., 1987, 109, 2381 CrossRef CAS.
- J. T. Hewitt, P. J. Vallett and N. H. Damrauer, J. Phys. Chem. A, 2012, 116, 11536 CrossRef CAS PubMed.
- D. W. Thompson, A. Ito and T. J. Meyer, Pure Appl. Chem., 2013, 85, 1257–1305 CrossRef CAS.
- S. Wallin, J. Davidsson, J. Modin and L. Hammarstrom, J. Phys. Chem. A, 2005, 109, 4697 CrossRef CAS PubMed.
- K. M. Omberg, J. R. Schoonover, J. A. Treadway, R. M. Leasure, R. B. Dyer and T. J. Meyer, J. Am. Chem. Soc., 1997, 119, 7013 CrossRef CAS.
- K. M. Omberg, J. R. Schoonover, S. Bernhard, J. A. Moss, J. A. Treadway, E. M. Kober, R. B. Dyer and T. J. Meyer, Inorg. Chem., 1998, 37, 3505 CrossRef CAS PubMed.
- J. M. Butler, M. W. George, J. R. Schoonover, D. M. Dattelbaum and T. J. Meyer, Coord. Chem. Rev., 2007, 251, 492–514 CrossRef CAS.
- S. Bernhard, K. M. Omberg, G. F. Strouse and J. R. Schoonover, Inorg. Chem., 2000, 39, 3107–3110 CrossRef CAS PubMed.
- F. P. A. Johnson, M. W. George, S. L. Morrison and J. J. Turner, J. Chem. Soc., Chem. Commun., 1995, 391–393 RSC.
- T. Mukuta, N. Fukazawa, K. Murata, A. Inagaki, M. Akita, S. I. Tanaka, S.-Y. Koshihara and K. Onda, Inorg. Chem., 2014, 53, 2481 CrossRef CAS PubMed.
- A. Gabrielsson, S. Záliš, P. Matousek, M. Towrie and A. Vlcek Jr., Inorg. Chem., 2004, 43, 7380–7388 CrossRef CAS PubMed.
- J. K. McCusker, Acc. Chem. Res., 2003, 36, 876–887 CrossRef CAS PubMed.
- M. M. N. Wolf, R. Gross, C. Schumann, J. A. Wolny, V. Schuenemann, A. Dossing, H. Paulsen, J. J. McGarvey and R. Diller, Phys. Chem. Chem. Phys., 2008, 10, 4264–4273 RSC.
- A.-M. Blanco-Rodriguez, H. Kvapilova, J. Sykora, M. Towrie, C. Nervi, G. Volpi, S. Zalis and A. Vlcek Jr., J. Am. Chem. Soc., 2014, 136, 5963–5973 CrossRef CAS PubMed.
- A. M. Brown, C. E. McCusker and J. K. McCusker, Dalton Trans., 2014, 43, 17635–17646 RSC.
- N. H. Damrauer, G. Cerullo, A. Yeh, T. R. Boussie, C. V. Shank and J. K. McCusker, Science, 1997, 275, 54 CrossRef CAS PubMed.
- A. Cannizzo, F. van Mourik, W. Gawelda, G. Zgrablic, C. Bressler and M. Chergui, Angew. Chem., Int. Ed., 2006, 45, 3174–3176 CrossRef CAS PubMed.
- P. Kukura, D. W. McCamant and R. A. Mathies, Annu. Rev. Phys. Chem., 2007, 58, 461–488 CrossRef CAS PubMed.
- A. C. Bhasikuttan, M. Suzuki, S. Nakashima and T. Okada, J. Am. Chem. Soc., 2002, 124, 8398–8405 CrossRef CAS PubMed.
- M. Chergui, Pure Appl. Chem., 2015, 87, 525–536 CrossRef CAS.
- G. J. Hedley, A. Ruseckas, Z. Liu, S.-C. Lo, P. L. Burn and I. D. W. Samuel, J. Am. Chem. Soc., 2008, 130, 11842–11843 CrossRef CAS PubMed.
- E. A. Juban and J. K. McCusker, J. Am. Chem. Soc., 2005, 127, 6857–6865 CrossRef CAS PubMed.
- E. Macoas, S. Mustalahti, P. Myllyperkio, H. Kunttu and M. Pettersson, J. Phys. Chem. A, 2015, 119, 2727–2734 CrossRef CAS PubMed.
- M. Delor, T. Keane, P. A. Scattergood, I. V. Sazanovich, G. M. Greetham, M. Towrie, A. J. H. M. Meijer and J. A. Weinstein, Nat. Chem., 2015, 7, 689–695 CrossRef CAS PubMed.
- C. E. McCusker and J. K. McCusker, Inorg. Chem., 2011, 50, 1656–1669 CrossRef CAS PubMed.
- P. J. Carroll and L. E. Brus, J. Am. Chem. Soc., 1987, 109, 7613–7616 CrossRef CAS.
- Y.-J. Tu, S. Mazumder, J. F. Endicott, C. Turro, J. J. Kodanko and H. B. Schlegel, Inorg. Chem., 2015, 54, 8003–8011 CrossRef CAS PubMed.
- M. R. Camilo, C. R. Cardoso, R. M. Carlos and A. B. P. Lever, Inorg. Chem., 2014, 53, 3694–3708 CrossRef CAS PubMed.
- D. P. Rillema, D. S. Jones, C. Woods and H. A. Levy, Inorg. Chem., 1992, 31, 2935–2938 CrossRef CAS.
- D. Onggo, M. L. Scudder, D. C. Craig and H. A. Goodwin, J. Mol. Struct., 2005, 738, 129–136 CrossRef CAS.
- J. Tomasi, B. Mennucci and R. Cammi, Chem. Rev., 2005, 105, 2999–3093 CrossRef CAS PubMed.
- M. Grätzel, Inorg. Chem., 2005, 44, 6841–6851 CrossRef PubMed.
- N. P. E. A. Weigel, J. Phys. Chem., 2010, 114, 7879–7893 CrossRef PubMed.
- M. J. Frisch, G. W. Trucks, H. B. Schlegel, G. E. Scuseria, M. A. Robb, J. R. Cheeseman, G. Scalmani, V. Barone, B. Mennucci, G. A. Petersson, H. Nakatsuji, M. Caricato, X. Li, H. P. Hratchian, A. F. Izmaylov, J. Bloino, G. Zheng, J. L. Sonnenberg, M. Hada, M. Ehara, K. Toyota, R. Fukuda, J. Hasegawa, M. Ishida, T. Nakajima, Y. Honda, O. Kitao, H. Nakai, T. Vreven, J. A. Montgomery, Jr., J. E. Peralta, F. Ogliaro, M. Bearpark, J. J. Heyd, E. Brothers, K. N. Kudin, V. N. Staroverov, R. Kobayashi, J. Normand, K. Raghavachari, A. Rendell, J. C. Burant, S. S. Iyengar, J. Tomasi, M. Cossi, N. Rega, J. M. Millam, M. Klene, J. E. Knox, J. B. Cross, V. Bakken, C. Adamo, J. Jaramillo, R. Gomperts, R. E. Stratmann, O. Yazyev, A. J. Austin, R. Cammi, C. Pomelli, J. W. Ochterski, R. L. Martin, K. Morokuma, V. G. Zakrzewski, G. A. Voth, P. Salvador, J. J. Dannenberg, S. Dapprich, A. D. Daniels, Ö. Farkas, J. V. J. B. Ortiz, J. Cioslowski, D. J. Fox and I. Gaussian, Gaussian 09 Revision C.01, Wallingford CT, 2009 Search PubMed.
- C. Adamo and V. Barone, J. Chem. Phys., 1998, 108, 664–675 CrossRef CAS.
- T. H. Dunning and P. J. Hay, Modern Theoretical Chemistry, ed. H. F. Schaefer III, Plenum, New York, 1976, vol. 3, p. 1 Search PubMed.
- P. J. Hay and W. R. Wadt, J. Chem. Phys., 1985, 82, 270–283 CrossRef CAS.
- N. M. O'Boyle, A. L. Tenderholt and K. M. Langmer, J. Comput. Chem., 2007, 29, 839–845 CrossRef PubMed.
Footnote |
| † Electronic supplementary information (ESI) available: Computational details and structural details. See DOI: 10.1039/c6sc01220e |
| This journal is © The Royal Society of Chemistry 2017 |

