 Open Access Article
Light-up probe based on AIEgens: dual signal turn-on for caspase cascade activation monitoring†
Youyong
Yuan
a,
Chong-Jing
Zhang
a,
Ryan T. K.
Kwok
b,
Duo
Mao
a,
Ben Zhong
Tang
b and
Bin
Liu
 *ac
*ac
aDepartment of Chemical and Biomolecular Engineering, National University of Singapore, 4 Engineering Drive 4, Singapore 117585. E-mail: cheliub@nus.edu.sg
bDepartment of Chemistry, The Hong Kong University of Science and Technology, Clear Water Bay, Kowloon, Hong Kong, China
cInstitute of Materials Research and Engineering, Agency for Science, Technology and Research (A*STAR), 3 Research Link, Singapore 117602
First published on 9th January 2017
Abstract
Direct monitoring of multiple enzyme activities in a given biological process is extremely important for disease diagnosis. Herein, we report a single fluorescent probe that targets two caspase activities in living cells. The probe consists of three parts that includes two AIE fluorogens with distinctive green and red emission colors excitable at a single wavelength, and a hydrophilic peptide as the substrate of the apoptosis initiator caspase-8 and the effector caspase-3. The probe is non-fluorescent in aqueous media. The green and red fluorescence can be sequentially turned on when the peptide substrate is cleaved by the cascade activation of caspase-8 and caspase-3 in early apoptotic HeLa cells induced by hydrogen peroxide. This sequential fluorescence turn-on allows real-time monitoring of the caspase cascade activation during the apoptotic process, which was further explored for evaluating the therapeutic efficiency of anticancer drugs. The probe design strategy developed in this study also proved to be general, which opens a new avenue for real-time, multiplexed imaging of cellular enzyme activity in a biological process.
Introduction
The activities of enzymes are extremely important to understand the progress of a variety of diseases including diabetes, cardiovascular disease, and cancer.1 Therefore, direct monitoring of enzyme activities in a given biological process is an effective approach for disease diagnosis.2 Multiple enzymes are often involved in a biological process to regulate a specific biological event. Direct and simultaneous monitoring of multiple targets in a single process has great potential for biological and clinical studies. The traditional strategy of using multiple fluorescent probes with different emission colors to monitor each enzyme encounters the problems of different biological locations and varied cellular uptake abilities as well as distinctive fluorophore/quencher pair selections. Moreover, real-time multicolor monitoring of multiple enzymes upon a single-wavelength excitation can minimize the complexity of fluorescence imaging, whereas traditional fluorescent dyes with different emission colors have different absorption wavelengths. Quantum dots (QDs), which show single-wavelength excitation with size tunable emissions, are promising to address this problem but are hampered in biological applications due to their potential cytotoxicity.3 Recently, Zhang et al. developed a single fluorescent probe with dual reactive sites that can be used to detect two different reactive oxygen species.4 It remains challenging to develop a single fluorescent probe that can be used for multiple enzyme detection with a single-wavelength excitation.Recently, fluorogens with aggregation-induced emission characteristics (AIEgens) have received considerable attention in biosensing and bioimaging.5–14 The mechanism of AIEgens has been clarified to be due to the restriction of intramolecular motions (RIM) and prohibition of energy dissipation via non-radiative channels.5 Based on this unique property, we and others have developed fluorescence turn-on probes without the incorporation of quenchers for the detection and imaging of different analytes.15 The design strategy of these probes is generally based on the conjugation of a hydrophilic recognition moiety to the AIEgens, which are non-emissive in aqueous media but their fluorescence is activated upon specific analyte recognition and subsequent release of the hydrophobic AIEgens.15 In addition, the large Stokes shifts of AIEgens make it possible to obtain fluorophores with different emission colors upon a single wavelength excitation. This, together with the simplicity of AIE probes,15 makes AIEgens very useful signal reporters in real-time multicolor imaging of multiple enzymes.
As a proof-of-concept, we developed a single fluorescence turn-on probe based on two AIEgens to target the caspase cascade activation in the cell apoptosis process. Caspases are crucial mediators in apoptosis, which involves a family of enzymes at different stages and pathways.16 In a typical apoptosis process, the initiator caspases (e.g. caspase-8 or -9) are in charge of activating the effector caspase (e.g. caspase-3), which will ultimately lead to cell apoptosis.17 As most of the anticancer drugs induce cell death through apoptosis, the imaging of the caspase cascade activation is essential to screen the drugs and study their therapeutic effects. Although various fluorescent probes that target caspase activities have been reported,18–23 there is no study reporting that a single fluorescent probe can be used to monitor multiple caspase activities in living cells.
In this contribution, we described a general platform that a single fluorescent probe can target two caspase activities in living cells (Scheme 1). The probe consists of three parts that includes two AIEgens with green and red emission excitable at a single wavelength of 405 nm, and a hydrophilic peptide (DVEDIETD) as the substrate of caspase-8 (IETD) and caspase-3 (DVED). The probe is almost non-fluorescent in aqueous media. The green and red fluorescence can be sequentially turned on when the peptide substrate is cleaved by the cascade activation of caspase-8 and caspase-3 in the apoptotic HeLa cells induced by hydrogen peroxide (H2O2). The fluorescence turn-on upon a single wavelength excitation allows real-time imaging of the caspase cascade activation during the apoptotic process.
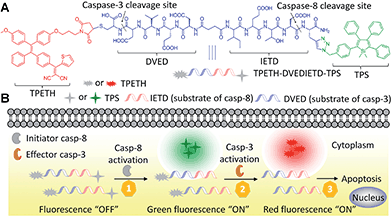 | ||
| Scheme 1 Schematic of a single fluorescent probe with two AIEgens (A) for real-time monitoring of the caspase cascade activation (B). | ||
Results and discussion
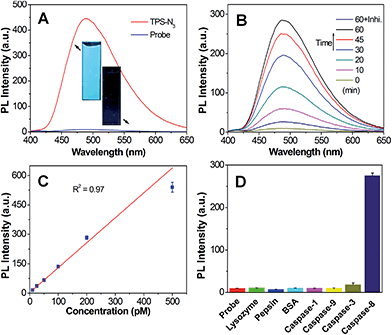
Azide-functionalized tetraphenylsilole (TPS-N3) was synthesized following the method reported in our previous study.8 The synthetic route to malimide-functionalized TPETH (TPETH-Mal) is shown in Scheme S1,† and the intermediates were characterized by NMR (Fig. S1 and S2†). The two isomers of TPETP-NH2 were separated by preparative high-performance liquid chromatography (HPLC), whereas the cis isomer was obtained and its structure was confirmed by 1H COSY and NOESY NMR (Fig. S3–S5†).13 The synthetic procedures for the probe of TPETH–DVEDIETD–TPS (denoted as Probe 1) are shown in Scheme S2.† The “click” reaction between TPS-N3 and CDVEDIETDPra (Cys-Asp-Val-Glu-Asp-Ile-Glu-Thr-Asp-Pra) afforded CDVEDIETD–TPS with a terminal thiol group, which was further reacted with TPETH-Mal to afford Probe 1 as a red powder in 46% yield after HPLC purification and freeze drying. Similarly, the probe of TPETH–DVEDLEHD–TPS (denoted as Probe 2) that targets caspase-9 and caspase-3 was also prepared from CDVEDLEHDPra (Scheme S3†). Detailed characterization data are shown in Fig. S6 and S7.†We first evaluated the optical properties of TPS-N3. As shown in Fig. S8A,† TPS-N3 shows an absorption maximum at 360 nm with an emission maximum at 480 nm. The AIE property of TPS-N3 was confirmed by studying its PL spectra in mixtures of dimethyl sulfoxide (DMSO) and water at different water fractions (fw). As shown in Fig. S8B,† TPS-N3 is almost non-fluorescent in DMSO solution, which should be due to the free motions of TPS phenyl rings in the molecularly dissolved state. However, its fluorescence quickly intensified with the increase in fw. At fw = 99%, the fluorescence was 110-fold stronger than that in DMSO, which should be attributed to the formation of aggregates, and thus restricts the intramolecular motion. This result confirms that TPS-N3 was AIE-active. The PL spectra of Probe 1 together with TPS-N3 in DMSO/PBS mixtures (v/v = 1/99) are shown in Fig. 1A. TPS-N3 showed intense fluorescence, whereas Probe 1 was almost non-fluorescent, which should be attributed to the attachment of hydrophilic peptides to yield the molecularly dissolved state. The fluorescence of Probe 1 (Ex: 360 nm) remains weak in aqueous media with different ionic strength or in cell culture medium (Fig. S9†). The fluorescence change of Probe 1 upon incubation with caspase-8 was further studied. As shown in Fig. 1B, upon addition of caspase-8, the green fluorescence of TPS steadily intensified and was saturated after a 60 min incubation. The fluorescence enhancement was ascribed to the cleavage of the peptide substrate (Scheme S2†) and formation of TPS residue aggregates, which was confirmed by laser light scattering (LLS) and transmission electron microscope (TEM) analyses (Fig. S10†). The specific cleavage of peptide substrate by caspase-8 was confirmed by reverse phase HPLC and mass study through the formation of hydrophobic TPS residue (Fig. S11†). In addition, the fluorescence change was negligible in the presence of caspase-8 inhibitor (Z-IETD-FMK). More importantly, upon treatment of Probe 1 with different concentrations of caspase-8, the fluorescence of the TPS residue at 480 nm was intensified with the increasing concentration of caspase-8. As shown in Fig. 1C, the PL intensities at 480 nm after incubating with different concentrations of caspase-8 show a linear fit with the concentration of caspase-8 (R2 = 0.97), indicating that the PL intensity changes of the TPS residue can be used to quantify the caspase-8 concentration. The kinetic analysis of the enzymatic reaction was also studied by incubating caspase-8 with different concentrations of Probe 1. As shown in Fig. S12,† the Michaelis constants (KM) and the kinetic constants (kcat) were calculated to be 5.40 μM and 1.39 s−1, respectively, which are comparable to those reported in the previous study.24 The selectivity of Probe 1 was also studied by incubating the probe with different caspases or other proteins, and the results revealed that only the treatment of caspase-8 displayed a significant increase in TPS fluorescence (Fig. 1D). These results confirm that the change in the TPS fluorescence was due to the specific cleavage of the peptide substrate by caspase-8.
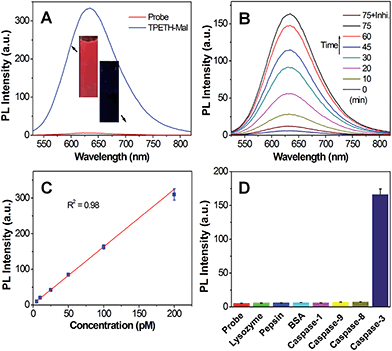
We next studied the optical properties of TPETH-Mal. As shown in Fig. S13A,† TPETH-Mal shows an absorption shoulder at 430 nm with an emission maximum at 650 nm. Since TPS-N3 and TPETH-Mal showed strong absorptions at 405 nm but had different emission maxima, this offers the opportunity to collect dual signals with a single excitation wavelength. The PL spectra of TPETH-Mal in the mixture of DMSO and water at different fw are shown in Fig. S13B.† The fluorescence intensified with an increase in fw, and the formation of aggregates confirmed that TPETH-Mal is also AIE-active. As shown in Fig. 2A, the fluorescence of Probe 1 in DMSO/PBS mixtures (v/v = 1/99) was much weaker than that of TPETH-Mal at the same concentration. However, in the presence of caspase-3, the red fluorescence of TPETH steadily intensified with the incubation time (Fig. 2B). The fluorescence change was prohibited when caspase-3 inhibitor (Z-DEVD-FMK) was present. The fluorescence of Probe 1 (Ex: 430 nm) remained weak in aqueous media with different ionic strength or in cell culture medium (Fig. S14†). The fluorescence enhancement was ascribed to the cleavage of the peptide substrate and aggregation of the hydrophobic TPETH residue, which was confirmed by LLS studies and TEM (Fig. S15†). The specific cleavage of the peptide substrate by caspase-3 (Scheme S2†) was confirmed by reverse phase HPLC and mass study through the formation of hydrophobic TPETH residue (Fig. S16†). The KM and kcat of the enzymatic reaction of caspase-3 to Probe 1 were calculated to be 6.58 μM and 2.09 s−1 (Fig. S17†), respectively, which are of the same order as the previous report.24 The fluorescence intensity of Probe 1 at 650 nm after treatment with different concentrations of caspase-3 also showed a linear fit to the caspase-3 concentrations (R2 = 0.98), suggesting that the fluorescence change of TPETH can be used to quantify the caspase-3 concentration (Fig. 2C). As shown in Fig. 2D, only the treatment of the probe with caspase-3 displays a significant fluorescence increase at 650 nm, which confirms its high selectivity. Since Probe 2 shares the same AIEgens as Probe 1, it showed similar optical properties as those described for Probe 1.
The fluorescence changes of Probe 1 after incubation with the cell lysate of normal or apoptotic HeLa cells were also studied. The fluorescence changes of TPS and TPETH were monitored along with the incubation time. As shown in Fig. S18,† the PL intensities of the probe at 480 and 650 nm quickly increased upon incubation with the cell lysate of apoptotic HeLa cells. In contrast, the fluorescence change of the probe was negligible in the lysate of normal HeLa cells, indicating that the probe can be specifically recognized by caspases.
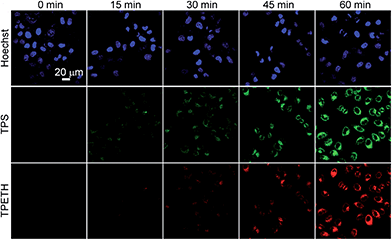
Next, we evaluated the potential application of Probe 1 for real-time imaging of caspase cascade activation in HeLa cells using confocal microscopy. The apoptotic HeLa cells were induced by H2O2, which was reported to stimulate caspase-3 activation through the caspase-8 pathway.25 The HeLa cells were first incubated with Probe 1 for 2 h before the caspase was initiated by H2O2 and the fluorescence changes of TPS and TPETH residues were monitored. As shown in Fig. 3, the cells treated with the Probe 1 only show a low background signal. Once the cells were further treated with H2O2, along with the incubation time, the green fluorescence from the TPS residue and the red fluorescence from the TPETH residue gradually increased, enabling clear visualization of the apoptotic process. In contrast, cells without treatment with H2O2 showed a negligible fluorescence increase (Fig. S19†). Comparison of the fluorescence change between TPS and TPETH reveals that the activation of caspase-8 is about 15 min earlier than that of caspase-3. This agrees with the fact that H2O2 activates procaspase-8 to form activated caspase-8, which subsequently activates procaspse-3 to form caspase-3, leading to cell apoptosis.17 The sequential fluorescence turn-on of TPS and TPETH after H2O2 treatment was also confirmed by flow cytometric studies (Fig. S20†). In contrast, when the cells were treated with diosgenin, only the fluorescence turn-on of TPETH was observed (Fig. S21†). Similar dual fluorescence turn-on was also observed in Probe 2 pre-incubated HeLa cells upon treatment with diosgenin (Fig. S22†). This is due to the fact that diosgenin can stimulate caspase-3 activation through caspase-9 but not caspase-8 pathway.26 These results indicate high specificity of both probes.
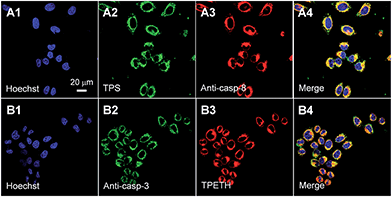
To confirm that the fluorescence change of TPS and TPETH could indicate the caspase-8/3 activation during cell apoptosis, HeLa cells were co-stained with anti-caspase-8/3 primary antibodies and a secondary antibody labeled with Texas Red. As shown in Fig. 4, the fluorescence of TPS and TPETH residues in HeLa cells after H2O2 treatment overlaps well with the immunofluorescence signals from Texas Red, indicating that the fluorescence turn-on of TPS and TPETH is indeed attributed to the activated caspase-8 and caspase-3, respectively. In contrast, diosgenin-treated HeLa cells with Probe 2 showed the activation of caspase-9 but not caspase-8 (Fig. S23 and S24†). This further highlights the uniqueness of our probe design and function. Note that both probes (up to 25 μM) did not show any obvious cytotoxicity to HeLa cells after 48 h incubation (Fig. S25†). Overall, the above-mentioned results confirm that both probes can be utilized for real-time imaging of caspase cascade activation and have the potential to differentiate the apoptosis pathways.
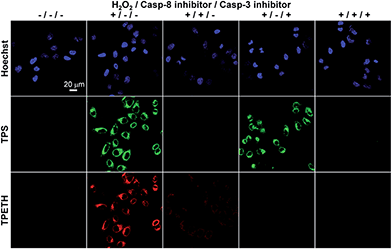
To further study the caspase expression profiles in apoptotic cells, Probe 1 incubated HeLa cells were also treated with different combinations of H2O2, caspase-8 inhibitor, and caspase-3 inhibitor. As shown in Fig. 5, the cells treated with Probe 1 only show a dark background. However, strong green and red fluorescent signals were observed when the cells were treated with H2O2. To confirm whether the fluorescence turn-on is attributed to the activation of specific caspases, the cells were pretreated with caspase-8 and/or caspase-3 inhibitor before exposure to H2O2. When the cells were pretreated with caspase-8 inhibitor, followed by H2O2 treatment, both green and red fluorescent signals decreased. This should be due to the inhibition of caspase-8 activation, which also prevented the activation of caspase-3. When the cells were pretreated with caspase-3 inhibitor, and then apoptosis was induced by H2O2, the green fluorescence was maintained, whereas the red fluorescence decreased. This result indicates that the inhibition of the downstream enzyme caspase-3 does not interfere with the upstream enzyme caspase-8, but not the opposite. In addition, the green and red fluorescent signals were greatly decreased when both inhibitors were used. The above-mentioned results confirm that the sequential turn-on of green and red fluorescence was specifically due to the cascade activation of caspase-8 and caspase-3.
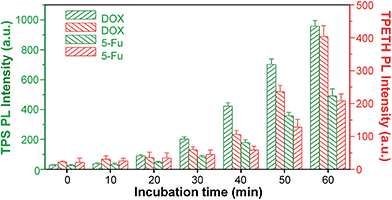
Since most anticancer drugs can induce cell death through apoptosis, the fluorescence change of Probe 1 in response to the caspases activity was further used to evaluate their therapeutic efficiency. In these studies, HeLa cells were co-incubated with Probe 1 and two commonly used anticancer drugs, doxorubicin (DOX) and 5-fluorouracil (5-Fu), and the fluorescence changes of TPS and TPETH were monitored by a microplate reader. The probe-incubated HeLa cells were further treated with DOX or 5-Fu and the fluorescence changes were studied at different times. As shown in Fig. 6, upon the addition of DOX, the fluorescence of TPS appeared first, which gradually intensified with time, whereas the fluorescence of TPETH was observed about 10 minutes later. This agrees with the fact that initiator caspase-8 was activated first, which subsequently activates the effector caspase-3. A similar trend was also observed for 5-Fu-incubated HeLa cells, but both fluorescence lit up at a later stage and the intensity was also lower than that for DOX. This is because DOX shows more potent toxicity to HeLa cells. It has a half maximal inhibitory concentration (IC50) of 13.4 μM for DOX to HeLa cells, which is lower than that for 5-Fu (29.6 μM, Fig. S26†). Note that HeLa cells without treatment with DOX or 5-Fu showed negligible fluorescence increase (Fig. S27†). These results demonstrate that the probe can be used for real-time monitoring and evaluating the therapeutic responses of anticancer drugs.
Conclusions
In summary, we developed unique and simple fluorescent probes with dual signal turn-on for caspases-8/3 and 9/3 imaging upon a single wavelength excitation. Due to the unique property of the AIEgens, the fluorescence of the probes was initially quenched, but a two-signal turn-on was sequentially produced upon the caspase cascade activation. As a proof-of-concept, the cascade activation of initiator caspase-8 and effector caspase-3 induced by H2O2 was monitored by Probe 1 in real-time in living HeLa cells, which was further explored for evaluating the therapeutic efficiency of drugs. Similarly, Probe 2 targeting caspase-9/3 was also studied, confirming the generality of the probe design strategy. Compared to the traditional probes that can only be used for single enzyme imaging, the probes developed in this study using AIEgens for multiplexed imaging do not complicate the probe design, whereas offer multiple enzyme imaging upon a single wavelength excitation. In addition, the design strategy of AIEgen-based probes can be generalized to other probes simply by substituting the substrate sequences, which will open new avenues for multiplexed diagnosis, imaging, and drug screening applications.Acknowledgements
We thank Singapore NRF Investigatorship (R279-000-444-281), National University of Singapore (R279-000-482-133), and the Institute of Materials Research and Engineering of Singapore (IMRE/14-8P1110) for financial support.References
- X. S. Puente, L. M. Sanchez, C. M. Overall and C. Lopez-Otin, Nat. Rev. Genet., 2003, 4, 544–558 CrossRef CAS PubMed.
- M. Drag and G. S. Salvesen, Nat. Rev. Drug Discovery, 2010, 9, 690–701 CrossRef CAS PubMed.
- E. Oh, R. Liu, A. Nel, K. B. Gemill, M. Bilal, Y. Cohen and I. L. Medintz, Nat. Nanotechnol., 2016, 11, 479–486 CrossRef CAS PubMed.
- R. L. Zhang, J. Zhao, G. M. Han, Z. J. Liu, C. Liu, C. Zhang, B. H. Liu, C. L. Jiang, R. Y. Liu, T. T. Zhao, M. Y. Han and Z. P. Zhang, J. Am. Chem. Soc., 2016, 138, 3769–3778 CrossRef CAS PubMed.
- J. Mei, N. L. C. Leung, R. T. K. Kwok, J. W. Y. Lam and B. Z. Tang, Chem. Rev., 2015, 115, 11718–11940 CrossRef CAS PubMed.
- K. Li and B. Liu, Chem. Soc. Rev., 2014, 43, 6570–6597 RSC.
- W. Guan, W. Zhou, C. Lu and B. Z. Tang, Angew. Chem., Int. Ed., 2015, 54, 15160–15164 CrossRef CAS PubMed.
- Y. Yuan, R. T. Kwok, B. Z. Tang and B. Liu, J. Am. Chem. Soc., 2014, 136, 2546–2554 CrossRef CAS PubMed.
- M. Ye, X. Wang, J. Tang, Z. Guo, Y. Shen, H. Tian and W. Zhu, Chem. Sci., 2016, 7, 4958 RSC.
- X. D. Xue, Y. Y. Zhao, L. R. Dai, X. Zhang, X. H. Hao, C. Q. Zhang, S. D. Huo, J. Liu, C. Liu, A. Kumar, W. Q. Chen, G. Z. Zou and X. J. Liang, Adv. Mater., 2014, 26, 712–717 CrossRef CAS PubMed.
- A. D. Shao, Y. S. Xie, S. J. Zhu, Z. Q. Guo, S. Q. Zhu, J. Guo, P. Shi, T. D. James, H. Tian and W. H. Zhu, Angew. Chem., Int. Ed., 2015, 54, 7275–7280 CrossRef CAS PubMed.
- Y. Yuan, C. Zhang, S. Xu and B. Liu, Chem. Sci., 2016, 7, 1862–1866 RSC.
- Y. Y. Yuan, C.-J. Zhang, R. T. Kwok, S. D. Xu, R. Y. Zhang, J. E. Wu, B. Z. Tang and B. Liu, Adv. Funct. Mater., 2015, 25, 6586–6595 CrossRef CAS.
- Z. Xie, C. Chen, S. Xu, J. Li, Y. Zhang, S. Liu, J. Xu and Z. Chi, Angew. Chem., Int. Ed., 2015, 54, 7181–7184 CrossRef CAS PubMed.
- J. Liang, B. Tang and B. Liu, Chem. Soc. Rev., 2015, 44, 2798–2811 RSC.
- M. Lamkanfi, N. Festjens, W. Declercq, T. Vanden Berghe and P. Vandenabeele, Cell Death Differ., 2007, 14, 44–55 CrossRef CAS PubMed.
- S. J. Riedl and Y. G. Shi, Nat. Rev. Mol. Cell Biol., 2004, 5, 897–907 CrossRef CAS PubMed.
- K. Boeneman, B. C. Mei, A. M. Dennis, G. Bao, J. R. Deschamps, H. Mattoussi and I. L. Medintz, J. Am. Chem. Soc., 2009, 131, 3828–3829 CrossRef CAS PubMed.
- B. Shen, J. Jeon, M. Palner, D. Ye, A. Shuhendler, F. T. Chin and J. Rao, Angew. Chem., Int. Ed., 2013, 52, 10511–10514 CrossRef CAS PubMed.
- L. Zhang, J. P. Lei, J. T. Liu, F. J. Ma and H. X. Ju, Chem. Sci., 2015, 6, 3365–3372 RSC.
- J. F. Lovell, M. W. Chan, Q. Qi, J. Chen and G. Zheng, J. Am. Chem. Soc., 2011, 133, 18580–18582 CrossRef CAS PubMed.
- S. Y. Li, L. H. Liu, L. Rong, W. X. Qiu, H. Z. Jia, B. Li, F. Li and X. Z. Zhang, Adv. Funct. Mater., 2015, 25, 7317–7326 CrossRef CAS.
- R. Huang, X. Wang, D. Wang, F. Liu, B. Mei, A. Tang, J. Jiang and G. Liang, Anal. Chem., 2013, 85, 6203–6207 CrossRef CAS PubMed.
- G. Mor and A. Alvero, Apoptosis and Cancer: Methods and Protocols, Humana Press, New York, 2007 Search PubMed.
- Y. Y. Wu, D. J. Wang, X. D. Wang, Y. Y. Wang, F. L. Ren, D. Chang, Z. J. Chang and B. Q. Jia, Cell. Physiol. Biochem., 2011, 27, 539–546 CrossRef CAS PubMed.
- R. Hou, Q. L. Zhou, B. X. Wang, S. Tashiro, S. Onodera and T. Ikejima, Acta Pharmacol. Sin., 2004, 25, 1077–1082 Search PubMed.
Footnote |
| † Electronic supplementary information (ESI) available. See DOI: 10.1039/c6sc04322d |
| This journal is © The Royal Society of Chemistry 2017 |

