 Open Access Article
Creative Commons Attribution 3.0 Unported Licence
Simultaneous impedance spectroscopy and fluorescence microscopy for the real-time monitoring of the response of cells to drugs†
M.
Parviz
ab,
K.
Gaus
bc and
J. J.
Gooding
 *ab
*ab
aSchool of Chemistry, ARC Centre of Excellence in Convergent Bio-Nano Science and Technology, University of New South Wales, New South Wales 2052, Australia. E-mail: justin.gooding@unsw.edu.au
bAustralian Centre for NanoMedicine, University of New South Wales, New South Wales 2052, Australia
cEMBL Australia Node in Single Molecule Science, ARC Centre of Excellence in Advanced Molecular Imaging, University of New South Wales, New South Wales 2052, Australia
First published on 3rd January 2017
Abstract
A dual fluorescence microscopy and electrochemical strategy to investigate how cell–surface interactions influence the cellular responses to cues for the cell-based biosensing of drug efficacy is reported herein. The combined method can be used to not only monitor the importance of controlling the cellular adhesive environment on the cell response to drugs but it also provides biological information on the timescales of downstream outside-in signaling from soluble cues. As an example of the use of the combined method, we show how adhesive cues influence the signalling responses of cells to soluble cues. G-protein-coupled receptors were used as the target for the soluble cues. The changes in cell adhesion, cell morphology and Ca2+ flux induced by soluble histamine were simultaneously monitored as a function of the spacing of the adhesive ligand RGD on the interdigitated indium tin oxide electrodes. The simultaneous measurements revealed that the timescales of histamine-induced Ca2+ mobilization and the decrease in cell–cell adhesions are correlated. Furthermore, cells on the surfaces with an RGD spacing of 31 nm were shown to display a faster release of Ca2+ and change in cell adhesion upon histamine stimulation compared to cells on other surfaces.
Introduction
Many environmental cues, including a large number of prescription drugs, target cells through G-protein-coupled receptors (GPCRs) as the largest family of cell–surface receptors.1,2 The binding of an external signal to a GPCR typically results in the stimulation of the complex interconnected signaling pathways through which cells coordinate a wide variety of fate decisions. Therefore, there is a tremendous interest in developing cell chip technologies based on monitoring different events on the activity of GPCRs.3 The kinetics of these cellular pathways significantly differ from the milliseconds timescale (e.g., GPCR conformational changes or Ca2+ flux) to hours (e.g., cytoskeletal modulation).4 The GPCRs monitoring technologies are mainly based either on optical measurements5 or electrical detections.6–9 Among these, fluorescence microscopy10 and electrical impedance spectroscopy11 are two of the more popular methods, and are, in fact, complementary. Fluorescence microscopy enables the precise monitoring of short-lived specific sub-cellular processes, organelles, and proteins with labeled fluorescent tags.10 In contrast, cell-based impedance measurements, which were pioneered by Giaever and Keese,12 provide real-time information on the minute changes in the adhesion of cells to cells/surfaces at the whole-cell level over extended periods of time in a label-free manner.In organisms, cells are surrounded by an extracellular matrix containing adhesive ligands that modulate cell behavior. Hence, using molecularly engineered surfaces with controlled expressions of cell adhesive ligands has started to become more prevalent in the development of cell chips.13 It has been demonstrated that a varied spatial distribution of adhesive RGD ligands regulates not only the cell phenotype but also the outside-in and inside-out signalling processes.14–16 However, knowledge of how the dynamics of cellular responses to a soluble cue is influenced by surface chemistry is still in its infancy, but is of significant importance in the in vitro testing of drugs.
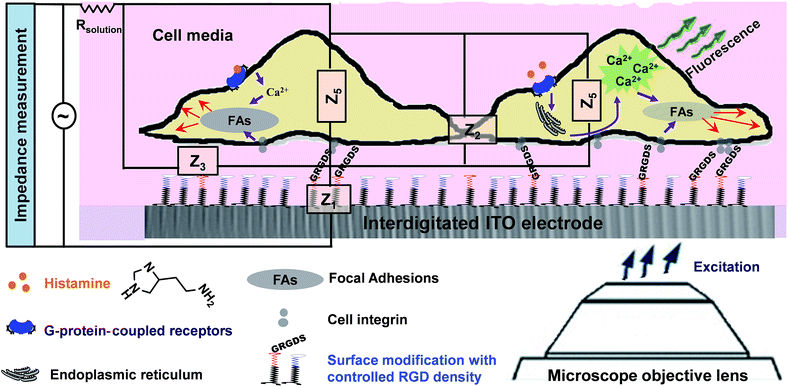
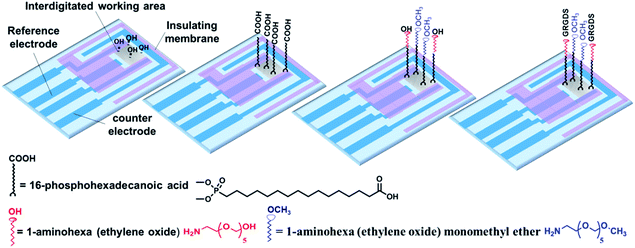
In the present study, we sought to combine impedance spectroscopy and live fluorescence microscopy, simultaneously, to provide a platform technology to investigate GPCRs' activity in a more comprehensive manner. This was achieved using optically transparent interdigitated indium tin oxide (ITO) electrodes, which we have shown can be precisely modified with self-assembled monolayers to given biointerfaces with a controlled presentation of cell adhesive ligands. Fluorescence microscopy was utilized to monitor transient histamine-induced Ca2+ release from the endoplasmic reticulum (ER). Impedance spectroscopy was employed to acquire information on the dynamic changes in cell adhesion, which can be regulated by both surface chemistry and the soluble GPCRs stimulators. Coupling the fluorescence and impedance readout methods is particularly relevant for tracking events with significantly different timescales but that are connected through GPCRs, as this would not be possible using a single detection method. Furthermore, application of the developed technique can be extended to investigate the possible effects of surface designs on cellular events in response to soluble cues and their timescales. The summarized measurement principles of the work are schematically illustrated in Fig. 1.
Experimental methods
Chemicals
16-Phosphohexadecanoic acid (PHDA) of 99.5% purity, dimethylaminopropylcarbodiimide (EDC), N-hydroxysuccinimide (NHS), dichloromethane, N,N′-disuccinimidyl carbonate (DSC), 4-(dimethylamino)pyridine (DMAP), acetonitrile and anhydrous dimethyl sulfoxide (DMSO) were purchased from Sigma-Aldrich (Sydney, Australia). 1-Aminohexa(ethylene oxide) and 1-aminohexa(ethylene oxide) monomethyl ether were obtained from Biomatrik Inc (Jiaxing, China). Dulbecco modified Eagle medium (DMEM), L-glutamine and fura-2 AM were purchased from Invitrogen (Sydney, Australia). Gly-Arg-Gly-Asp-Ser (GRGDS) was obtained from Genscript (Sydney, Australia).Cell culture
HeLa cells (CCL-2, American Type Culture Collection) were grown to confluence in DMEM culture media supplemented with 10% fetal bovine serum and 0.1% glutamine at 37 °C in a humidified atmosphere with 5% CO2. Every 3–4 days, the cells were detached from the culture flask using trypsin and washed with PBS containing 0.9% sodium chloride, and were then resuspended in fresh media. The suspended cells were counted, and a high density of 1.5 × 10⁵ cells per cm2 in 650 μL of the media was seeded on each modified interdigitated ITO surface for 3.5 h or until an 80-98% confluent cell layer is reached on bare surfaces.Loading HeLa cells with fura-2 AM
The plated HeLa cells on interdigitated ITO surfaces were washed twice using phenol red-free DMEM before being loaded with fura-2 AM dyes. The loading was performed using the protocol developed by Herman's group.17 Briefly, the cells were incubated in phenol red-free DMEM containing 10% fetal bovine serum (FBS), 2 μM fura-2 AM and 1 μL of 10% w/v Pluronic F-127 in DMSO for 45 min at room temperature. The cell-covered surfaces were washed twice with an imaging buffer made of Hanks' balanced salt solution plus 0.8 mM MgCl2, 1.6 mM CaCl2 and 5% FBS.Preparation and addition of histamine solution
Histamine solution was prepared freshly by dissolving the histamine powder in Hanks' balanced salt solution. In each experiment, 50 μL of the 1.5 mM histamine solution was pipetted in to the media. The final concentration of histamine in the media was 100 μM. In addition, before adding histamine, 50 μL of Hanks' balanced salt solution was pipetted to the exciting cell media in the chamber to indicate that there was no change by adding just the buffer. The addition of the solutions was done through the hole in the chamber lid.Simultaneous live microscopy and real-time impedance measurements
The interdigitated ITO electrodes used in this study consisted of 65 pairs of finger electrodes 10 μm wide with a 5 μm spacing between the electrodes, which were 2 mm in length and approximately 100 nm thick on rectangular AT-cut quartz crystals approximately 0.45 mm thick. The electrodes were placed inside the custom-made electro/optical chamber (Micrux technologies, Oviedo, Spain) and put under the microscope while it was connected to the potentiostat (SP 200, BioLogic Science Instruments). For the impedance measurement and analysis, the interdigitated ITO surfaces were probed with a weak non-invasive AC signal within the frequency range of 400–40![[thin space (1/6-em)]](https://www.rsc.org/images/entities/char_2009.gif) 000 Hz (with 10 mV AC voltage). The impedance of the modified cell-free interdigitated ITO electrodes was measured as the baseline data. Then, the real-time impedance readout of the cell layer 10 min before and continuously 3 h after the histamine addition was monitored. The three-electrode system measures the signals from one half of the interdigitated pairs of electrodes, that is from 65 ITO microelectrode fingers, with an active surface area of around 1.3 × 10⁻² cm2.
000 Hz (with 10 mV AC voltage). The impedance of the modified cell-free interdigitated ITO electrodes was measured as the baseline data. Then, the real-time impedance readout of the cell layer 10 min before and continuously 3 h after the histamine addition was monitored. The three-electrode system measures the signals from one half of the interdigitated pairs of electrodes, that is from 65 ITO microelectrode fingers, with an active surface area of around 1.3 × 10⁻² cm2.
Histamine was added after the surfaces containing cells were equilibrated at 37 °C and the impedance level stabilized. The impedance values were normalized by dividing the impedance of the cell-covered electrode to the baseline impedance. EC-Lab® V10.33 (BioLogic, Science Instruments) software was used to analyze the impedance data. The sequences of the fluorescence and phase-contrast images were acquired on a Zeiss Axio Observer X.1 Spinning Disc/TIRF inverted microscope with Zeiss ZEN software. The microscope was equipped with a lambda DG4 light source switcher and a scientific complementary metal-oxide semiconductor (sCMOS) camera (Orca Flash 4). The wavelength switcher allowed shifting between two wavelengths in less than 1.2 ms.
Ratiometric analysis
The herein reported average ratiometric values are the mean of the ratiometric value of cells in the field of view. The ratiometric value at each time point was calculated using Fiji software as follows: by opening the movie recorded from ensembles of cells > choosing split channels > extracting the frame of the time of interest > drawing the rough area around each individual cells, regions of interest (ROI), using the “freehand selection” tool > saving these areas using “ROI manager” > measuring the mean grey value of each ROI of each channel > subtracting the background intensity > dividing the aligned emission intensity excited at 340 nm by that at 380 nm, pixel by pixel, over each manually traced cell region after subtracting the background fluorescence intensity. The background fluorescence intensity was obtained by calculating the mean grey value of a cell-free area on each frame. The ratiometric value of each individual cell was normalized by dividing the fura-2 ratio value with the subtracted background data at each time point with the average ratiometric value of that cell during the last 2 min before histamine addition, again after subtracting the background value.The time-resolution ratiometric images of an individual cell were obtained from the created ratiometric movie of the ensemble of cells as follows; by drawing the ROI around the cells in the ratiometric movie > choosing Image > Stacks > Tools > Make Substacks. Then, the ratiometric movie of the single cell was automatically created by the software. The frames related to the time point of interest were extracted from the movie. The false colour images were created using the “Lookup Tables” in the “Image” tab of the Fiji software. The summarized average variations in the percentages of the fura-2 ratio were calculated by subtracting the average ratiometric values at the beginning of the experiment from the maximal ratiometric values after the histamine addition.18
Analysis of the impedance of the cell layer
In this study, these values were calculated based on fitting the mathematical model to the experimentally-acquired frequency-resolved impedance raw data using MATLAB® software from The MathWorks Inc (Natick, MA. Pelli, DG), using the fitting curve function.Preparation of the RGD-controlled surfaces
A multi-step strategy was followed to modify the surfaces chemically with RGD molecules with defined spacing. To this end, the interdigitated ITO surfaces were first rinsed with copious amounts of Milli-Q water and methanol and were then placed in an oxygen-plasma cleaner after being dried under a nitrogen stream (Harrick Plasma Cleaner/Sterilizer PDC-32G, Ossining, NY) for 5 min. PHDA SAMs were assembled from 400 μL of a 5 mM PHDA solution in methanol for 12 h. The surfaces were next rinsed with methanol and Milli-Q water and annealed at 150 °C for 48 h under vacuum. To further modify the PHDA SAM, the terminal carboxylic acid groups were activated with 400 μL of 50 mM EDC/NHS in an aqueous solution for 2 h. The succinimide ester activated groups of the PHDA SAMs then were incubated in a 200 μL solution containing various ratios of 1-aminohexa(ethylene oxide) to 1-aminohexa(ethylene oxide) monomethyl ether for 12 h to bond to their amine groups. These molecules provide the inert background to avoid nonspecific cell adhesion.19 The ratio of these two ethylene oxide molecules is the key to regulating the RGD spacing on the surfaces. The modified surfaces were rinsed with DMSO several times and then dried under a nitrogen stream. The hydroxyl-terminated 1-aminohexa(ethylene oxide) molecules were then activated with 400 μL of 0.1 M DSC/DMAP in anhydrous DMSO for 6 h. The activated surfaces were washed with a copious amount of DMSO and then Milli-Q water, followed by immersion in 400 μL 20 mM phosphate buffer containing 15 μg mL−1 of GRGDS for 30 min at room temperature. GRGDS attaches to hexa(ethylene oxide) molecules on the surface by forming amide bonds.20,21 The modified interdigitated ITO surfaces were washed with Milli-Q water and PBS three times for 5 min each time to remove any physically adsorbed peptides. Solvent evaporation was prevented during the surface modification by incubating the samples in a glass container with a sealed lid. Small open petri dishes, containing additional solvent, were also placed inside this sealed container to keep the environment vapour rich. Finally, the surfaces were sterilized with 70% ethanol and then rinsed with PBS in a safety cabinet before plating the cells.Characterization of the RGD-controlled surfaces
XPS analyses were conducted using an ESCALAB 220iXL spectrometer equipped with a monochromatic Al Kα source (1486.6 eV), a hemispherical analyzer and a multichannel detector. The spectra were obtained in normal emission with the analyzing chamber operating below 10−10 mbar. The angle of incidence with respect to the analyzer lens was set to 58° with a spot size of approximately 1 mm2. High-resolution spectra and wide surveys were obtained using a pass energy of 20 and 100 eV, respectively. The experimental energy shifts were corrected with reference to C 1s at 284.8 eV. The fitting of the spectra was performed using a nonlinear least-squares procedure and a simple Lorentzian–Gaussian function. The percentage coverage for the different elements and sub-groups were estimated from the respectively fitted area and the attributed sensitivity factors. To further characterize the modified surfaces, cyclic voltammograms before and after modification of an interdigitated ITO electrode with the self-assembled PHDA and GRGDS were recorded. The XPS results were used to estimate the RGD spacing (see the ESI for more detail†) of the prepared surfaces, as we have reported previously.22Statistical analysis
Herein, the data are displayed as means ± RSD unless otherwise stated. Data were analyzed using the GraphPad Prism version 6.0 data management software to conduct ANOVA on groups of data. For statistics, the minimum number of repeated experiments “n” was equal to 3.Results
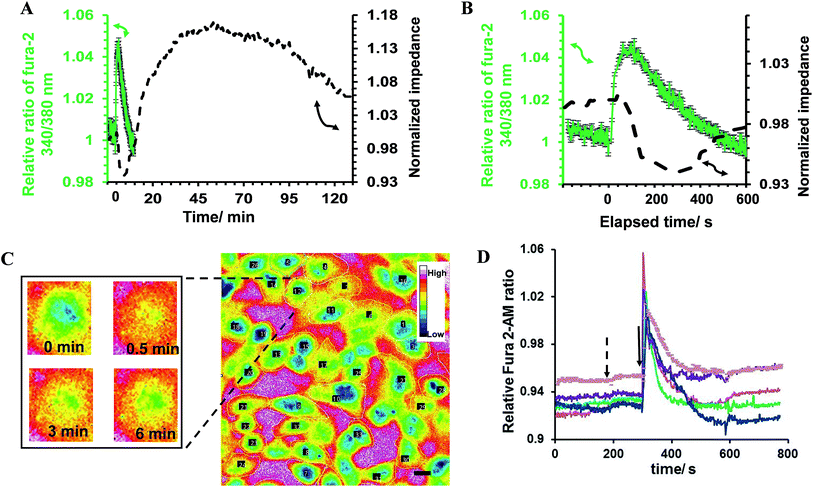
In the first part of the study, the feasibility of combining both impedance and live fluorescence measurements on interdigitated ITO surfaces was examined. A custom-made electro/optical chamber was employed to provide the possibility of running electrical measurements and inverted microscopy on transparent interdigitated ITO electrodes (a picture of the simultaneous measurement set-up can be found in the ESI (Fig. S1)).† The experimental conditions were kept ideal for live cells by controlling the temperature at 37 °C and maintaining the atmosphere humid with 5% CO2 in the microscope cage. The response of the fura-2-loaded HeLa cells on the interdigitated ITO surfaces to 100 μM histamine was explored using the developed set-up. The simultaneously recorded histamine-induced impedance changes and Ca2+ flux are shown in Fig. 2A. The average Ca2+ peak reached a maximum within 60 s and then decreased to a baseline level in a further 490 s. At the same time, histamine caused a rapid dip in impedance that persisted for a few minutes before restoring to the initial value. Thereafter, the impedance increased over a time span of approximately 35 min, before returning to a basal level after a further 80 min. The real-time impedance results are reported at the frequency of 4000 Hz. We found this frequency as the most sensitive frequency to display impedance alteration caused by the HeLa cell layer among the examined frequencies between 40![[thin space (1/6-em)]](https://www.rsc.org/images/entities/char_2009.gif) 000 Hz and 400 Hz (Fig. S2 shows some examples (ESI)†). Notably, the observed trend for the changes in impedance and calcium ion mobilization are in agreement with those in previous studies employing impedance spectroscopy on gold23 or Ca2+ flux measurements on glass coverslips.17 Thus, we demonstrated that the developed set-up allows the monitoring of sub-cellular and whole-cell responses of ensembles of cells over a wide timescale from milliseconds to hours. Fig. 2C presents the image of an ensemble of fura-2-loaded HeLa cells and time-lapse montages of one of the cells responding to histamine, as an example. These images show that high-quality fluorescence images are obtainable from the surfaces using the present set-up. Examples of the fura-2 ratio alteration of some individual cells in the cell layer in the field of view over time are shown in Fig. 2D. The response of many more cells can be found in Fig. S3 (ESI†). The results indicate that the concentration of 100 μM of histamine evokes the cytosolic Ca2+ release by almost all the fura-2-loaded cells. This is the reason for choosing this concentration, as it has also been reported previously.24 Here, histamine was dissolved in Hanks' balanced salt solution. It was seen that the addition of Hanks' balanced salt solution alone caused no significant changes in calcium signals. The addition of buffer also did not cause any change in the impedance values (results not shown here). These results indicate that the obtained responses purely originated from the histamine stimulation. Furthermore, we investigated whether the fura-2 loading and imaging process for the time window of the fluorescence recording interrupted the impedance results of the cells by recording the cell responses using impedance spectroscopy and phase-contrast microscopy on dye-free HeLa cells, as shown in Fig. S4 (ESI†). The simultaneous measurement revealed that the onset of the impedance alteration was delayed by 30–60 s after the intracellular Ca2+ changes. In addition, it was seen that the timescale of the fluorescence response from the Ca2+ mobilization was correlated with the time of the dip in the impedance signal before it was restored to the initial value (Fig. 2B).
000 Hz and 400 Hz (Fig. S2 shows some examples (ESI)†). Notably, the observed trend for the changes in impedance and calcium ion mobilization are in agreement with those in previous studies employing impedance spectroscopy on gold23 or Ca2+ flux measurements on glass coverslips.17 Thus, we demonstrated that the developed set-up allows the monitoring of sub-cellular and whole-cell responses of ensembles of cells over a wide timescale from milliseconds to hours. Fig. 2C presents the image of an ensemble of fura-2-loaded HeLa cells and time-lapse montages of one of the cells responding to histamine, as an example. These images show that high-quality fluorescence images are obtainable from the surfaces using the present set-up. Examples of the fura-2 ratio alteration of some individual cells in the cell layer in the field of view over time are shown in Fig. 2D. The response of many more cells can be found in Fig. S3 (ESI†). The results indicate that the concentration of 100 μM of histamine evokes the cytosolic Ca2+ release by almost all the fura-2-loaded cells. This is the reason for choosing this concentration, as it has also been reported previously.24 Here, histamine was dissolved in Hanks' balanced salt solution. It was seen that the addition of Hanks' balanced salt solution alone caused no significant changes in calcium signals. The addition of buffer also did not cause any change in the impedance values (results not shown here). These results indicate that the obtained responses purely originated from the histamine stimulation. Furthermore, we investigated whether the fura-2 loading and imaging process for the time window of the fluorescence recording interrupted the impedance results of the cells by recording the cell responses using impedance spectroscopy and phase-contrast microscopy on dye-free HeLa cells, as shown in Fig. S4 (ESI†). The simultaneous measurement revealed that the onset of the impedance alteration was delayed by 30–60 s after the intracellular Ca2+ changes. In addition, it was seen that the timescale of the fluorescence response from the Ca2+ mobilization was correlated with the time of the dip in the impedance signal before it was restored to the initial value (Fig. 2B).
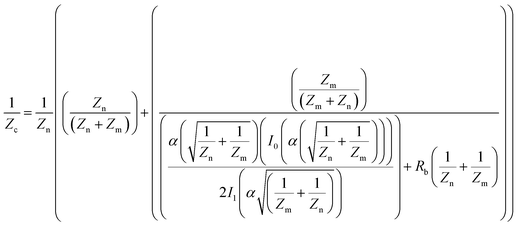
The impedance results were further analyzed to obtain the contribution the changes in the cell–cell and cell–surface adhesion make to the alteration of the impedance value.12,25,26 To this end, frequency-resolved impedance readings (40![[thin space (1/6-em)]](https://www.rsc.org/images/entities/char_2009.gif) 000–400 Hz) at different time points were subjected to a mathematical model developed by Giaever and Keese12 (Fig. S5 (ESI†)). In this model, the current is assumed to flow radially into the space between the cell's ventral surface and the substrate and then escapes between the cells. The current density is assumed to be consistent in the z-direction and the cells are approximated as disc-shaped objects with insulating membrane surfaces and filled with a conducting electrolyte.12 The total impedance of the monolayer is made up of the impedance between the ventral surface of the cell membrane and the substratum, the impedance between the cells and the impedance of the cell itself, which is dominated by the membrane capacitance. According to this model, the specific impedance for a cell-covered electrode can be written according to the following equation:12,25
000–400 Hz) at different time points were subjected to a mathematical model developed by Giaever and Keese12 (Fig. S5 (ESI†)). In this model, the current is assumed to flow radially into the space between the cell's ventral surface and the substrate and then escapes between the cells. The current density is assumed to be consistent in the z-direction and the cells are approximated as disc-shaped objects with insulating membrane surfaces and filled with a conducting electrolyte.12 The total impedance of the monolayer is made up of the impedance between the ventral surface of the cell membrane and the substratum, the impedance between the cells and the impedance of the cell itself, which is dominated by the membrane capacitance. According to this model, the specific impedance for a cell-covered electrode can be written according to the following equation:12,25
![[thin space (1/6-em)]](https://www.rsc.org/images/entities/char_2009.gif) 000 Hz to 400 Hz (10 mV). Also, in this equation, α and Rb describe the contributions cell–surface and cell–cell adhesion make to defining the total cell-covered impedance, respectively. Therefore, the values of α, Rb and Zm are the only adjustable parameters that can be obtained by finding the best fit of the impedance data.27 The resistance of the media was subtracted from the measured impedance before the calculations were done and were then added back for comparing the experimental and calculated data. Zm is dominated by the cell-specific membrane capacitance (Cm) according to the following equation:
000 Hz to 400 Hz (10 mV). Also, in this equation, α and Rb describe the contributions cell–surface and cell–cell adhesion make to defining the total cell-covered impedance, respectively. Therefore, the values of α, Rb and Zm are the only adjustable parameters that can be obtained by finding the best fit of the impedance data.27 The resistance of the media was subtracted from the measured impedance before the calculations were done and were then added back for comparing the experimental and calculated data. Zm is dominated by the cell-specific membrane capacitance (Cm) according to the following equation:| Zm = 1/2πfCm |
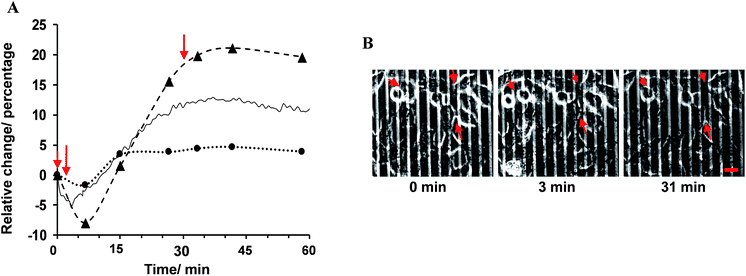
The percentage change in α, Rb and the experimental data with respect to their values before the addition of histamine is expressed herein as the relative change, as shown in Fig. 3A. The results showed that the observed immediate decrease in the experimental impedance was mainly caused by the decrease in cell–cell resistance (t < 4 min). Here, the active surface area of the interdigitated ITO area was 1.3 × 10⁻² cm2. The impedance value calculated from the mathematical model showed that the average Rb value changed from 1.80 ± 0.10 to 2.13 ± 0.12 Ω cm2, while the average α value was altered from 1.68 ± 0.04 to 1.72 ± 0.05 Ω1/2 cm in 25 min after histamine addition compared to the respective values before histamine addition. The α values can be used to extract the morphological cell parameters by approximating the cells as disc-shaped objects according to the following equation:12
| A = rc√(ρ/h) |
The ability to screen live cells in a physiologically relevant context is crucial to acquiring reliable information for drug discovery and development. Therefore, surface chemists have been motivated to engineer substrates to provide a defined expression of immobilized ligands.29 To date, seldom has the effect of surface chemistry been connected with the biological functions of cellular targets in response to soluble cues in real-time. Therefore, in the present study, interdigitated ITO surfaces were modified with various RGD spacings to assess any possible impact of cell adhesive ligand expression on soluble drug-induced cellular responses (Fig. 4). The modification strategy and characterization of the surface are outlined in detail in the Methods section and in the ESI (Fig S7 and S8).† In brief, a plasma-cleaned interdigitated ITO surface was modified with 16-phosphohexadecanoic acid self-assembled monolayers, followed by coupling it to different ratios of 1-aminohexa(ethylene oxide) to 1-aminohexa(ethylene oxide) monomethyl ether molecules. The distal hydroxyl on the 1-aminohexa(ethylene oxide) was then activated and the GRGDS adhesive ligands attached. The RGD spacing on the surfaces was tuned by adjusting the ratio of the two ethylene oxide-based molecules to form a wide range of nanometre to micrometre average RGD spacings on the surfaces. Based on XPS analyses, the GRGDS spacing was estimated to be around 1 nm for the surfaces modified with only 1-aminohexa(ethylene oxide), 41 nm for a ratio of 1![[thin space (1/6-em)]](https://www.rsc.org/images/entities/char_2009.gif) :
:![[thin space (1/6-em)]](https://www.rsc.org/images/entities/char_2009.gif) 103, 970 nm for 1
103, 970 nm for 1![[thin space (1/6-em)]](https://www.rsc.org/images/entities/char_2009.gif) :
:![[thin space (1/6-em)]](https://www.rsc.org/images/entities/char_2009.gif) 106 and 31
106 and 31![[thin space (1/6-em)]](https://www.rsc.org/images/entities/char_2009.gif) 000 nm for a ratio of 1
000 nm for a ratio of 1![[thin space (1/6-em)]](https://www.rsc.org/images/entities/char_2009.gif) :
:![[thin space (1/6-em)]](https://www.rsc.org/images/entities/char_2009.gif) 109 of 1-aminohexa(ethylene oxide) to 1-aminohexa(ethylene oxide) monomethyl ether. The high density of cells on these surfaces were stimulated with 100 μM histamine as the model drug after 3.5 h culturing.
109 of 1-aminohexa(ethylene oxide) to 1-aminohexa(ethylene oxide) monomethyl ether. The high density of cells on these surfaces were stimulated with 100 μM histamine as the model drug after 3.5 h culturing.
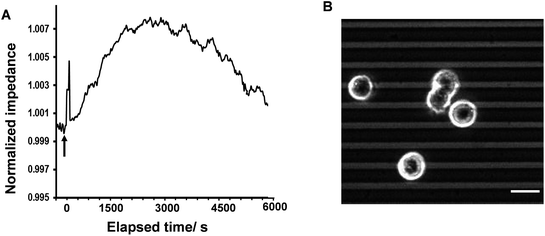
Cells on surfaces modified with 1-aminohexa(ethylene oxide) monomethyl ether in the absence of 1-aminohexa(ethylene oxide), such that no RGD ligands were attached, did not show any reproducible histamine-induced Ca2+ response. Cells on this surface displayed a slight change (less than 1%) in the impedance signal, with no initial immediate decrease upon histamine stimulation (Fig. 5A). The recorded phase-contrast images on this interface indicate that only a limited number of cells were adhered to the surface, and rarely any mature cell–cell contact formed (Fig. 5B). These results further support the conclusions from the fitting of the impedance responses that a decrease in cell–cell adhesion dominates the initial histamine-induced decrease in impedance.
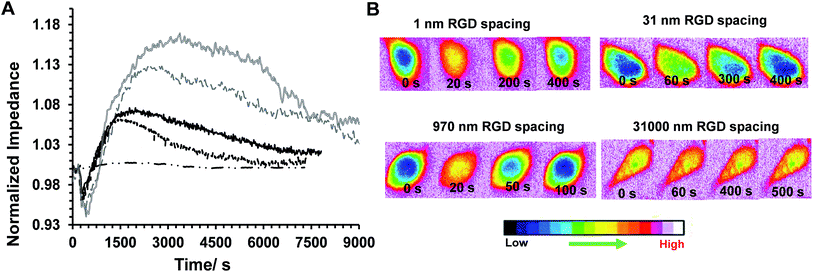
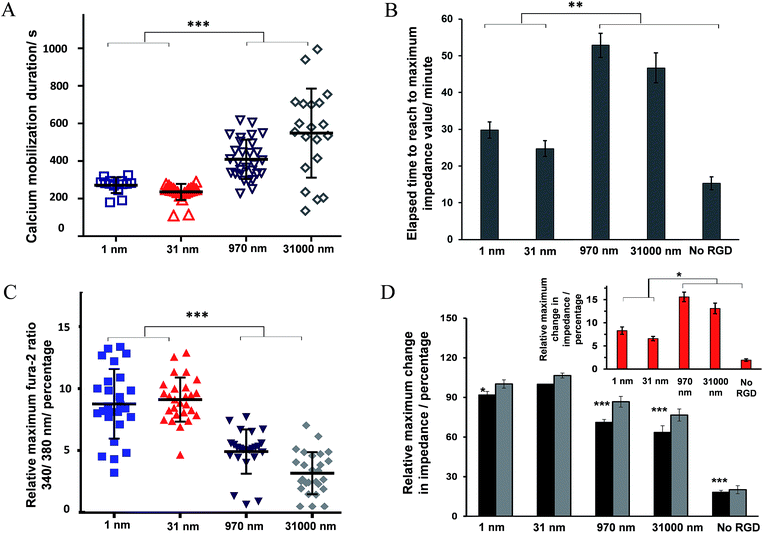
Some examples of the Ca2+ response and impedance signals of the cells on surfaces with different RGD densities are shown in Fig. 6. Simultaneous measurements revealed that the histamine stimulation of cells on the surfaces with an average RGD spacing of 1 or 31 nm led to cytosolic Ca2+ release and impedance changes over shorter durations of time compared with cells on the surfaces with a 970 or 31![[thin space (1/6-em)]](https://www.rsc.org/images/entities/char_2009.gif) 000 nm average ligand spatial distribution (Fig. 6B and 7A). The duration of Ca2+ was calculated based on the time that the Ca2+ signal takes to reach a plateau. In addition, the results indicated that the magnitude of the histamine-induced Ca2+ flux (Fig. 7C) and the impedance response (Fig. 7D) were also sensitive to the spatial expression of the RGD adhesive ligands. Histamine promoted a higher Ca2+ response in cells plated on the surfaces with an RGD spacing of 1 or 31 nm than on the surfaces with an average RGD ligand spacing of 970 or 31
000 nm average ligand spatial distribution (Fig. 6B and 7A). The duration of Ca2+ was calculated based on the time that the Ca2+ signal takes to reach a plateau. In addition, the results indicated that the magnitude of the histamine-induced Ca2+ flux (Fig. 7C) and the impedance response (Fig. 7D) were also sensitive to the spatial expression of the RGD adhesive ligands. Histamine promoted a higher Ca2+ response in cells plated on the surfaces with an RGD spacing of 1 or 31 nm than on the surfaces with an average RGD ligand spacing of 970 or 31![[thin space (1/6-em)]](https://www.rsc.org/images/entities/char_2009.gif) 000 nm.
000 nm.
The inset plot in Fig. 7D shows, for cells on surfaces with an average ligand spacing of 1 or 31 nm, there was a lower relative increase in impedance values upon histamine addition compared with cells on surfaces with an average RGD spacing of 970 or 31![[thin space (1/6-em)]](https://www.rsc.org/images/entities/char_2009.gif) 000 nm. These smaller impedance increases could be attributed to the more robust cell adhesion to these surfaces and to neighbouring cells before stimulation than the surfaces with larger ligand coverage. The higher baseline impedance level of the plated cells confirmed the greater cell adhesion to the surfaces with a 1 or 31 nm average ligand spacing compared with the surfaces with a 970 or 31
000 nm. These smaller impedance increases could be attributed to the more robust cell adhesion to these surfaces and to neighbouring cells before stimulation than the surfaces with larger ligand coverage. The higher baseline impedance level of the plated cells confirmed the greater cell adhesion to the surfaces with a 1 or 31 nm average ligand spacing compared with the surfaces with a 970 or 31![[thin space (1/6-em)]](https://www.rsc.org/images/entities/char_2009.gif) 000 nm average ligand spatial distribution (Fig. 7D, black bars). This is physiologically relevant as an RGD spacing smaller than 70 nm mimics the similar periodic spacing of RGD to that found in fibronectin and collagen, which provide strong cell adhesion points.16 The change in the cell–cell and cell–surface adhesions on histamine addition at different time points on these surfaces is shown in Fig. S9 (ESI†). Note, the timescales of calcium release and the initial decrease in cell–cell adhesion remain consistent, even on surfaces with a different expression of RGD ligands.
000 nm average ligand spatial distribution (Fig. 7D, black bars). This is physiologically relevant as an RGD spacing smaller than 70 nm mimics the similar periodic spacing of RGD to that found in fibronectin and collagen, which provide strong cell adhesion points.16 The change in the cell–cell and cell–surface adhesions on histamine addition at different time points on these surfaces is shown in Fig. S9 (ESI†). Note, the timescales of calcium release and the initial decrease in cell–cell adhesion remain consistent, even on surfaces with a different expression of RGD ligands.
Discussion and conclusion
Overall, the results confirmed the sensitivity of inside-out and outside-in cell signalling in response to model soluble cues to the chemistry of the surface. We speculate that among the possible factors that may participate in regulating agonist-induced Ca2+ mobilization, the morphological state of cells plays an essential role. This is consistent with the findings that show the addition of cytoskeleton disruptors, such as cytochalasin D, contributes to modulating the release of Ca2+ through the formation of signalling complexes that alter the efficiency of the relevant signalling transductions.30,31 We have previously demonstrated that cell morphology is regulated on ITO surfaces with varying the RGD spacing.22 Such biological processes, however, are incredibly complicated as the cytoskeleton and Ca2+ mobilization cross-talk in a bi-directional manner. It has been shown that the rearrangement of cellular actin is Ca2+ dependent.32 On the other hand, these rearrangements are essential for inducing an impedance change. Therefore, the modulation of the Ca2+ elevation of cells, and its timescale, on different surface chemistries could be the reason behind the direct relationship between the time of the calcium-induced fluorescence signal and the duration of the initial decrease in impedance on surfaces with various cell adhesive ligand densities. The duration of the initial decrease in impedance followed by the return to baseline levels upon the addition of histamine was found to correlate well with the duration of Ca2+ elevation on interdigitated ITO surfaces with various RGD spacings. For instance, the surface with an average RGD spacing of 31 nm, which had the shortest fluorescence spike upon histamine addition, showed the most rapid impedance increase and the shortest duration of the initial impedance dip. These results are consistent with the known consequences of outside-in signalling pathways. Recently, we demonstrated15 that endothelial cells on monolayer-modified silicon surfaces with an average RGD spacing of 44 nm display highly ordered focal adhesions and the greatest signal transduction efficiency. That study is particularly relevant to the results presented herein as it is related to cell adhesion and because it showed that a greater outside-in signal transduction resulted in cells migrating more rapidly on those surfaces than on surfaces with other ligand densities upon stimulation with a vascular endothelial growth factor. The relevance with that report is that it showed that for cells to migrate they must reorganize their actin cytoskeleton, as they must here for the cells to spread and alter the impedance. Therefore, in the present study, the outside-in signalling as a result of histamine stimulation causes the calcium mobilization and an immediate decrease in cell–cell contacts due to disruption of the actin. This loss of cell–cell contacts results in an initial decline in impedance, which then appears to allow the cells to spread and the impedance to increase due to the formation of new cell–cell/surface contacts. The direct correlation between the fluorescence signals and this initial decline in impedance on surfaces that express different RGD densities shows that this combined microscopy/impedance approach allows the timescale of these events to be reliably determined. Therefore the set-up detailed herein can be used to provide biological information on correlation of the timescale of various intracellular events and changes in the cell cytoskeleton rearrangement. From a technical perspective, the study shows the importance of controlling the surface chemistry to avoid the risk of misleading information masking the true cellular responses during drug testing. Developing screening tools similar to the simultaneous methodology that is presented herein provides the ability for researchers to carry out the real-time analysis of cellular responses at sub-cellular and whole-cell levels on surfaces designed to provide a well-controlled environment.In summary, we developed a novel approach that combines two powerful techniques for examining cell responses: live fluorescence microscopy and impedance spectroscopy, simultaneously on surfaces with controlled chemistry. This coupling offers a more in-depth view of cellular responses to soluble cues in the presence of the physical attributes of adhesive cues with different timescales. This methodology allows a more comprehensive and reliable evaluation of drugs in vitro.
Acknowledgements
We acknowledge the generous financial support from the Australian Research Council Centre of Excellence in Convergent Bio-Nano Science and Technology (CE140100036; J. J. G. and P. T.), ARC Australian Laureate Fellowship (FL150100060; J. J. G.), ARC Centre of Excellence in Advanced Molecular Imaging (CE140100011; K. G.) and Senior Research Fellowship from the National Health and Medical Research Council of Australia (APP1059278; K. G.). The authors also would like to thank Dr Nima Gholizadeh Doonechaly from the Delft University of Technology for his kind help in writing the MATLAB code for modelling section.References
- A. Venkatakrishnan, X. Deupi, G. Lebon, C. G. Tate, G. F. Schertler and M. M. Babu, Nature, 2013, 494, 185–194 CrossRef CAS PubMed.
- B. P. Zambrowicz and A. T. Sands, Nat. Rev. Drug Discovery, 2003, 2, 38–51 CrossRef CAS PubMed.
- S. R. George, B. F. O'Dowd and S. P. Lee, Nat. Rev. Drug Discovery, 2002, 1, 808–820 CrossRef CAS PubMed.
- Y. Fang, A. G. Frutos and R. Verklereen, Comb. Chem. High Throughput Screening, 2008, 11, 357–369 CrossRef CAS PubMed.
- M. A. Cooper, Nat. Rev. Drug Discovery, 2002, 1, 515–528 CrossRef CAS PubMed.
- B. Xi, N. Yu, X. Wang, X. Xu and Y. Abassi, Biotechnol. J., 2008, 3, 484–495 CrossRef CAS PubMed.
- N. Yu, J. M. Atienza, J. Bernard, S. Blanc, J. Zhu, X. Wang, X. Xu and Y. A. Abassi, Anal. Chem., 2006, 78, 35–43 CrossRef CAS PubMed.
- A. Meunier, O. Jouannot, R. Fulcrand, I. Fanget, M. Bretou, E. Karatekin, S. Arbault, M. Guille, F. Darchen, F. Lemaître and C. Amatore, Angew. Chem., 2011, 123, 5187–5190 CrossRef.
- O. Estrada-Leypon, A. Moya, A. Guimera, G. Gabriel, M. Agut, B. Sanchez and S. Borros, Bioelectrochemistry, 2015, 105, 56–64 CrossRef CAS PubMed.
- C. Hoffmann, G. Gaietta, M. Bünemann, S. R. Adams, S. Oberdorff-Maass, B. Behr, J.-P. Vilardaga, R. Y. Tsien, M. H. Ellisman and M. J. Lohse, Nat. Methods, 2005, 2, 171–176 CrossRef CAS PubMed.
- J. Stolwijk, K. Matrougui, C. Renken and M. Trebak, Eur. J. Appl. Physiol., 2014, 1–26, DOI:10.1007/s00424-014-1674-0.
- I. Giaever and C. R. Keese, Proc. Natl. Acad. Sci. U. S. A., 1991, 88, 7896–7900 CrossRef CAS.
- J. J. Gooding, S. G. Parker, Y. Lu and K. Gaus, Langmuir, 2013, 30, 3290–3302 CrossRef PubMed.
- R. Juliano, Annu. Rev. Pharmacol. Toxicol., 2002, 42, 283–323 CrossRef CAS PubMed.
- G. Le Saux, A. Magenau, K. Gunaratnam, K. A. Kilian, T. Böcking, J. J. Gooding and K. Gaus, Biophys. J., 2011, 101, 764–773 CrossRef CAS PubMed.
- E. A. Cavalcanti-Adam, T. Volberg, A. Micoulet, H. Kessler, B. Geiger and J. P. Spatz, Biophys. J., 2007, 92, 2964–2974 CrossRef CAS PubMed.
- M. Roe, J. Lemasters and B. Herman, Cell Calcium, 1990, 11, 63–73 CrossRef CAS PubMed.
- B. Liu, W. Chen, B. D. Evavold and C. Zhu, Cell, 2014, 157, 357–368 CrossRef CAS PubMed.
- K. L. Prime and G. M. Whitesides, J. Am. Chem. Soc., 1993, 115, 10714–10721 CrossRef CAS.
- E. Ruoslahti, Annu. Rev. Cell Dev. Biol., 1996, 12, 697–715 CrossRef CAS PubMed.
- K. A. Kilian, T. Böcking, K. Gaus, M. Gal and J. J. Gooding, Biomaterials, 2007, 28, 3055–3062 CrossRef CAS PubMed.
- M. Chockalingam, A. Magenau, S. G. Parker, M. Parviz, S. Vivekchand, K. Gaus and J. J. Gooding, Langmuir, 2014, 30, 8509–8515 CrossRef CAS PubMed.
- K. M. L. May, Y. Wang, L. G. Bachas and K. W. Anderson, Anal. Chem., 2004, 76, 4156–4161 CrossRef CAS PubMed.
- B. Aguilar-Maldonado, L. Gómez-Viquez, L. A. García, R. M. Del Angel, J. A. Arias-Montaño and A. N. Guerrero-Hernández, Cell. Signal., 2003, 15, 689–697 CrossRef CAS PubMed.
- I. Giaever and C. R. Keese, Proc. Natl. Acad. Sci. U. S. A., 1993, 90, 1634 CrossRef.
- J. Wegener, A. Hakvoort and H.-J. Galla, Brain Res., 2000, 853, 115–124 CrossRef CAS PubMed.
- A. B. Moy, M. Winter, A. Kamath, K. Blackwell, G. Reyes, I. Giaever, C. Keese and D. Shasby, Am. J. Physiol. Lung Cell. Mol. Physiol., 2000, 278, L888–L898 CAS.
- J. S. Alexander and J. W. Elrod, J. Anat, 2002, 200, 561–574 CrossRef CAS PubMed.
- M. Mrksich, Curr. Opin. Chem. Biol., 2002, 6, 794–797 CrossRef CAS PubMed.
- Y. Wang, M. P. Mattson and K. Furukawa, J. Neurochem., 2002, 82, 945–952 CrossRef CAS PubMed.
- C. M. P. Ribeiro, J. Reece and J. W. Putney, J. Biol. Chem., 1997, 272, 26555–26561 CrossRef CAS PubMed.
- P. A. Janmey, Annu. Rev. Physiol., 1994, 56, 169–191 CrossRef CAS PubMed.
Footnote |
| † Electronic supplementary information (ESI) available: Additional details on the simultaneous setup and mathematical modelling, control experiments on potential dye cytotoxicity, selecting the most sensitive frequency, XPS and electrochemical characterization of the modified surfaces. See DOI: 10.1039/c6sc05159f |
| This journal is © The Royal Society of Chemistry 2017 |

