 Open Access Article
Solvent modified spin crossover in an iron(III) complex: phase changes and an exceptionally wide hysteresis†
Wasinee
Phonsri
 a,
Phimphaka
Harding
 a,
Lujia
Liu
 b,
Shane G.
Telfer
 b,
Keith S.
Murray
 c,
Boujemaa
Moubaraki
c,
Tamsyn M.
Ross
d,
Guy N. L.
Jameson
c,
Boujemaa
Moubaraki
c,
Tamsyn M.
Ross
d,
Guy N. L.
Jameson
 e and
David J.
Harding
 *a
*a
aFunctional Materials and Nanotechnology Centre of Excellence (FuNTech), Walailak University, Thasala, Nakhon Si Thammarat 80160, Thailand. E-mail: hdavid@g-mail.wu.ac.th
bMacDiarmid Institute for Advanced Materials and Nanotechnology, Institute of Fundamental Sciences, Massey University, Palmerston North, New Zealand
cSchool of Chemistry, Monash University, Clayton, Melbourne, Victoria 3800, Australia
dAustralian Synchrotron, 800 Blackburn Rd, Clayton, Victoria 3168, Australia
eDepartment of Chemistry & MacDiarmid Institute for Advanced Materials and Nanotechnology, University of Otago, PO Box 56, Dunedin, 9054, New Zealand
First published on 23rd March 2017
Abstract
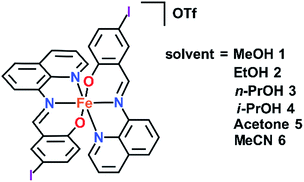
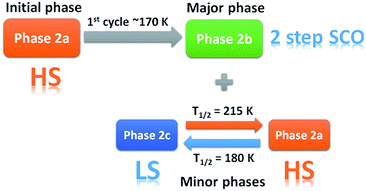
Solvent effects in a series of Fe(III) spin crossover (SCO) complexes [Fe(qsal-I)2]OTf·sol (sol = MeOH 1, EtOH 2, n-PrOH 3, i-PrOH 4, acetone 5 and MeCN 6) are explored. SCO is abrupt in 1 (following MeOH loss) and 2, gradual for 3 (T1/2 = 199 K) and 4 (T1/2 = 251 K) and incomplete, even up to 350 K, for 5 and 6. In [Fe(qsal-I)2]OTf SCO occurs at T1/2↓ = 225 K and T1/2↑ = 234 K (ΔT = 9 K), while aged samples of 2 exhibit an exceptionally wide hysteresis of 80 K (T1/2↓ = 139 K and T1/2↑ = 219 K). In contrast, fresh samples of 2 exhibit stepped SCO with hysteresis varying from 2 to 42 K. VT-PXRD (variable temperature powder X-ray diffraction) studies indicate a new phase, 2b, is formed upon cooling below 180 K along with a minor LS phase 2c. Phase 2c and the HS phase 2a undergo a spin transition at T1/2↓ = 180 K and T1/2↑ = 215 K with phase 2b exhibiting two-step SCO. Structural studies in both spin states, except 6, show the cations are linked through extensive π–π interactions to form 1D chains. A combination of P4AE (parallel fourfold aryl embrace) and I⋯X (X = I, O, π) interactions create tightly packed 3D supramolecular networks. This study emphasizes that while solvent may result in only small structural changes SCO characteristics can be impacted dramatically.
Introduction
Switchable molecules are attractive targets in the design of functional nanomaterials.1–6 In this context spin crossover (SCO) compounds are ideal candidates as they can be switched by a range of stimuli including temperature,7,8 pressure9 and light,10–13 or combinations thereof.14 As molecular compounds they are easy to prepare and readily tunable. In SCO systems the switching occurs between two electronic states termed high spin (HS) and low spin (LS) that are close in energy. This arises from the splitting of the d-orbitals into a t2g and an eg set in an octahedral ligand field and, while theoretically possible for a 3d4–3d7 electronic configuration, is most widely studied for Fe(II).8,15–20 However, more recent research has shown that Fe(III) systems can be just as effective and have the advantage over Fe(II) systems of being air stable.21–23 Moreover, with abrupt hysteretic, symmetry breaking and stepped SCO transitions all reported it is clear that functional devices are becoming a real possibility.Nevertheless, challenges remain as no system yet exists which has a broad hysteresis at room temperature. In designing SCO complexes careful consideration needs to be given to selecting a ligand with a suitable ligand field strength and ensuring that it will form strong supramolecular contacts in the solid state. The latter is needed for the cooperative processes that underlie hysteretic switching.24 In addition to the ligand, SCO behaviour is also influenced by the anion25–32 and the solvent.33–36 The effect of the anion is particularly pronounced as it often completely alters the solid state packing and consequently impacts SCO behaviour. Solvent effects tend to be more subtle but are less well understood as comparatively few studies exist. In the case of Fe(III) there is only one study of solvent effects in the series [Fe(napet)NCS]·sol (napet = 1-[((2-{3-[2-hydroxy-1-naphthyl)methylideneamino]propylamino}ethylimino)methyl]-2-naphthol); sol = tetrahydrofuran, methanol and 0.5 pyrazine, butanone, DMF, DMSO).37
In our continuing studies on Fe(III) complexes of halogenated quinolylsalicylaldimines (qsal-X) we now report the variation of solvent in [Fe(qsal-I)2]OTf·sol (sol = MeOH 1,38 EtOH 2, n-PrOH 3, i-PrOH 4, acetone 5, and MeCN 6). The structures of all these compounds have been determined by single crystal X-ray diffraction and in many cases the structures of both the high and low spin states have been obtained. This rich data set provides insight into how subtle structural changes radically impact magnetic behaviour. In particular, [Fe(qsal-I)2]OTf·EtOH is sensitive to ageing and sample treatment effects. This results in variable stepped SCO profiles with hysteresis up to 80 K. VT-PXRD studies suggest the different SCO profiles are related to a phase change that occurs following the first spin crossover. While such effects are well described in Fe(II) SCO extended framework systems39,40 and order–disorder in Fe(II) SCO monomers41 they are rarely reported in Fe(III).
Results and discussion
Structural overview of [Fe(qsal-I)2]OTf·sol and discussion of Fe(qsal-I)2]OTf·EtOH
The crystal structure of [Fe(qsal-I)2]OTf·MeOH 1, has previously been reported.38 In this work, the crystal structures of [Fe(qsal-I)2]OTf·EtOH 2, [Fe(qsal-I)2]OTf·n-PrOH 3, [Fe(qsal-I)2]OTf·i-PrOH 4, [Fe(qsal-I)2]OTf·acetone 5, and [Fe(qsal-I)2]OTf·MeCN 6 have been determined at two temperatures, with the exception of 6 which lost crystallinity at room temperature. The complex magnetic behaviour of [Fe(qsal-I)2]OTf·EtOH 2 led us to determine the structure at 100, 170, 213 and 292 K. The crystallographic data are summarised in Table S1.† Crystals of 2 are found in phase 2a when prepared at room temperature. Upon cooling below 170 K they shatter explosively due to a phase change to phase 2b producing very small crystallites. Careful searching and use of synchrotron radiation allowed us to obtain the structure at 100 K, phase 2b. Similar mechanical instability has recently been reported for [Fe(5-Br-salEen)2]ClO4 (5-Br-salEen = 4-bromo-2-{[2-(ethylamino)ethylimino]methyl}-phenol). In this case it is associated with a “thermosalient” effect unlike in 2.42 The structures of 1–6 at all temperatures belong to the triclinic space group P![[1 with combining macron]](https://www.rsc.org/images/entities/char_0031_0304.gif) . The asymmetric unit contains one molecule of solvent, an [Fe(qsal-I)2]+ cation and a triflate anion, the first such example in Fe(III) SCO chemistry.
. The asymmetric unit contains one molecule of solvent, an [Fe(qsal-I)2]+ cation and a triflate anion, the first such example in Fe(III) SCO chemistry.
As 2 has the most interesting SCO characteristics we will limit the discussion at this stage to this compound. There is a remarkably anisotropic distortion of the unit cell parameters with b and c shortening by 0.845 and 0.499 Å, respectively from phase 2a at 292 K to phase 2b at 100 K while a lengthens by 0.901 Å. By comparison, the unit cell parameters in [Fe(5-Br-salEen)2]ClO4 exhibit changes of more than 1.0 Å.42 Despite our smaller changes in a, b and c, there is a substantial reduction in the unit cell volume by 6.3%, the largest yet reported for any Fe(III) SCO complex.
The Fe centre in 2 is pseudo-octahedral with two meridionally coordinated qsal-I ligands. The Fe–ligand bond lengths for all the compounds are listed in Table 1. At 100 K the Fe–N/O bond lengths in 2b (average 1.94 Å) are indicative of LS Fe(III).38,43,44 At 213 and 292 K the Fe–N/O bond lengths for phase 2a are characteristic of the HS state (average 2.06 Å at 292 K).38,44 However, at 170 K the bond lengths of phase 2a are a little shorter than at 213 and 292 K indicating the Fe(III) centre is mostly HS but preparing to undergo SCO. SCO results in changes of ΔFe–N = 0.170 Å and ΔFe–O = 0.023 Å and gives the largest overall change in this series.
| 1 -163 K | 1 -293 K | 2b-100 K | 2a-170 K | 2a-213 K | 3-100 K | 3-270 K | 4-163 K | 4-293 K | 5-137 K | 5-293 K | 6-123 K | |
|---|---|---|---|---|---|---|---|---|---|---|---|---|
a Data taken from ref. 38.
b
 , where αi are the twelve cis N/O–Fe–N/O angles.
c , where αi are the twelve cis N/O–Fe–N/O angles.
c
 , where θi are the 24 unique N/O–Fe–N/O angles measured on the projection of two triangular faces of the octahedron along their common pseudo-threefold axis. , where θi are the 24 unique N/O–Fe–N/O angles measured on the projection of two triangular faces of the octahedron along their common pseudo-threefold axis.
|
||||||||||||
| Fe1–O1 | 1.874(8) | 1.906(6) | 1.900(4) | 1.907(3) | 1.919(6) | 1.883(2) | 1.914(3) | 1.887(7) | 1.908(6) | 1.923(6) | 1.935(6) | 1.868(5) |
| Fe1–O2 | 1.878(8) | 1.907(7) | 1.889(4) | 1.908(3) | 1.917(6) | 1.895(2) | 1.922(3) | 1.893(7) | 1.903(6) | 1.915(6) | 1.943(7) | 1.884(5) |
| Fe1–Oav | 1.876(8) | 1.907(7) | 1.895(4) | 1.908(3) | 1.918(6) | 1.889(2) | 1.917(3) | 1.890(7) | 1.906(6) | 1.919(6) | 1.939(7) | 1.876(5) |
| Fe1–N1 | 1.965(9) | 2.096(7) | 1.950(4) | 2.101(3) | 2.102(7) | 1.950(2) | 2.107(3) | 1.945(8) | 2.071(6) | 1.953(8) | 2.074(8) | 1.940(6) |
| Fe1–N2 | 1.939(10) | 2.145(7) | 1.972(5) | 2.139(3) | 2.143(7) | 1.966(3) | 2.129(4) | 1.967(8) | 2.084(6) | 1.977(7) | 2.109(7) | 1.965(6) |
| Fe1–N3 | 2.010(10) | 2.157(8) | 1.939(4) | 2.094(3) | 2.115(7) | 1.966(3) | 2.101(3) | 1.949(8) | 2.067(6) | 1.948(8) | 2.081(8) | 1.937(6) |
| Fe1–N4 | 1.948(9) | 2.098(7) | 1.971(5) | 2.142(4) | 2.152(7) | 1.980(3) | 2.158(4) | 1.961(8) | 2.110(8) | 1.986(8) | 2.121(7) | 1.967(6) |
| Fe1–Nav | 1.966(10) | 2.124(8) | 1.958(5) | 2.119(4) | 2.128(7) | 1.966(3) | 2.124(4) | 1.956(8) | 2.083(8) | 1.966(8) | 2.096(8) | 1.952(6) |
| Σ | 43 | 65 | 44 | 60 | 67 | 47 | 65 | 48 | 54 | 41 | 57 | 47 |
| Θ | 61 | 189 | 71 | 177 | 200 | 69 | 187 | 71 | 153 | 71 | 160 | 69 |
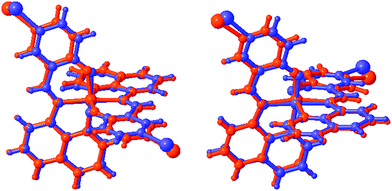
The degree of distortion at the Fe centre, as measured by Σ and Θ,45,46 is ΔΣ (HS-LS) = 23°, while ΔΘ = 129° confirming that complete SCO occurs in 2. Between 170 and 213 K, 2a shows only small changes in the value of ΔΣ and ΔΘ, mirroring our previous findings in 1.38 As with the Fe–ligand bond lengths, the changes in the coordination sphere are more pronounced in 2 than in any other compound in this series as an overlay of the HS and LS structures for 1 and 2 shows in Fig. 1 (for overlays for 3–5 see Fig. S1†). The large change in unit cell volume, noted above, and the coordination sphere are most likely responsible for the large hysteresis in 2 (vide infra).
Magnetic studies of [Fe(qsal-I)2]OTf·EtOH
Magnetic studies of 2 between 50–325 K or 50–350 K indicate that the samples exhibit age and treatment dependent SCO, as shown in Fig. 2. The previously reported magnetic profile of [Fe(qsal-I)2]OTf, formed following MeOH loss from 1, is included for comparison.38 Two types of sample were studied, an aged and a fresh sample. Both samples were prepared by layered diffusion of Hqsal-I and NEt3 in CH2Cl2 and Fe(OTf)3 in EtOH. The difference was that the fresh sample was isolated immediately after crystallization was complete (ca. 3–4 days). In contrast, for the aged sample the crystals were left in the CH2Cl2/EtOH mother liquor for a further 2 weeks. Both samples analyse for one equivalent of EtOH. For the aged sample at 50 K χMT is 0.5 cm3 K mol−1 and indicative of LS Fe(III), Fig. 2b. The χMT value gradually increases upon heating reaching 1.4 cm3 K mol−1 at 235 K. After that there is an abrupt change (T1/2↑ = 252 K) becoming fully HS at 270 K where χMT is 4.42 cm3 K mol−1. In the cooling mode, χMT decreases beginning at ca. 210 K reaching 3.4 cm3 K mol−1 at 170 K before dropping more rapidly to 0.5 cm3 K mol−1 with T1/2↓ = 139 K. This is consistent with the structure at 170 K which exhibits slightly shorter Fe–N/O bond lengths than at 213 K. In the second heating cycle the spin transition shifts to T1/2↑ = 219 K. Upon cooling, SCO again occurs in two steps with the step less pronounced in the second cycle (at 160 K, χMT = 3.26 and 3.72 cm3 K mol−1 in 1st and 2nd cycle, respectively). Subsequent cycles do not alter the magnetic profile of the complex. Thus, the hysteresis of an aged sample of 2 is 80 K, one of the largest values ever reported for any SCO complex.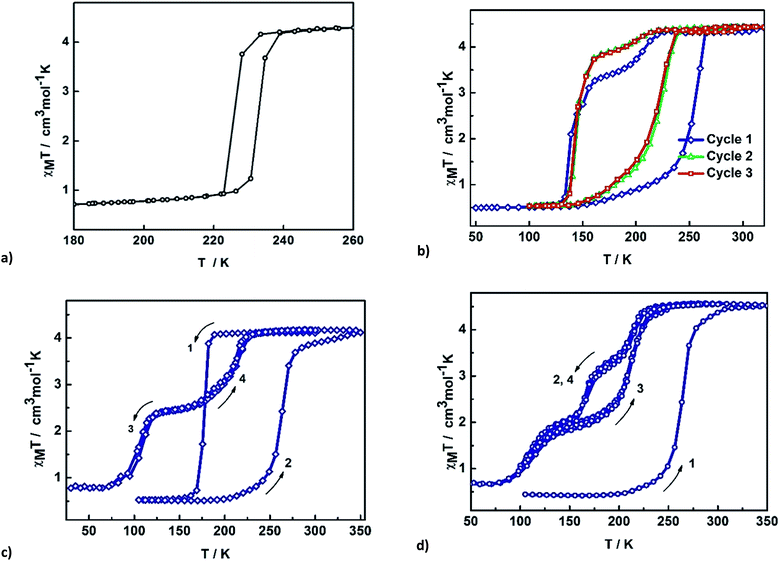 | ||
| Fig. 2 Thermal variation of χMT versus T plot for (a) [Fe(qsal-X)2]OTf, (b) aged EtOH 2, (c) fresh EtOH 2, (d) fresh EtOH 2 after flash cooling. | ||
Two different magnetic measurements were performed on fresh samples of 2. Firstly, the fresh sample was slowly cooled from room temperature. The magnetic plot in Fig. 2c shows an abrupt SCO with T1/2(↓) = 175 K and T1/2(↑) = 270 K in the first cycle. Subsequent cycles reveal two-step SCO with T1/2(↓) = 213 and 103 K with a hysteresis of about 1–2 K at each step leading to an unprecedented plateau width of ca. 110 K at 2.5 cm3 K mol−1 and consistent with 50% HS.
In the second measurement, the sample was first quenched cooled to 100 K (Fig. 2d). Warming slowly the abrupt change at 270 K observed in the first heating cycle of the slow cooled sample is also present here. However, upon cooling the SCO profile has three steps with an extra step appearing at around 175 K with χMT = 3.30 cm3 K mol−1, indicative of 66% HS. The second step occurs at T1/2(↓) = 109 K with χMT = 2.00 cm3 K mol−1 and consistent with 33% HS. In contrast, the heating mode is a two-step SCO process going from the LS to the HS state via 33% HS intermediate, resulting in an open hysteresis loop of ca. 42 K. The complicated SCO plots of 2 and their relationship with the phase changes are explained in the VT-PXRD section.
TGA analysis of 2 shows that it starts to lose EtOH at 353 K with solvent loss complete by 380 K (Fig. S2†). While we cannot absolutely rule out some small degree of solvent loss in fresh samples of 2 we believe that this is minimal as complete removal of EtOH requires heating under vacuum at 100 °C for 1.5 h and even then a cooling and heating cycle is required to give the magnetic profile of [Fe(qsal-I)2]OTf (Fig. S3†). Moreover, samples were sealed with Vaseline which also minimizes solvent loss.
DSC measurements of 2 on a fresh sample shows two peaks in the first cycle, one sharp at 277 K and a broader peak at 173 K with ΔH = 6.7 and 7.0 kJ mol−1 and ΔS = 24 and 40 J mol−1 K−1, respectively (Fig. S4 and S5, Table S2†) closely matching the SCO profile observed in Fig. 2c. These calorimetric values are typical of Fe(III) SCO compounds.21,23 In the following cycles, the peak at 173 K disappears, mirroring the magnetic studies above. VT-PXRD (vide infra) confirms that a phase change takes place at around 170 K. It is noteworthy that there always is a small endothermic peak at 268 K just proceeding the actual SCO possibly associated with some structural pre-organization prior to SCO. In the second cycle, the cooling mode shows only one small peak at 261 K which may correspond to the unusual flexing seen in the VT-PXRD data. The lack of other peaks in the cooling mode may be a due to the small size of the crystallites formed after the first cooling. Similar results have been reported in [Fe(3-bpp)(3-bpp-Ph-OMe)][ClO4]2·1.5-acetone (3-bbp = 2,6-bis{pyrazol-3-yl}pyridine; 3-bpp-Ph-OMe = 2,6-bis{5-(2-methoxyphenyl)pyrazol-3-yl}pyridine)47 and [Fe(3-bpp-Ph-OH)2][ClO4]2·2-acetone·H2O48 (3-bpp-Ph-OH = 2,6-bis{5-(2-hydroxyphenyl)pyrazol-3-yl}-pyridine) which show no peaks in the cooling mode despite exhibiting abrupt SCO.
The magnetic studies reveal that samples of 2 are extremely sensitive to sample preparation and ageing. Elemental analysis confirms that both the fresh and aged samples contain one molecule of EtOH. Ageing effects, although uncommon, have been observed in [Fe(qsal)2]NCS and [Fe(3-bpp-Ph-OH)2][ClO4]2·2THF·H2O and are generally found in hysteretic systems.49,50 As in 2, ageing of both these compounds results in more complete, abrupt and hysteretic SCO.
Mössbauer spectroscopic studies of [Fe(qsal-I)2]OTf·EtOH
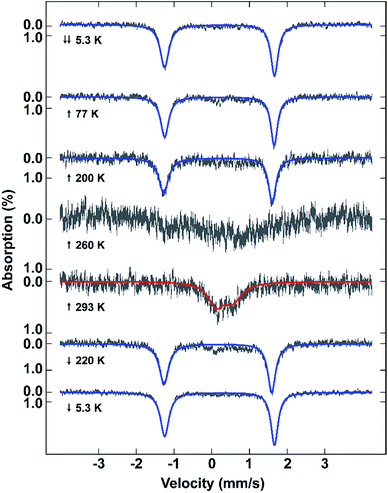
Mössbauer spectroscopy also confirms the different spin states in 2 at different temperatures (Fig. 3). The spectra show that the sample remains LS from 5.3 to 200 K due to the presence of a sharp quadrupole doublet with a wide quadrupole splitting and low isomer shift (Table S3†). By 260 K, although the signal to noise is poor, making fitting of the spectrum impossible, the presence of both HS and LS Fe(III) is visible. At 293 K the sample is fully HS with a broad quadrupole doublet with lower quadrupole splitting and higher isomer shift typical of HS Fe(III). Cooling of the sample reveals a full LS state at 220 K. The difference between the Mössbauer spectroscopic and magnetic data of the fresh sample is probably due to partial solvent loss during the measurement, something previously observed in [Fe(qsal-Br)2]NO3·2MeOH.51VT-PXRD studies of [Fe(qsal-I)2]OTf·EtOH
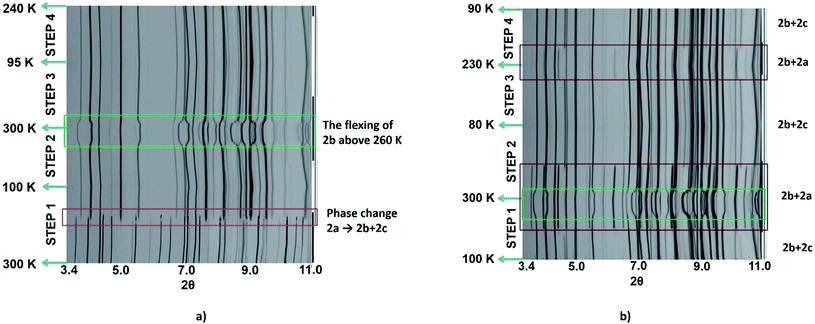
As the magnetic properties of 2 depend greatly on the sample age and treatment, variable temperature powder X-ray diffraction (VT-PXRD) studies of 2, using synchrotron radiation, were used to further probe the phase changes that occur. Two experiments were designed and relate to the magnetic data of a freshly prepared sample (Fig. 2c and d). The first experiment started collecting data at high temperature (dataset A) while the other began to collect data only after quenching the sample to 100 K (dataset B). Details of the experiments are shown in Tables S4 and S5† with Pawley fits in Fig. S6 and S7.† Stacked, interpolated diffraction patterns for dataset A and B are shown in Fig. 4.In the VT-PXRD of dataset A, Fig. 4a, only one phase, that is 2a, is present at 300 K. On cooling down to 180 K (step 1), a majority phase 2b and a minority phase 2c appear while phase 2a gradually disappears, and is completely gone at ca. 164 K. The calculated unit cell parameters from the PXRD patterns of phase 2a and 2b are consistent with the single crystal X-ray data of phases 2a and 2b, respectively (Tables S6 and S7,†vide supra). Unfortunately, attempts to obtain the single crystal X-ray structure of phase 2c which forms upon shattering have been unsuccessful to date. After cooling to 100 K, the sample was then heated to 300 K (step 2) with phase 2b remaining the majority phase with the suggested transformation of 2c into 2a occurring at around 215–220 K. The transformation of 2a → 2c is observed again in the following cooling mode (step 3), at ca. 180 K. The persistence of phase 2b and the transformation of the minority phase of 2c ↔ 2a are repeatable in the following cycles (step 4, Tables S4 and S5†). However, the emergence of the 2b phase from 2a, at ca. 180 K, takes place only once after the first cooling. As phase 2a always exists at high temperature and transforms into phase 2c at low temperature, it suggests that 2a is the HS phase and 2c is the LS phase. The temperature-dependent crystallographic phase change behaviour in 2 is summarized in Fig. 5.
For dataset B, Fig. 4b, the sample was initially quench cooled to 100 K. A mixture of phases 2b (majority) and 2c (minority) coexist at the beginning which contrasts with only phase 2a being present in step 1 of dataset A. In the following cycle (steps 1 and 2), the dominant phase is 2b which always appears together with either 2a (HS phase) or 2c (LS phase). Notably, the phase change temperatures between 2a ↔ 2c in datasets A and B are similar. However, the relatively weaker intensity of phases 2a and 2c in the diffraction patterns of dataset A in comparison to that in dataset B suggest there is a smaller amount of these phases in dataset A. The reason for this behaviour is unclear.
The phase transition from phase 2a to 2b at ca. 180 K, that is observed only in the first cooling (dataset A), is in accordance with the first abrupt spin transition (T1/2 = 175 K) of the magnetic plot shown in Fig. 2c. This also agrees with the peak at 173 K from DSC results that appears distinctly in the first cooling of the experiment. For the heating mode, however, there is no phase change observed in the VT-PXRD data above 260 K where the magnetic plots in Fig. 2c and d show another abrupt SCO (T1/2 = 270 K). There is unusual flexing of phase 2b above 260 K in the VT-PXRD data in both dataset A and B (Fig. 4) and this might be correlated with the abrupt spin change in the magnetic data. For the following cycles, the two step SCO shown in Fig. 2c is believed to be an intrinsic magnetic property of phase 2b.
As previously mentioned, the VT-PXRD results show relatively small amounts of phase 2a and 2c are present in dataset A. These two phases are expected to have minimal contribution to the magnetic plot in Fig. 2c. On the other hand, in dataset B, phases 2a and 2c are more pronounced. Consequently, there is an extra step in the cooling mode of the magnetic plot at T1/2 ≈ 175 K (Fig. 2d) which is in the same region as the phase transition between 2a → 2c. Overall, the VT-PXRD data correlate well with the observed magnetic behaviour of 2.
Magnetic studies of [Fe(qsal-I)2]OTf·sol
The impact of solvent on SCO was investigated by SQUID magnetometry of 3–6. The results are shown in Fig. 6, while the transition temperatures of 1–6 are shown in Table 2. For 3 and 4, the packing as well as the supramolecular interactions are almost identical (vide infra), resulting in very similar gradual but complete SCO. Heating the sample from 150 K, 3 continuously increases reaching a χMT value of 4.0 cm3 K mol−1 at 275 K. For 4 the SCO is slightly more gradual. This might be due to slight alterations in the supramolecular connectivity with P4AE interactions found in 3 while only C–H⋯π interactions are found in 4. The stronger cooperativity in 3 is also believed to be responsible for the lower transition temperature.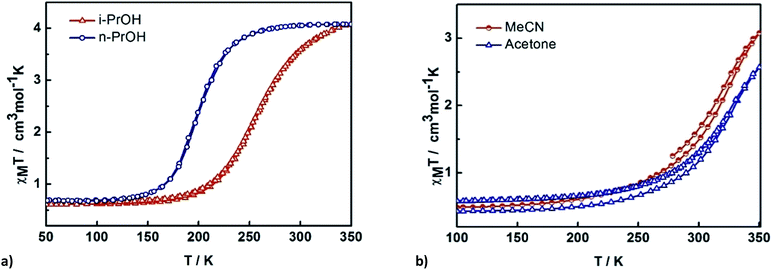 | ||
| Fig. 6 Thermal variation of χMT versus T plot for [Fe(qsal-I)2]OTf·sol where sol are (a) n-PrOH 3 and i-PrOH 4 and (b) acetone 5 and MeCN 6. | ||
In contrast, 5 and 6 show incomplete SCO up to 350 K with a maximum of 70 and 58% HS conversion, respectively. Assuming the SCO is complete at higher temperatures the transition temperature is estimated to be 320–330 K but is rather gradual in both cases, consistent with the lower cooperativity in these compounds.
In this series, it is evident that the alcohols yield more abrupt and complete SCO, presumably due to their ability to hydrogen bond to the anion. However, the other physical properties of the solvents (volume, boiling point, dielectric constant) show no correlation with the abruptness of the SCO or the T1/2 of the compounds. It appears that the solvent subtly alters the supramolecular connectivity in the system and it is this that is responsible for particular magnetic profiles we observe. This is explored in more detail in the following section.
Supramolecular packing in [Fe(qsal-I)2]OTf·sol
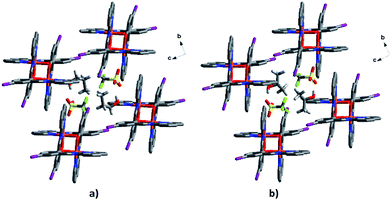
To try to better understand the SCO profiles of the different solvates we now examine the cooperativity in these systems. The packing in 1–6 is similar consisting of 1D chains held together by two sets of π–π interactions involving pairs of qsal-I ligands and is common for [Fe(qsal-X)2]+ complexes;35,38,43,51,52 (Tables 3 and S8–S13†). The first set of π–π interactions (type A) contains triflate embraces (Fig. 7). The second set (type B) is supported by weak C–H⋯O contacts involving the alcohol solvent or C–H⋯N interactions in the case of MeCN. There are also C–H⋯O interactions between the aromatic hydrogens and the coordinated phenoxy oxygen atoms which may influence the ligand field provided by the qsal-I ligands.53| 1 MeOHa | 2 EtOH | 3 n-PrOH | 4 i-PrOH | 5 Acetone | 6 MeCN | |
|---|---|---|---|---|---|---|
| a Data taken from ref. 38. b Low spin (LS), high spin (HS) distances, Δ(HS-LS). c At 293 K. d At 292 K. | ||||||
| In 1D | π–π, I⋯π, C–H⋯O, | π–π, I⋯π, C–H⋯O, | π–π, C–H⋯O | π–π, C–H⋯O/C | π–π, C–H⋯O | π–π, I⋯π, C–H⋯O |
| In 2D | P4AE | P4AE | P4AE | C–H⋯π | P4AE | P4AE |
| In 3D | I⋯I (2a only) | I⋯I | I⋯I | I⋯π | ||
| OTf | C–H⋯O (OTf) | I⋯O (OTf, 2a only) | C–H⋯O (OTf) | C–H⋯O (OTf) | C–H⋯O (OTf) | C–H⋯O (OTf) |
| C–H⋯F (OTf) | C–H⋯O (OTf) | C⋯O (OTf) | C⋯O (OTf) | C–H⋯F (OTf) | C–H⋯F (OTf) | |
| O⋯π (2b only) | C–H⋯F (OTf) | I⋯O (OTf) | I⋯O (OTf) | |||
| I⋯F (OTf) | ||||||
| Solvent | C–H⋯O (MeOH) | C–H⋯I (EtOH) | C–H⋯O (n-PrOH) | C–H (i-PrOH)⋯I | C–H⋯O (acetone) | C–H⋯N (MeCN) |
| C–H⋯O (EtOH) | C–H (n-PrOH)⋯I | C–H (i-PrOH)⋯C | C–H (acetone)⋯I | |||
| C (n-PrOH)⋯I | ||||||
| An–An | F⋯F (HS only) | F⋯F | F⋯F | F⋯F | O⋯F, O⋯S | |
| Anion–sol | O–H⋯O | O–H⋯O | O–H⋯O, C–H⋯F/O | O–H⋯O, C–H⋯F | C–H⋯F | C–H⋯O |
| Intra-chain/Åb | 2.74, 2.03c | 2.72, 2.01d | 3.04, 2.85 | 3.11, 2.86 | 2.74, 2.46 | 2.92 |
| Δ = −0.71 | Δ = −0.71 | Δ = −0.19 | Δ = −0.25 | Δ = −0.28 | ||
| Inter-chain/Åb | 8.63, 8.83c | 8.64, 8.71d | 8.62, 8.82 | 8.81, 9.00 | 7.34, 7.61 | 9.23 |
| Δ = 0.20 | Δ = 0.07 | Δ = 0.20 | Δ = 0.19 | Δ = 0.27 | ||
| Inter-plane/Åb | 12.00, 12.45c | 12.24, 12.91d | 12.23, 12.44 | 12.10, 12.33 | 13.20, 13.48 | 10.99 |
| Δ = 0.45 | Δ = 0.67 | Δ = 0.21 | Δ = 0.23 | Δ = 0.28 | ||
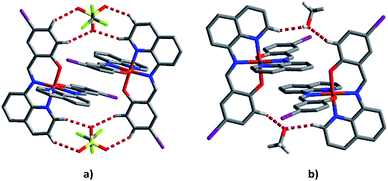 | ||
| Fig. 7 (a) Type A π–π interactions showing the supporting triflate embraces and (b) type B π–π interactions showing the supporting MeOH interactions of compound 1 at 163 K. | ||
Upon SCO (LS to HS) the π–π distances increase by on average 0.10 Å, although there is greater range for the type B interaction probably as this interaction involves the solvent. Interestingly, even though SCO is incomplete in 5 it shows the largest difference in π–π distances; the reason for this is unclear.
The 1D chains are further connected via P4AE (parallel fourfold aryl embrace) interactions54 to create a 2D network. Uniquely for 4, the qsal-I ligands are too offset to form a π–π interaction, and only C–H⋯π interactions are found (Fig. 8, Table S14†). As above the π–π distances lengthen by ca. 0.10 Å upon SCO. The C–H⋯π interactions also increase upon SCO but there appears to be an inverse relationship between the C–H⋯π and π–π interactions with the largest difference for 5 (ca. 0.12 Å, Δπ–π = 0.06 Å) and the smallest for 3 (ca. 0.02 Å, Δπ–π = 0.16 Å).
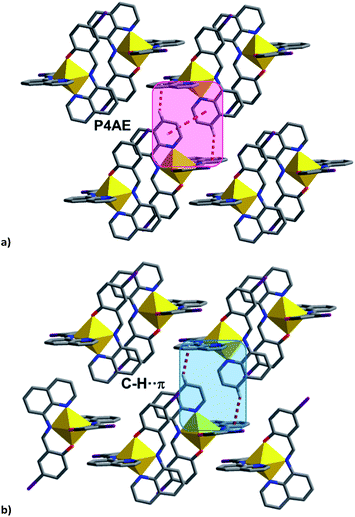 | ||
| Fig. 8 (a) P4AE interactions in most [Fe(qsal-I)2]OTf·sol complexes, (b) C–H⋯π interactions in 4 linking the chains into a plane. | ||
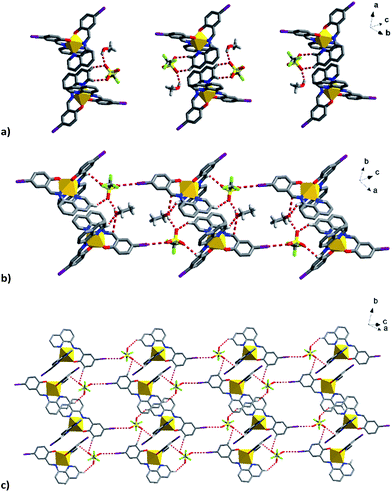 | ||
| Fig. 9 Supramolecular interactions of the solvent and triflate anions in (a) 1, (b) 2a and (c) I⋯O interactions related to triflate in 2a bridging the Fe units into a plane. | ||
In addition to π–π interactions adjacent planes are linked via a weak I⋯I interaction (see Fig. S8,† a I⋯π bond is present in 6). The planes are further linked by weak C–H⋯O and C–H⋯F contacts involving the triflate anions resulting in a quasi-3D network. The supramolecular interactions at 230 K for 1 and 170 K for 2a all show subtle changes, indicative of substantial supramolecular reorganization prior to SCO.
The solvent and triflate interactions for 1–4 are very similar with two alcohol and two triflate anions bound together in a supramolecular circle (see Fig. S9 and Table S15†). The circle is composed of strong alcohol-triflate hydrogen bonds and a F⋯F interaction55–57 between the triflate anions. For 1 the latter is stronger at 293 K (2.867 Å) than it is at 163 K (3.005 Å) while for the other complexes it lengthens at high temperature. In 2 the difference between the HS (phase 2a) and LS (phase 2b) structures is almost 0.2 Å, consistent with the phase change noted above. For 3 and 4, there are also C–H⋯F interactions which are generally weakened by SCO.
In 5 and 6 the solvent and triflate are linked by halogen bonding F⋯O and C–H⋯O interactions, respectively (Fig. S10†). The former are particularly strong being ca. 0.4 Å shorter than the van der Waals radii of F and O. This change in packing compared to 1–4 is probably responsible for the different SCO behaviour of these two solvates.
The triflate–solvent circles in 1 and 2 bridge the Fe cations that interact via π–π interactions as a chain through C–H⋯F/O interactions (Fig. S11†). In 2a the Fe cations interact via P4AE and I⋯O interactions involving the triflate anion linking the Fe units in a plane (Fig. 9). This interaction is lost in the 2b structure following a substantial reorientation of the triflate anion, which results in the formation of a new O⋯π interaction (3.022 Å, Fig. S12†). At the same time, the P4AE π–π interaction becomes more offset with neighbouring 1D chains shifted relative to each other. Similar supramolecular reorganization is found in [Fe(qsal-I)2][Ni(dmit)2]·MeCN·H2O where the loss of I⋯S interactions44 also gives abrupt and hysteretic SCO.
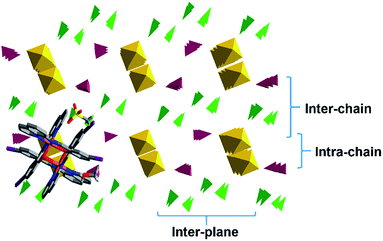
To gain a better understanding of the 3D packing in these compounds simplified polyhedra packing diagrams have been generated viewed down the 1D π–π chains; 1 is shown in Fig. 10 as a representative example, with 2–6 shown in Fig. S13.† We define three parameters: the intra-chain, inter-chain and inter-plane distances, see Fig. 10. Looking at the different diagrams it is evident that the packing is tightest in 1 and 2. There is also a large difference in the intra-chain distance in 1 and 2 of 0.71 Å while 3–5 exhibit much smaller values of 0.28–0.19 Å. 1 and 2 also show the smallest intra-chain distance in the HS state in this series. Moreover, the length of the 1D π–π chain, which is coincident with the b axis in 1, 2 and 5 (the a axis for 3 and 4), shortens most in 1 and 2 following SCO to the LS state. This confirms earlier studies that the 1D π–π chains are vital for SCO34,38,51 and further that large differences between the two spin states will lead to abrupt SCO.58,59
The packing in the propanol solvates, 3 and 4, is almost identical (see Fig. 11), although the intra- and inter-chain distances are slightly shorter in 3 than 4. This is consistent with the magnetic studies where 4 shows slightly more gradual SCO and a higher transition temperature than 3.
The acetone and acetonitrile solvates 5 and 6 show the most obvious gaps in the structure with the largest inter-plane and inter-chain distances in this series. These solvents are also unable to hydrogen bond with the anion and combined with the more open packing results in lower cooperativity. Overall, this analysis reveals that the unique behaviour of 2 appears to be due to unusually tight packing which results in antagonistic interactions that favour a phase change and subsequent stepped SCO. Stepped SCO as a result of tight packing has been reported in [Fe(qsal-Br)2]NO3·2MeOH51 and a number of Hoffmann-type networks including [Fe3II(saltrz)6(MII(CN)4)3]·8H2O {saltrz = 2-(((4H-1,2,4-triazol-4-yl)imino)methyl)-phenol},60 {Fe[(Hg(SCN)3)2](4,4′-bipy)2}n (ref. 61) and [Fe(dpsme)-Pt(CN)4]·2/3dpsme·xEtOH·yH2O (dpsme = 4,4′-di(pyridylthio)-methane).62
Conclusions
In summary, we have for the first time in Fe(III) SCO chemistry prepared a series of complexes that differ only in the lattice solvent, [Fe(qsal-I)2]OTf·sol. We have established that solvent provides a simple and valuable tool for tuning SCO properties with T1/2 varying over nearly 200 K in 1–6. The impact of EtOH is particularly stark with samples of 2 showing ageing and sample treatment effects. VT-PXRD studies of fresh samples show a phase change following the first cooling resulting in two-step SCO with the degree of hysteresis dependent on the amount of the minor phases 2a and 2c present in the sample. In contrast, the aged sample shows a remarkable hysteresis of 80 K, one of the largest values known in SCO chemistry. Surprisingly, the packing in the compounds is very similar and composed of 1D chains of the [Fe(qsal-I)2]+ cations connected by π–π interactions. Additional P4AE and I⋯X (X = I, O, π) interactions combine to form 3D supramolecular networks. Nevertheless, there are subtle differences which result in very different magnetic behaviour with the shortest intra-chain distances and more extensive interactions associated with more abrupt SCO. Indeed, in the case of 2 these interactions may be antagonistic thereby encouraging a phase change and stepped SCO. The startling impact that solvent has on the SCO characteristics of 1–6 should permit the development of solvent specific sensors. Moreover, the findings from this work would be expected to be applicable to other systems and will greatly aid others in the continuing search for SCO switches that operate at room temperature.Experimental
Materials and basic characterisation
Hqsal-I was prepared as described previously.63 All other reagents and solvents were purchased from Sigma-Aldrich Chemical Company or TCI Chemicals and used as received. Elemental analyses were carried out on a Eurovector EA3000 analyser by staff of the School of Chemistry, University of Bristol, UK. ESI-MS were carried out on a Bruker Daltonics 7.0T Apex 4 FTICR Mass Spectrometer by staff at the National University of Singapore. Infrared spectra (as KBr discs) were recorded on a Perkin-Elmer Spectrum One infrared spectrophotometer in the range 400–4000 cm−1.X-ray crystallography
Crystal data and data processing parameters for the structures of 1–6 are given in Table S1.† Crystals were mounted on a glass fibre using perfluoropolyether oil and the sample cooled to the required temperature in a stream of cold nitrogen. The diffraction data of 1, 2 (at 170, 213 and 292 K), 4–6 were collected at 108 and 293 K on a Rigaku Spider diffractometer equipped with a MicroMax MM007 rotating anode generator, Cuα radiation (λ = 1.54178 Å), high-flux Osmic multilayer mirror optics, and a curved image-plate detector. The data were integrated, scaled and averaged with FS Process.64 In the case of 3 data were collected on a Bruker APEXII area detector with graphite monochromated MoKα (λ = 0.71073 Å).65 After data collection, in each case an empirical absorption correction was applied.66 In order to collect data for 2 at 100 K, a small amount of the sample was immersed in perfluoropolyether oil on a glass slide at room temperature, and the slide plunged into liquid nitrogen for up to one minute.The structures were then solved by direct methods and refined on all F2 data using the SHELX suite of programs67 or OLEX2.68 In all cases non-hydrogen atoms were refined with anisotropic thermal parameters; hydrogen atoms were included in calculated positions and refined with isotropic thermal parameters which were ca. 1.2 × (aromatic CH) or 1.5 × (Me, CH2, OH) the equivalent isotropic thermal parameters of their parent carbon atoms. All pictures were generated using either OLEX2 or DIAMOND.69 The CCDC numbers for the X-ray crystallographic data presented in this paper are 1519938 (2b), 1519939 (2a-170 K), 1519940 (2a-213 K), 1519941 (2a-292 K), 1519942 (3-100 K), 1519943 (3-270 K), 1519944 (4-163 K), 1519945 (4-293 K), 1519946 (5-137 K), 1519947 (5-293 K) and 1519948 (6).
Magnetic measurements
Data were collected using a Quantum Design MPMS 5 SQUID magnetometer under an applied field of 1 T over the temperature range 30–350 K for 1, 3–6 and 30–325 K for 2. The powdered or polycrystalline samples were placed in gel capsules and record at a scanning rate of nominally 10 K min−1. However, care was taken to allow long thermal equilibration times at each temperature point such that the real scan rate was far lower. In the case of 2 Vaseline was used for the fresh and aged samples to ensure minimal solvent loss during the measurement.Mössbauer spectroscopic studies
57Fe Mössbauer spectra were recorded on a low field Mössbauer spectrometer from SEE Co. (Science Engineering & Education Co., MN). The sample of 2 was enclosed in Vaseline and rapidly frozen in liquid nitrogen. The sample was then placed in the spectrometer running at 5.3 K. This rapidly quenched sample was then warmed slowly to 77 K, 200 K, 260 K and 293 K. The sample was then slowly cooled to 220 K and finally returned to 5.3 K.Synthesis of [Fe(qsal-I)2]OTf·MeOH, 1
Hqsal-I (154 mg, 0.4 mmol) was dissolved in CH2Cl2 (2 ml) giving an orange solution. NEt3 (56 μl, 0.4 mmol) was added resulting in a change to dark orange. CH3OH (3 ml) was layered on top of the Hqsal-I solution. In a separate flask, FeCl3 (34 mg, 0.2 mmol) was dissolved in MeOH (5 ml) giving a yellow solution and AgOTf (155 mg, 0.6 mmol) added resulting in formation of a white powder (AgCl) which was filtered off. The yellow solution of Fe(OTf)3 was then layered on top of the blank CH3OH and left for 4 days. The black crystals which formed were washed with hexane (2 × 1 ml) and air dried yield 90 mg (47%).![[small nu, Greek, tilde]](https://www.rsc.org/images/entities/i_char_e0e1.gif) max(KBr)/cm−1 3067 (νAr-H), 1600 (νC
max(KBr)/cm−1 3067 (νAr-H), 1600 (νC![[double bond, length as m-dash]](https://www.rsc.org/images/entities/char_e001.gif) N), 1276 (νS–O), 1139 (νC–F), 1030 (νS–O) cm−1. m/z (ESI) 802.0 [Fe(qsal-I)2]+, 149.2 [CF3SO3]−. Elemental analysis: calcd (found) for C34H24F3FeI2N4O6S: C, 41.51 (41.76); H, 2.46 (2.39); N, 5.70 (5.84)%.
N), 1276 (νS–O), 1139 (νC–F), 1030 (νS–O) cm−1. m/z (ESI) 802.0 [Fe(qsal-I)2]+, 149.2 [CF3SO3]−. Elemental analysis: calcd (found) for C34H24F3FeI2N4O6S: C, 41.51 (41.76); H, 2.46 (2.39); N, 5.70 (5.84)%.
The synthesis of the other complexes was achieved in a similar fashion by replacing MeOH with the appropriate solvent, i.e. EtOH, n-PrOH, i-PrOH, acetone and MeCN.
Synthesis of [Fe(qsal-I)2]OTf·EtOH, 2
![[small nu, Greek, circumflex]](https://www.rsc.org/images/entities/i_char_e1dd.gif) max(KBr)/cm−1 3067 (νAr-H), 1600 (νC
max(KBr)/cm−1 3067 (νAr-H), 1600 (νC![[double bond, length as m-dash]](https://www.rsc.org/images/entities/char_e001.gif) N), 1276 (νS–O), 1163 (νC–F), 1030 (νS–O) cm−1. m/z (ESI) 801.9 [Fe(qsal-I)2]+, 149.1 [CF3SO3]−. Elemental analysis: calcd (found) for C35H26F3FeI2N4O6S: C, 42.15 (41.81); H, 2.63 (2.44); N, 5.62 (5.93)%.
N), 1276 (νS–O), 1163 (νC–F), 1030 (νS–O) cm−1. m/z (ESI) 801.9 [Fe(qsal-I)2]+, 149.1 [CF3SO3]−. Elemental analysis: calcd (found) for C35H26F3FeI2N4O6S: C, 42.15 (41.81); H, 2.63 (2.44); N, 5.62 (5.93)%.
Synthesis of [Fe(qsal-I)2]OTf·n-PrOH, 3
Yield 26%.![[small nu, Greek, tilde]](https://www.rsc.org/images/entities/i_char_e0e1.gif) max(KBr)/cm−1 3067 (νAr-H), 1601 (νC
max(KBr)/cm−1 3067 (νAr-H), 1601 (νC![[double bond, length as m-dash]](https://www.rsc.org/images/entities/char_e001.gif) N), 1278 (νS–O), 1159 (νC–F), 1030 (νS–O) cm−1. m/z (ESI) 801.9 [Fe(qsal-I)2]+, 149.1 [CF3SO3]−. Elemental analysis: calcd (found) for C36H28F3FeI2N4O6S: C, 42.75 (41.74); H, 2.79 (2.67); N, 5.54 (5.41)%.
N), 1278 (νS–O), 1159 (νC–F), 1030 (νS–O) cm−1. m/z (ESI) 801.9 [Fe(qsal-I)2]+, 149.1 [CF3SO3]−. Elemental analysis: calcd (found) for C36H28F3FeI2N4O6S: C, 42.75 (41.74); H, 2.79 (2.67); N, 5.54 (5.41)%.
Synthesis of [Fe(qsal-I)2]OTf·i-PrOH, 4
Yield 23%.![[small nu, Greek, tilde]](https://www.rsc.org/images/entities/i_char_e0e1.gif) max(KBr)/cm−1 3067 (νAr-H), 1601 (νC
max(KBr)/cm−1 3067 (νAr-H), 1601 (νC![[double bond, length as m-dash]](https://www.rsc.org/images/entities/char_e001.gif) N), 1278 (νS–O), 1159 (νC–F), 1030 (νS–O) cm−1. m/z (ESI) 801.9 [Fe(qsal-I)2]+, 149.1 [CF3SO3]−. Elemental analysis: calcd (found) for C36H28F3FeI2N4O6S: C, 42.75 (42.37); H, 2.79 (2.84); N, 5.54 (5.26)%.
N), 1278 (νS–O), 1159 (νC–F), 1030 (νS–O) cm−1. m/z (ESI) 801.9 [Fe(qsal-I)2]+, 149.1 [CF3SO3]−. Elemental analysis: calcd (found) for C36H28F3FeI2N4O6S: C, 42.75 (42.37); H, 2.79 (2.84); N, 5.54 (5.26)%.
Synthesis of [Fe(qsal-I)2]OTf·acetone, 5
Yield 20%.![[small nu, Greek, tilde]](https://www.rsc.org/images/entities/i_char_e0e1.gif) max(KBr)/cm−1 3044 (νAr-H), 1596 (νC
max(KBr)/cm−1 3044 (νAr-H), 1596 (νC![[double bond, length as m-dash]](https://www.rsc.org/images/entities/char_e001.gif) N), 1261 (νS–O), 1158 (νC–F), 1060 (νS–O) cm−1. m/z (ESI) 801.9 [Fe(qsal-I)2]+, 149.1 [CF3SO3]−. Elemental analysis: calcd (found) for C36H26F3FeI2N4O6S: C, 42.84 (43.12); H, 2.60 (2.81); N, 5.55 (6.11)%.
N), 1261 (νS–O), 1158 (νC–F), 1060 (νS–O) cm−1. m/z (ESI) 801.9 [Fe(qsal-I)2]+, 149.1 [CF3SO3]−. Elemental analysis: calcd (found) for C36H26F3FeI2N4O6S: C, 42.84 (43.12); H, 2.60 (2.81); N, 5.55 (6.11)%.
Synthesis of [Fe(qsal-I)2]OTf·MeCN, 6
Yield 22%.![[small nu, Greek, tilde]](https://www.rsc.org/images/entities/i_char_e0e1.gif) max(KBr)/cm−1 3047 (νAr-H), 1599 (νC
max(KBr)/cm−1 3047 (νAr-H), 1599 (νC![[double bond, length as m-dash]](https://www.rsc.org/images/entities/char_e001.gif) N), 1299 (νS–O), 1159 (νC–F), 1042 (νS–O) cm−1. m/z (ESI) 801.9 [Fe(qsal-I)2]+, 149.1 [CF3SO3]−. Elemental analysis: calcd (found) for C35H23F3FeI2N5O5S: C, 42.36 (43.62); H, 2.33 (2.54); N, 7.06 (7.17)%.
N), 1299 (νS–O), 1159 (νC–F), 1042 (νS–O) cm−1. m/z (ESI) 801.9 [Fe(qsal-I)2]+, 149.1 [CF3SO3]−. Elemental analysis: calcd (found) for C35H23F3FeI2N5O5S: C, 42.36 (43.62); H, 2.33 (2.54); N, 7.06 (7.17)%.
Acknowledgements
We thank the Thailand Research Fund (Grant No. RSA5580028 and RSA5880048) and the National Science and Technology Development Agency (Grant No. P-10-11181) for funding this research. KSM thanks the Australian Research Council for a Discovery Project grant to support this work. Parts of this research were undertaken on the MX2 and PD beamlines with the help of Dr Helen Brand and Dr Alan Riboldi-Tunnicliffe from the Australian Synchrotron, Victoria, Australia.Notes and references
- Spin-Crossover Materials: Properties and Applications, ed. M. A. Halcrow, John Wiley & Sons, Ltd, Chichester, 2013 Search PubMed.
- R. Klajn, J. F. Stoddart and B. A. Grzybowski, Chem. Soc. Rev., 2010, 39, 2203 RSC.
- M. Natali and S. Giordani, Chem. Soc. Rev., 2012, 41, 4010 RSC.
- M. D. Manrique-Juárez, S. Rat, L. Salmon, G. Molnár, C. M. Quintero, L. Nicu, H. J. Shepherd and A. Bousseksou, Coord. Chem. Rev., 2015, 308, 395–408 CrossRef.
- J. L. Zhang, J. Q. Zhong, J. D. Lin, W. P. Hu, K. Wu, G. Q. Xu, A. T. S. Wee and W. Chen, Chem. Soc. Rev., 2015, 44, 2998–3022 RSC.
- O. Sato, Nat. Chem., 2016, 8, 644–656 CrossRef CAS PubMed.
- K. S. Murray, in Spin-Crossover Materials: Properties and Applications, ed. M. A. Halcrow, John Wiley & Sons Ltd., Chichester, 2013, pp. 1–54 Search PubMed.
- P. Gütlich, A. B. Gaspar and Y. Garcia, Beilstein J. Org. Chem., 2013, 9, 342–391 CrossRef PubMed.
- V. Ksenofontov, A. B. Gaspar and P. Gütlich, Top. Curr. Chem., 2004, 235, 23–64 CrossRef CAS.
- A. Hauser, Top. Curr. Chem., 2004, 234, 155–198 CrossRef CAS.
- J.-F. Létard, J. Mater. Chem., 2006, 16, 2550–2559 RSC.
- J.-F. Létard, P. Guionneau and L. Goux-Capes, Top. Curr. Chem., 2004, 235, 221–249 CrossRef.
- J.-F. Létard, G. Chastanet, P. Guionneau and C. Desplanches, in Spin Crossover Materials: Properties and Applications, ed. M. A. Halcrow, John Wiley & Sons, Ltd, Chichester, 2013, pp. 475–506 Search PubMed.
- M. G. Cowan, J. Olguín, S. Narayanaswamy, J. L. Tallon and S. Brooker, J. Am. Chem. Soc., 2012, 134, 2892–2894 CrossRef CAS PubMed.
- S. Brooker and J. A. Kitchen, Dalton Trans., 2009, 7331–7340 RSC.
- A. B. Gaspar, M. Seredyuk and P. Gütlich, J. Mol. Struct., 2009, 924–926, 9–19 CrossRef CAS.
- M. A. Halcrow, Coord. Chem. Rev., 2009, 253, 2493–2514 CrossRef CAS.
- Y. Sunatsuki, R. Kawamoto, K. Fujita, H. Maruyama, T. Suzuki, H. Ishida, M. Kojima, S. Iijima and N. Matsumoto, Coord. Chem. Rev., 2010, 254, 1871–1881 CrossRef CAS.
- B. Weber, in Spin-Crossover Materials: Properties and Applications, ed. M. A. Halcrow, John Wiley & Sons Ltd., Chichester, 2013, pp. 55–76 Search PubMed.
- G. A. Craig, O. Roubeau and G. Aromí, Coord. Chem. Rev., 2014, 269, 13–31 CrossRef CAS.
- M. Nihei, T. Shiga, Y. Maeda and H. Oshio, Coord. Chem. Rev., 2007, 251, 2606–2621 CrossRef CAS.
- R. Bertoni, M. Lorenc, A. Tissot, M. L. Boillot and E. Collet, Coord. Chem. Rev., 2015, 282–283, 66–76 CrossRef CAS.
- D. J. Harding, P. Harding and W. Phonsri, Coord. Chem. Rev., 2016, 313, 38–61 CrossRef CAS.
- K. S. Murray and C. J. Kepert, Top. Curr. Chem., 2004, 233, 195–228 CrossRef CAS.
- S. Hayami, K. Hiki, T. Kawahara, Y. Maeda, D. Urakami, K. Inoue, M. Ohama, S. Kawata and O. Sato, Chem.–Eur. J., 2009, 15, 3497–3508 CrossRef CAS PubMed.
- D. Sertphon, D. J. Harding, P. Harding, K. S. Murray, B. Moubaraki, J. D. Cashion and H. Adams, Eur. J. Inorg. Chem., 2013, 788–795 CrossRef CAS.
- A. Tissot, P. Fertey, R. Guillot, V. Briois and M.-L. Boillot, Eur. J. Inorg. Chem., 2014, 101–109 CrossRef CAS.
- I. Nemec, R. Herchel, R. Boča, Z. Trávníček, I. Svoboda, H. Fuess and W. Linert, Dalton Trans., 2011, 40, 10090–10099 RSC.
- I. Nemec, R. Herchel, I. Šalitroš, Z. Trávníček, J. Moncol, H. Fuess, M. Ruben and W. Linert, CrystEngComm, 2012, 14, 7015–7024 RSC.
- C. Krüger, P. Augustín, L. Dlháň, J. Pavlik, J. Moncoĺ, I. Nemec, R. Boča and F. Renz, Polyhedron, 2015, 87, 194–201 CrossRef.
- M. Koike, K. Murakami, T. Fujinami, K. Nishi, N. Matsumoto and Y. Sunatsuki, Inorg. Chim. Acta, 2013, 399, 185–192 CrossRef CAS.
- K. Hanahara, H. Ono, T. Fujinami, N. Matsumoto and Y. Sunatsuki, Inorg. Chim. Acta, 2015, 429, 93–98 CrossRef CAS.
- J. C. Dias, B. Vieira, I. C. Santos, L. C. J. Pereira and V. Da Gama, Inorg. Chim. Acta, 2009, 362, 2076–2079 CrossRef CAS.
- D. J. Harding, D. Sertphon, P. Harding, K. S. Murray, B. Moubaraki, J. D. Cashion and H. Adams, Chem.–Eur. J., 2013, 19, 1082–1090 CrossRef CAS PubMed.
- B. J. C. Vieira, J. C. Dias, I. C. Santos, L. C. J. Pereira, V. da Gama and J. C. Waerenborgh, Inorg. Chem., 2015, 54, 1354–1362 CrossRef CAS PubMed.
- T. Shimizu, Y. Komatsu, H. Kamihata, Y. H. Lee, A. Fuyuhiro, S. Iijima and S. Hayami, J. Inclusion Phenom. Macrocyclic Chem., 2011, 71, 363–369 CrossRef CAS.
- I. Nemec, R. Herchel and Z. Trávníček, Dalton Trans., 2015, 44, 4474–4484 RSC.
- D. J. Harding, W. Phonsri, P. Harding, I. A. Gass, K. S. Murray, B. Moubaraki, J. D. Cashion, L. Liu and S. G. Telfer, Chem. Commun., 2013, 49, 6340–6342 RSC.
- G. J. Halder, K. W. Chapman, S. M. Neville, B. Moubaraki, K. S. Murray, J.-F. Létard and C. J. Kepert, J. Am. Chem. Soc., 2008, 130, 17552–17562 CrossRef CAS PubMed.
- P. D. Southon, L. Liu, E. A. Fellows, D. J. Price, G. J. Halder, K. W. Chapman, B. Moubaraki, K. S. Murray, J. F. Létard and C. J. Kepert, J. Am. Chem. Soc., 2009, 131, 10998–11009 CrossRef CAS PubMed.
- T. M. Ross, B. Moubaraki, K. S. Wallwork, S. R. Batten and K. S. Murray, Dalton Trans., 2011, 40, 10147 RSC.
- A. I. Vicente, A. Joseph, L. P. Ferreira, M. de Deus Carvalho, V. H. N. Rodrigues, M. Duttine, H. P. Diogo, M. E. Minas da Piedade, M. J. Calhorda and P. N. Martinho, Chem. Sci., 2016, 7, 4251–4258 RSC.
- W. Phonsri, D. J. Harding, P. Harding, K. S. Murray, B. Moubaraki, I. A. Gass, J. D. Cashion, G. N. L. Jameson and H. Adams, Dalton Trans., 2014, 43, 17509–17518 RSC.
- K. Fukuroi, K. Takahashi, T. Mochida, T. Sakurai, H. Ohta, T. Yamamoto, Y. Einaga and H. Mori, Angew. Chem., Int. Ed., 2014, 53, 1983–1986 CrossRef CAS PubMed.
- J. K. McCusker, A. L. Rheingold and D. N. Hendrickson, Inorg. Chem., 1996, 35, 2100–2112 CrossRef CAS.
- M. Marchivie, P. Guionneau, J. F. Létard and D. Chasseau, Acta Crystallogr., Sect. B: Struct. Sci., 2005, 61, 25–28 CrossRef PubMed.
- G. Aromí, C. M. Beavers, J. Sánchez Costa, G. A. Craig, G. Mínguez Espallargas, A. Orera and O. Roubeau, Chem. Sci., 2016, 7, 2907–2915 RSC.
- G. A. Craig, J. S. Costa, O. Roubeau, S. J. Teat and G. Aromí, Chem.–Eur. J., 2011, 17, 3120–3127 CrossRef CAS PubMed.
- H. Oshio, K. Kitazaki, J. Mishiro, N. Kato and Y. Maeda, J. Chem. Soc., Dalton Trans., 1987, 1341–1347 RSC.
- G. A. Craig, J. S. Costa, O. Roubeau, S. J. Teat and G. Aromí, Eur. J. Inorg. Chem., 2013, 2013, 745–752 CrossRef CAS.
- D. J. Harding, W. Phonsri, P. Harding, K. S. Murray, B. Moubaraki and G. N. L. Jameson, Dalton Trans., 2015, 44, 15079–15082 RSC.
- B. J. C. Vieira, J. T. Coutinho, J. C. Dias, J. C. Nunes, I. C. Santos, L. C. J. Pereira, V. da Gama and J. C. Waerenborgh, Polyhedron, 2015, 85, 643–651 CrossRef CAS.
- O. Iasco, E. Rivie, R. Guillot, M. Buron-Le Cointe, J.-F. Meunier, A. Bousseksou and M.-L. Boillot, Inorg. Chem., 2015, 54, 1791–1799 CrossRef CAS PubMed.
- V. Russell, M. Scudder and I. Dance, J. Chem. Soc., Dalton Trans., 2001, 789–799 RSC.
- K. Reichenbächer, H. I. Süss and J. Hulliger, Chem. Soc. Rev., 2005, 34, 22–30 RSC.
- S. K. Nayak, M. K. Reddy, T. N. G. Row and D. Chopra, Cryst. Growth Des., 2011, 11, 1578–1596 CAS.
- D. Chopra, Cryst. Growth Des., 2012, 12, 541–546 CAS.
- M. A. Halcrow, Chem. Soc. Rev., 2011, 40, 4119–4142 RSC.
- M. A. Halcrow, Chem. Lett., 2014, 43, 1178–1188 CrossRef CAS.
- N. F. Sciortino, K. A. Zenere, M. E. Corrigan, G. J. Halder, G. Chastanet, J.-F. Létard, C. J. Kepert and S. M. Neville, Chem. Sci., 2017, 8, 701–707 RSC.
- E. Trzop, D. Zhang, L. Piñeiro-Lopez, F. J. Valverde-Muñoz, M. Carmen Muñoz, L. Palatinus, L. Guerin, H. Cailleau, J. A. Real and E. Collet, Angew. Chem., Int. Ed., 2016, 55, 8675–8679 CrossRef CAS PubMed.
- N. F. Sciortino, K. R. Scherl-Gruenwald, G. Chastanet, G. J. Halder, K. W. Chapman, J.-F. Létard and C. J. Kepert, Angew. Chem., Int. Ed., 2012, 51, 10154–10158 CrossRef CAS PubMed.
- J. Sirirak, W. Phonsri, D. J. Harding, P. Harding, P. Phommon, W. Chaoprasa, R. M. Hendry, T. M. Roseveare and H. Adams, J. Mol. Struct., 2013, 1036, 439–446 CrossRef CAS.
- Rigaku, Rigaku XRD, Rigaku Corporation, Tokyo, Japan, 1996 Search PubMed.
- Bruker APEXII, Bruker AXS Inc., Madison, WI, USA, 2005 Search PubMed.
- SADABS and SAINT, Bruker AXS Inc., Madison, WI, USA, 2003 Search PubMed.
- G. M. Sheldrick, Acta Crystallogr., 2008, A64, 112–122 CrossRef PubMed.
- O. V. Dolomanov, L. J. Bourhis, R. J. Gildea, J. A. K. Howard and H. Puschmann, J. Appl. Crystallogr., 2009, 42, 339–342 CrossRef CAS.
- K. Brandenberg and H. Putz, DIAMOND, Crystal Impact, Bonn, Germany, 2006 Search PubMed.
Footnote |
| † Electronic supplementary information (ESI) available: Crystallographic details, structural figures, VT-PXRD data and figures, Mössbauer spectroscopic data, DSC and TGA results. CCDC 1519938–1519948. For ESI and crystallographic data in CIF or other electronic format see DOI: 10.1039/c6sc05317c |
| This journal is © The Royal Society of Chemistry 2017 |

