 Open Access Article
Multifunctional mixed-metal nanoscale coordination polymers for triple-modality imaging-guided photodynamic therapy†
Yong-Mei
Wang
a,
Wei
Liu
a and
Xue-Bo
Yin
 *ab
*ab
aState Key Laboratory of Medicinal Chemical Biology, Tianjin Key Laboratory of Biosensing and Molecular Recognition, College of Chemistry, Nankai University, Tianjin, 300071, China. E-mail: xbyin@nankai.edu.cn; Fax: +86-22-23503034
bCollaborative Innovation Center of Chemical Science and Engineering (Tianjin), Nankai University, Tianjin, 300071, China
First published on 10th March 2017
Abstract
The one-step self-assembly preparation of multifunctional gadolinium (Gd)–ytterbium (Yb) mixed-metal nanoscale coordination polymers (NCPs) with Ru[4,4′-(COOH)2bpy]32+ (LRu, bpy = bipyridyl) as a ligand is reported. The Gd/Yb ratio in the NCPs is easily tuned by their ratio in the precursors while the self-limiting growth is realized with the high coordination valence and rigid steric structure of the precursors. The inherent properties of the precursors, including the magnetic resonance (MR) response of Gd3+, the X-ray attenuation properties of Yb3+, and the red fluorescence and the singlet-oxygen generation of LRu, are well retained in the mixed-metal NCPs. In vivo fluorescence-MR-X-ray computed tomography (CT), triple-modality imaging and photodynamic therapy (PDT) are achieved using the mixed-metal NCPs as a probe. The triple-modality imaging integrates the high sensitivity of red fluorescence imaging, the deep penetration of MR imaging, and the 3D spatial resolution of CT imaging, thus providing comprehensive and complementary imaging information and facilitating the efficient imaging-guided PDT. For the first time, triple-modality imaging and a PDT agent were prepared with an easy and robust procedure, a tunable mixed-metal ratio, a high yield, and endogenous signal units.
Introduction
Noninvasive diagnostic and therapeutic methods are extensively studied for clinical applications.1,2 As an imaging diagnostic strategy, a perfect imaging modality should provide anatomical, physiological, and molecular information.1,2 The absence of such a modality drives the development of multimodality imaging, which has become a hot topic and has led to the development of imaging technology.3 If the imaging information is used to guide therapy as imaging-guided noninvasive therapy, the distribution and evolution of tumor/drug could be seen with time- and position-resolved modes, while the therapeutic efficiency and safety are also improved. Quantum dots and inorganic nanoparticles have been designed for multimodality imaging through the integration of various imaging modalities but they suffer from high biological toxicity and complicated preparation procedures.3 The development of novel multimodality imaging-guided therapy platforms is still a long-lasting aspiration for scientists and clinicians.One important requirement for imaging-guided therapy is the design of a matrix with a high degree of function integration. Coordination polymers (CPs) are hybrid materials constructed from metal ions and polydentate ligands.4 CPs show a high degree of function integration and tunable composition, size, and shape and are therefore used extensively for gas adsorption and storage, separation, catalysis, and nonlinear optics.1,2,5,6 The above merits also make CPs attractive for multiple bioapplications, such as for the early diagnosis of cancer, phototherapy,7 drug delivery, and even imaging-guided therapy, by the integration of response-triggered functions into CPs.8–10
Functional building blocks should be selected to build CPs for the purpose of diagnosis and therapy. Gd3+ ions have a long electronic relaxation time, enabling high magnetic resonance (MR) imaging contrast efficiency.10,11 Ytterbium (Yb) is a high-Z element, providing high X-ray attenuation and is an efficient X-ray computed tomography (CT) contrast agent.12 Unlike small-molecule ligands, chelating ligands have extraordinary structures and functions, tunable denticities and charges, so they are attractive for building CPs.6,13,14 [Ru(bpy)3]2+ (bpy = bipyridyl) and its derivatives have favorable photophysical properties and have been used as optical imaging agents and sensing matrices.2,14,15 Post-synthesis procedures and the control of the precursor ratio and/or the reaction conditions are often used to prepare mixed-metal CPs for multi-functionality.16 The development of simple methods to integrate the functional building blocks together and to obtain multifunctional CPs is still a challenge.
Scaling down the size of CPs to the nanoscale is also important for their bio-transfer. Pioneering nanoscale CPs (NCPs) have been prepared by nanoprecipitation, microemulsion, and surfactant-template methods.17,18 These methods are complicated and are influenced greatly by the precursor ratio and the reaction conditions. Simple procedures, including using fewer additives, robust synthesis routes, and using ordinary solvent systems, are greatly desired for efficient fabrication of multifunctional NCPs.
Herein we report multifunctional ratio-tunable Gd/Yb mixed-metal NCPs prepared by hydrothermal treatment of the mixture of Gd3+, Yb3+, and Ru(II)[4,4′-(COOH)2bpy]3·Cl2 (LRu). Sexadentate LRu coordinates with nine-coordinate Gd3+ and Yb3+ directly to form NCPs (Scheme 1). The size and morphology of the NCPs are controlled by the high coordination valence and rigid steric structure of the precursors. Instead of nanoprecipitation, microemulsion, and surfactant-template methods,17,18 the high coordination valence of the building blocks, as an inherent property, is used to prepare the NCPs through a simple self-limiting growth procedure. The similar size and coordination valence of Gd3+ and Yb3+ offer the possibility to build mixed-metal NCPs and the Gd/Yb ratio in the NCPs is easily tuned by their ratio in the precursors. The properties of the precursors are well retained, so excellent MR, fluorescence, and CT responses are observed from the mixed-metal NCPs. In combination with their high photodynamic therapy (PDT) efficiency, the multifunctional mixed-metal NCPs with a simple and robust synthesis procedure, tunable mixed-metal ratio, high yield, and endogenous signal units are successfully used as fluorescence-MR-CT triple-modality imaging contrast and PDT agents.
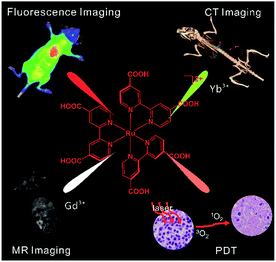 | ||
| Scheme 1 The construction of multifunctional mixed metal NCPs with ligand LRu, Gd3+ and Yb3+ for fluorescence-MR-CT triple modality imaging guided therapy. | ||
Results and discussion
Synthesis of the mixed-metal NCPs
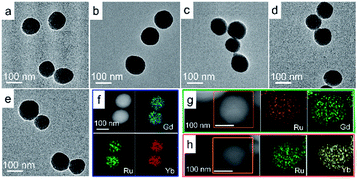
The red fluorescence of [Ru(bpy)3]2+, the high MR contrast of Gd3+ ions, and the high X-ray attenuation of Yb3+ are attractive features for the development of multimodality imaging probes.10–12LRu was reacted with Gd3+ ions by a microemulsion method to prepare NCPs. However, the morphology and size of the NCPs were almost unaffected by the surfactant content. Uniform Gd–Ru NCP spheres were obtained by heating the mixture of LRu and Gd3+ ions in a DMF/H2O system without any auxiliary ligand or surfactant (Fig. 1a). Unsurprisingly, the Yb–Ru NCPs showed a similar spherical structure because Yb3+ and Gd3+ have a similar diameter and coordination valence (Fig. 1b).If Gd3+ and Yb3+ are reacted with LRu, mixed-metal NCPs should integrate the function of the metal ions into single NCPs. The mixed-metal NCPs fabricated with different Gd3+/Yb3+ ratios possessed similar morphologies (Fig. 1c–e and S1†). The NCP spheres were all ca. 130 nm in diameter (Fig. 1a–e and S2†). Their energy-dispersive X-ray (EDX) and Energy Dispersive Spectrometer (EDS) elemental mapping data clearly illustrated that ruthenium, gadolinium, and ytterbium were successfully integrated into the NCPs (Fig. 1f–h and S3†). Meanwhile, infrared spectroscopy demonstrated the coordination of –COOH to Gd3+ or Yb3+ (Fig. S4†). X-ray photoelectron spectroscopy (XPS) patterns further revealed that ruthenium, gadolinium, and ytterbium were successfully observed. However, no chloride was found (Fig. S5†), so chloride ions did not exist in the NCPs even though they are the equilibrium ions of LRu, Gd3+, and Yb3+. We considered that the carboxyl groups in LRu were deprotonated in order to coordinate with Gd3+ and/or Yb3+ ions and also balanced the positive Ru2+, Gd3+, and/or Yb3+ ions to form the NCPs as a charge self-balancing system. Thus, the Gd/Yb mixed-metal NCPs were successfully prepared by a simple hydrothermal procedure.
We found the morphology and size of the NCPs were unchanged at the reaction temperatures of 100 and 160 °C for 1–6 h (Fig. S6†). The mild conditions of 100 °C and 2 h were therefore selected to prepare the single- and mixed-metal NCPs with high efficiency; a yield higher than 85% for all the NCPs was achieved (Fig. S7†). This is a simple, robust hydrothermal procedure to prepare Gd/Yb mixed-metal NCPs with a high yield and without any auxiliary ligand or surfactant.
Self-limiting growth mechanism
The reaction temperature and time had a negligible influence on the NCP formation and uniform NCP spheres were obtained with single- or mixed-Gd3+/Yb3+ and LRu. These merits inspired us to investigate the role of the precursors in the formation of NCPs. Other CPs were prepared with LRu and Fe2+, Zn2+, or Mn2+, as well as Gd3+ and tetradentate [Ru(II)(4,4′-COOH-bpy)2bpy]. However, all of these products showed an inhomogeneous morphology (Fig. S8†). The above ligands have a coordination number of no more than four, and that of the above metal nodes is less than eight.4LRu is a sexadentate ligand, while Gd3+ and Yb3+ are nine-coordinate, so their inherent high coordination valences provide an alternative strategy to prepare the mixed-metal NCPs.A self-limiting growth mechanism was then proposed for the NCPs considering their rigid steric structure and the multidentate nature of their building blocks. Separated crystal islands were found in the high-resolution TEM image of the NCPs (Fig. S9†). LRu coordinates with Gd3+ and/or Yb3+ ions to form a crystalline structure in a small region—a crystal island because the rigid structure of LRu sterically hinders its further coordination to Gd3+. The small crystal islands connect to each other and the epitaxial growth of the NCPs stops with a self-limited size and spherical structure. The high coordination valences of sexadentate LRu and nine-coordinate Gd3+/Yb3+are the key to this self-limiting phenomenon as corroborated by the formation of other CPs. The charge self-balance of this system, indicated by XPS results, was also one of the driving forces for the self-limiting growth of the NCPs. Their powder X-ray diffraction patterns illustrated the same reflection peak angles despite the different Gd/Yb ratios in the NCPs with an overall amorphous structure (Fig. S10†).
Composition of the mixed-metal NCPs
We found that the Gd/Yb ratio in the NCPs agreed well with the ratio in the precursors obtained from the inductively coupled plasma-atomic emission spectrometry (ICP-AES) results (Table S1†). Thermogravimetric analysis (TGA) indicated a similar weight-loss trend for all of the NCPs, including the loss of solvents and bipyridine, and also residual Gd2O3, Yb2O3, and Ru2O3 (Fig. S11†). Overall, the TGA, ICP-AES, and elemental analysis results revealed that the formulas of the NCPs with the Gd/Yb ratios of 3![[thin space (1/6-em)]](https://www.rsc.org/images/entities/char_2009.gif) :
:![[thin space (1/6-em)]](https://www.rsc.org/images/entities/char_2009.gif) 0, 2
0, 2![[thin space (1/6-em)]](https://www.rsc.org/images/entities/char_2009.gif) :
:![[thin space (1/6-em)]](https://www.rsc.org/images/entities/char_2009.gif) 1, 1
1, 1![[thin space (1/6-em)]](https://www.rsc.org/images/entities/char_2009.gif) :
:![[thin space (1/6-em)]](https://www.rsc.org/images/entities/char_2009.gif) 1, 1
1, 1![[thin space (1/6-em)]](https://www.rsc.org/images/entities/char_2009.gif) :
:![[thin space (1/6-em)]](https://www.rsc.org/images/entities/char_2009.gif) 2, and 0
2, and 0![[thin space (1/6-em)]](https://www.rsc.org/images/entities/char_2009.gif) :
:![[thin space (1/6-em)]](https://www.rsc.org/images/entities/char_2009.gif) 3 were LRuGd1.3·7H2O, LRuGd0.85Yb0.45·7H2O, LRuGd0.65Yb0.65·7H2O, LRuGd0.45Yb0.85·7H2O, and LRuYb1.3·7H2O, respectively (Table S2†). These formulas validate that the NCPs are charge self-balancing systems, where six negative charges from the –COO− groups in LRu balance with the two positive charges of Ru2+ and the four positive charges of 1.3 Gd3+ and/or Yb3+. Moreover, the controllable synthesis of the mixed-metal NCPs was also confirmed by the formulas with the simple selection of their precursor ratio.
3 were LRuGd1.3·7H2O, LRuGd0.85Yb0.45·7H2O, LRuGd0.65Yb0.65·7H2O, LRuGd0.45Yb0.85·7H2O, and LRuYb1.3·7H2O, respectively (Table S2†). These formulas validate that the NCPs are charge self-balancing systems, where six negative charges from the –COO− groups in LRu balance with the two positive charges of Ru2+ and the four positive charges of 1.3 Gd3+ and/or Yb3+. Moreover, the controllable synthesis of the mixed-metal NCPs was also confirmed by the formulas with the simple selection of their precursor ratio.
Optical, MR, and CT properties of the NCPs
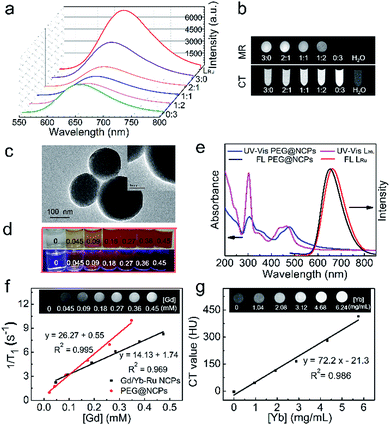
The optical properties of the NCPs were investigated and compared with those of LRu. Both the UV-vis absorption and fluorescence emission of the mixed-metal NCPs resemble those of LRu (Fig. 2a and S12†); a broad absorption around 480 nm and a strong red fluorescence at 655 nm were both observed. These results demonstrate that the optical properties of LRu are retained well in the NCPs. The red emission of the NCPs dominates in the biological transparent window;19 the obvious advantage is avoiding and circumventing the disturbance from auto-fluorescence and scattering light of tissue to realize low-background imaging.Longitudinal relaxation time (T1)-weighted MR images of the mixed-metal NCPs with different Gd/Yb ratios were recorded to validate their MR efficiency (Fig. 2b). The MR signal decreased with the decreasing ratio of Gd and the single-Yb NCPs showed the lowest relaxivity efficiency, the same as that of pure water. To evaluate the CT contrast efficiency of the NCPs, their X-ray attenuation ability was measured. The brightness of the images increased with the Yb ratio (Fig. 2b). Meanwhile, as Gd is also a high Z-element, Gd3+ partly contributed to the CT imaging, as shown in the CT image of the single-Gd NCPs. The results validated the successful preparation of the multifunctional mixed-metal NCPs and the properties of the precursors were well maintained.
In vitro fluorescence, MR, and CT imaging properties of Gd/Yb–Ru NCPs (1![[thin space (1/6-em)]](https://www.rsc.org/images/entities/h3_char_2009.gif) :
:![[thin space (1/6-em)]](https://www.rsc.org/images/entities/h3_char_2009.gif) 2)
2)
Considering that the CT imaging efficiency is dependent on the Yb concentration, we investigated the potential of triple-modality imaging using the NCPs with the Gd/Yb ratio of 1![[thin space (1/6-em)]](https://www.rsc.org/images/entities/char_2009.gif) :
:![[thin space (1/6-em)]](https://www.rsc.org/images/entities/char_2009.gif) 2. Polyethylene glycol (PEG) was used to improve the stability, increase blood circulation time, and enhance the biocompatibility of the NCPs.7 A 15 nm PEG coating layer was clearly observed around the NCP spheres with the grafting content of PEG being about 13% (Fig. 2c and S13†). The PEG@NCPs were well dispersed with concentration-dependent red emission (Fig. 2d). Blue-shifted emission was observed from the PEG@NCPs, while their absorption decreased compared with that of the bare NCPs, especially at 320 nm (Fig. 2e). The difference in the absorption and fluorescence spectra results from the energy transfer between bridged LRu and Gd3+ or Yb3+, but the red emission of the NCPs was well retained. Thus, the PEGylation did not interfere with the optical properties of the NCPs.
2. Polyethylene glycol (PEG) was used to improve the stability, increase blood circulation time, and enhance the biocompatibility of the NCPs.7 A 15 nm PEG coating layer was clearly observed around the NCP spheres with the grafting content of PEG being about 13% (Fig. 2c and S13†). The PEG@NCPs were well dispersed with concentration-dependent red emission (Fig. 2d). Blue-shifted emission was observed from the PEG@NCPs, while their absorption decreased compared with that of the bare NCPs, especially at 320 nm (Fig. 2e). The difference in the absorption and fluorescence spectra results from the energy transfer between bridged LRu and Gd3+ or Yb3+, but the red emission of the NCPs was well retained. Thus, the PEGylation did not interfere with the optical properties of the NCPs.
The in vitro longitudinal relaxivity of the PEG@NCPs was evaluated to validate their MR imaging potential with their T1 value at different concentrations. The calculated r1 relaxivity was 26.27 mM−1 s−1, which was almost twice that of the Gd/Yb–Ru NCPs (1![[thin space (1/6-em)]](https://www.rsc.org/images/entities/char_2009.gif) :
:![[thin space (1/6-em)]](https://www.rsc.org/images/entities/char_2009.gif) 2), and seven times that of Gd-DTPA (r1 = 3.69 mM−1 s−1).12 This result was validated with MR images (inset of Fig. 2f). Thus, PEG improved the stability and solubility of the NCPs, and their hydrophilicity also enhanced their MR response. The CT imaging potential of the PEG@NCPs was validated by the remarkable signal enhancement as the Yb concentration increased (Fig. 2g). The slope of the CT value vs. Yb concentration plot was 72.2 HU L g−1, 2.3 times that of the CT contrast agent iohexol (31.1 HU L g−1).20 Thus, the PEG@NCPs could be used as a contrast agent for fluorescence, MR, and CT triple-modality imaging.
2), and seven times that of Gd-DTPA (r1 = 3.69 mM−1 s−1).12 This result was validated with MR images (inset of Fig. 2f). Thus, PEG improved the stability and solubility of the NCPs, and their hydrophilicity also enhanced their MR response. The CT imaging potential of the PEG@NCPs was validated by the remarkable signal enhancement as the Yb concentration increased (Fig. 2g). The slope of the CT value vs. Yb concentration plot was 72.2 HU L g−1, 2.3 times that of the CT contrast agent iohexol (31.1 HU L g−1).20 Thus, the PEG@NCPs could be used as a contrast agent for fluorescence, MR, and CT triple-modality imaging.
Stability and biotoxicity of PEG@NCPs
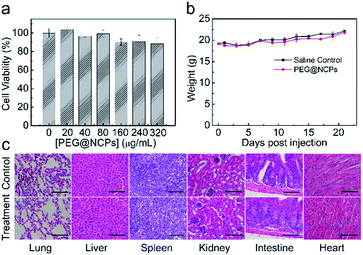
The stability of the PEG@NCPs was tested to validate their practicability. After soaking in 10% fetal bovine serum at 37 °C, the size and morphology of the PEG@NCPs remained unchanged over 24 h, as shown by TEM studies (Fig. S14†), thus illustrating their chemical stability. The cytotoxicity of the PEG@NCPs was tested to evaluate their biocompatibility with the standard methyl thiazolyl tetrazolium (MTT) assay and recorded as the viability of HepG2 cells. The cell viability was higher than 85% at 320 μg mL−1 PEG@NCPs (Fig. 3a).The long-term biotoxicity of the PEG@NCPs was evaluated by monitoring the body weight trend of mice after intravenous injection with the PEG@NCPs. The same weight trend was observed for the PEG@NCP-treated mice to that of the saline-injected mice over three weeks (Fig. 3b). Meanwhile, no sign of illness or activity change was observed from the mice. Histological assessment was conducted to test tissue damage or inflammation caused by the PEG@NCPs. No noticeable organ damage or inflammatory lesions were detected in the lung, liver, spleen, kidney, intestine, or heart of the PEG@NCP-treated mice (Fig. 3c). Thus, the PEG@NCPs showed high chemical stability, negligible cytotoxicity, and high biocompatibility, making them attractive for clinical applications.
In vivo fluorescence, MR, and CT imaging and biodistribution of PEG@NCPs
The triple-modality imaging potential of the PEG@NCPs was tested using the intravenously-injected mice as a model. The liver showed a 15.7-fold signal enhancement in its fluorescence imaging because of the high sensitivity of the red fluorescence. MR and CT imaging showed signal enhancements of 33% and 64% in the liver 30 min after injection, respectively (Fig. 4). MR imaging also revealed an 88% signal enhancement in the kidney, while the abdominal aorta was clearly observed in other scan layers because of the high spatial resolution of the MR imaging (Fig. S15†). The enhanced fluorescence, MR, and CT contrast signals in the liver and kidney suggested that the PEG@NCPs were accumulated by the reticuloendothelial system and excreted through the urinary system. Therefore, the PEG@NCPs are promising as a triple-modality imaging contrast agent that circulates through the blood with metabolism by both the liver and kidney.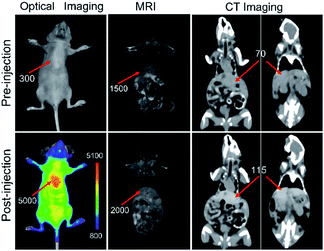 | ||
| Fig. 4 In vivo fluorescence, MR, and CT triple-modality imaging of mice injected with the PEG@NCPs. The red arrows indicate the liver. | ||
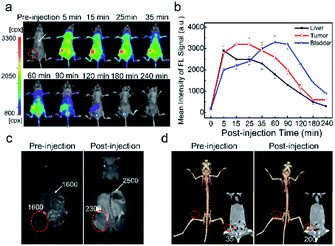
The PEG@NCPs were further traced by fluorescence imaging to illustrate their absorption, distribution, metabolism, and excretion (ADME) processes in mice (Fig. S16†). An intense signal was detected in the liver after 5 min and increased until 30 min post-injection. Thus, the PEG@NCPs first accumulated in the liver and then entered the bladder, which became the brightest part of the mouse from 60 to 180 min. The PEG@NCPs were then excreted through the urethra after 180 min post-injection. The metabolic time of the PEG@NCPs is slower than that of a molecular probe but faster than that of some nanoparticles, thus showing the bioapplication of the PEG@NCPs.21 To confirm the in vivo tissue distribution results of the PEG@NCPs, blood samples and the major organs of the injected mice were separately collected and their Yb content was quantified (Fig. S17†). A high Yb level was observed in the liver, consistent with that from the triple-modality imaging results.
Triple-modality imaging of tumor-bearing mice with PEG@NCPs as a probe
The triple-modality images of HepG2 tumor-bearing mice were recorded using the PEG@NCPs as a probe to demonstrate their tumor imaging and imaging-guided therapy capacity. A fluorescence signal of the PEG@NCPs appeared at the tumor site and at the liver of the mice because of the enhanced permeability and retention (EPR) effect (Fig. 5a). The tumors were readily distinguished from surrounding tissues and the fluorescence intensity was maintained for 60 min (Fig. 5b). A 44% MR signal enhancement was observed at the tumor site 30 min after the PEG@NCP injection (Fig. 5c). A positive CT signal with a 4.7-fold enhancement at the tumor site was observed (Fig. 5d). Thus, the tumor was clearly visualized with the triple-modality images, despite being acquired through intact skin and the skull. Passive tumor targeting was validated by the fluorescence images of the dissected tumor (Fig. S18†). The high fluorescence sensitivity, the high spatial resolution of the MR response, and the real-time 3D CT imaging of the PEG@NCPs provide integrated information with high spatiotemporal precision by their mutual authentication. Thus, the PEG@NCPs could be used for the accurate diagnosis of tumors and for imaging-guided therapy.In vitro singlet oxygen generation evaluation and imaging-guided PDT with PEG@NCPs as a probe
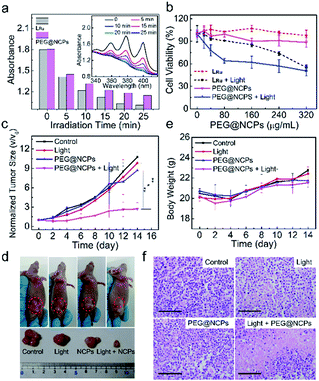
PDT is a safe treatment technique to eradicate diseased tissue through a photo-triggered process. Singlet oxygen (1O2) generation of Ru-complexes has been demonstrated.18,221O2 reacts with 9,10-anthracenediyl-bi(methylene)dimalonic acid (ABDA) to decrease its absorption at 380 nm, so it can be used to evaluate 1O2 generation. LRu or the PEG@NCPs (80 μM) were mixed with ABDA (100 μM) and then irradiated with an LED lamp (0.1 W cm−2). An absorption attenuation of 98% for LRu and 95% for the PEG@NCPs was observed after 20 min (Fig. 6a). The results illustrate the high 1O2 generation efficiency of the PEG@NCPs derived from the ligand, LRu. Conversely, the control groups showed a high stability under the same conditions (Fig. S19†). The viability of HepG2 cells was tested to evaluate the PDT efficiency of LRu and the PEG@NCPs. After irradiation with light with a wavelength of 480 nm for 10 min, the viability of the cells incubated with either LRu or the PEG@NCPs decreased rapidly, as illustrated in Fig. 6b. Consistent evidence was observed from Fig. S20,† where the dead cells were marked with trypan blue and about 50% of the cells died after incubation with the PEG@NCPs and light irradiation. Cells survived well in the groups only incubated with the PEG@NCPs or simply irradiated with light. Thus, the PEG@NCPs showed low toxicity and a high PDT efficiency. Furthermore, a confocal laser scanning microscope was used to observe the HepG2 cell lines after incubation with the PEG@NCPs or LRu. Bright red emission was observed and demonstrated that the PEG@NCPs or LRu entered into the cytoplasm (Fig. S21†). Moreover, both LRu and the PEG@NCPs induced significant nucleus contraction and morphological changes after light irradiation. Thus, the size, morphology, and surface charge of the PEG@NCPs facilitated their fast cell uptake for high cellular imaging and PDT efficiency.In vivo imaging-guided PDT of the PEG@NCPs was tested on the HepG2 tumor-bearing mice using their excellent PDT efficiency and accurate tumor identification with triple-modality imaging. The mice were divided into four groups. Group 1 was intravenously injected with saline as a control. Group 2 was exposed to blue light for 20 min at the tumor site. Group 3 and 4 were intravenously injected with the PEG@NCPs. After 5 min, the tumor sites of the mice in Group 4 were irradiated with blue light for 20 min, because it was observed in the triple-modality images that the PEG@NCPs accumulated in the tumor site 5 min post-injection (Fig. 5). The PEG@NCP injection and light irradiation were repeated every two days for two weeks and the tumor size and weight trend of the mice were monitored.
Group 4 displayed the highest tumor inhibition efficiency with the smallest tumor remaining after two weeks, as observed in the photos of the mice and the excised tumors (Fig. 6c and d). The body weight of all of the mice increased normally, which reveals the low toxicity of the PEG@NCPs and light to the mice (Fig. 6e). All of the tumors were dissected out for hematoxylin and eosin (H&E) analysis after two weeks (Fig. 6f). About 80% apoptotic and necrotic tumor cells were observed in Group 4 because of the efficient PDT effect of the PEG@NCPs. The H&E result revealed that 30% apoptotic and necrotic tumor cells were also found in Group 2, possibly because of the photothermal effect.
Conclusions
In summary, we developed a simple and robust synthesis of ratio-tunable mixed-metal NCPs using Ru[4,4′-(COOH)2bpy]32+, Gd3+ and Yb3+ as the precursors. The high coordination valences and the steric structure of the precursors provided the self-limited size and morphology of the NCPs. The functions derived from the building blocks were well integrated to achieve the multifunctional NCPs with excellent fluorescence, MR, and CT triple-modality imaging efficiency. The high PDT efficiency of the PEG@NCPs allowed imaging-guided tumor therapy. This simple strategy to prepare multifunctional NCPs can be extended to other nanomaterials by judicious selection of metal nodes and ligands.Acknowledgements
This work was supported by the Natural Science Foundation of China (No. 21675090 and 21435001), the National Basic Research Program of China (973 Program, No. 2015CB932001), Research Fund for the Doctoral Program of Higher Education (No. 20130031110016), and Tianjin Natural Science Foundation (15ZCZDSF00060).Notes and references
- (a) R. Weissleder and M. Nahrendorf, Proc. Natl. Acad. Sci. U. S. A., 2015, 47, 14428 Search PubMed; (b) M. F. Kircher, A. de la Zerda, J. V. Jokerst, C. L. Zavaleta, P. J. Kempen, E. Mittra, K. Pitter, R. Huang, C. Campos, F. Habte, R. Sinclair, C. W. Brennan, I. K. Mellinghoff, E. C. Holland and S. S. Gambhir, Nat. Med., 2012, 18, 829 CrossRef CAS PubMed; (c) P. Verwilst, S. Park, B. Yoon and J. S. Kim, Chem. Soc. Rev., 2015, 44, 1791 RSC; (d) K. E. deKrafft, Z. Xie, G. Cao, S. Tran, L. Ma, O. Z. Zhou and W. Lin, Angew. Chem., Int. Ed., 2009, 48, 9901 CrossRef CAS PubMed.
- D. Liu, R. C. Huxford and W. Lin, Angew. Chem., Int. Ed., 2011, 50, 3696 CrossRef CAS PubMed.
- Z. Yi, W. Lu, Y. Xu, J. Yang, L. Deng, C. Qian, T. Zeng, H. Wang, L. Rao, H. Liu and S. Zeng, Biomaterials, 2014, 35, 9689 CrossRef CAS PubMed.
- (a) H. Furukawa, K. E. Cordova, M. O’Keeffe and O. M. Yaghi, Science, 2013, 341, 1230444 CrossRef PubMed; (b) A. M. Spokoyny, D. Kim, A. Sumrein and C. A. Mirkin, Chem. Soc. Rev., 2009, 38, 1218 RSC; (c) W. Lin, W. J. Rieter and K. M. Taylor, Angew. Chem., Int. Ed., 2009, 48, 650 CrossRef CAS PubMed; (d) Y. Cui, B. Li, H. He, W. Zhou, B. Chen and G. Qian, Acc. Chem. Res., 2016, 49, 483 CrossRef CAS PubMed.
- (a) J. R. Li, R. J. Kuppler and H. C. Zhou, Chem. Soc. Rev., 2009, 38, 1477 RSC; (b) J. Lee, O. K. Farha, J. Roberts, K. A. Scheidt, S. T. Nguyen and J. T. Hupp, Chem. Soc. Rev., 2009, 38, 1450 RSC; (c) S. Kitagawa, R. Kitaura and S. Noro, Angew. Chem., Int. Ed., 2004, 43, 2334 CrossRef CAS PubMed; (d) T. Zhang and W. Lin, Chem. Soc. Rev., 2014, 43, 5982 RSC; (e) P. Mahato, A. Monguzzi, N. Yanai, T. Yamada and N. Kimizuka, Nat. Mater., 2015, 14, 924 CrossRef CAS PubMed; (f) D. Zhang, A. Gao, Y. Xu, X. B. Yin, X. W. He and Y. K. Zhang, Analyst, 2014, 139, 4613 RSC.
- C. Wang, T. Zhang and W. Lin, Chem. Rev., 2012, 112, 1084 CrossRef CAS PubMed.
- (a) J. J. Liu, Y. Yang, W. W. Zhu, X. Yi, Z. L. Dong, X. N. Xu, M. W. Chen, K. Yang, G. Lu, L. X. Jiang and Z. Liu, Biomaterials, 2016, 97, 1 CrossRef CAS PubMed; (b) Y. Yang, J. J. Liu, C. Liang, L. Z. Feng, T. T. Fu, Z. L. Dong, Y. Chao, Y. G. Li, G. Lu, M. W. Chen and Z. Liu, ACS Nano, 2016, 10, 2774 CrossRef CAS PubMed.
- (a) D. Liu, C. Poon, K. Lu, C. He and W. Lin, Nat. Commun., 2014, 5, 4182 CAS; (b) C. He, D. Liu and W. Lin, Chem. Rev., 2015, 115, 11079 CrossRef CAS PubMed; (c) P. Horcajada, T. Chalati, C. Serre, B. Gillet, C. Sebrie, T. Baati, J. F. Eubank, D. Heurtaux, P. Clayette, C. Kreuz, J. S. Chang, Y. K. Hwang, V. Marsaud, P. N. Bories, L. Cynober, S. Gil, G. Ferey, P. Couvreur and R. Gref, Nat. Mater., 2010, 9, 172 CrossRef CAS PubMed.
- (a) H. Yang, C. Y. Qin, C. Yu, Y. Lu, H. W. Zhang, F. f. Xue, D. M. Wu, Z. G. Zhou and S. P. Yang, Adv. Funct. Mater., 2014, 24, 1738 CrossRef CAS; (b) S. Qiu and G. Zhu, Coord. Chem. Rev., 2009, 253, 2891 CrossRef CAS; (c) W. J. Rieter, K. M. Pott, K. M. Taylor and W. Lin, J. Am. Chem. Soc., 2008, 130, 11584 CrossRef CAS PubMed.
- M. C. Heffern, L. M. Matosziuk and T. J. Meade, Chem. Rev., 2014, 114, 4496 CrossRef CAS PubMed.
- H. Xing, S. Zhang, W. Bu, X. Zheng, L. Wang, Q. Xiao, D. Ni, J. Zhang, L. Zhou, W. Peng, K. Zhao, Y. Hua and J. Shi, Adv. Mater., 2014, 26, 3867 CrossRef CAS PubMed.
- S. H. Tang, J. Wang, C. X. Yang, L. X. Dong, D. Kong and X. P. Yan, Nanoscale, 2014, 6, 8037 RSC.
- (a) W. Liu and X.-B. Yin, Trends Anal. Chem., 2016, 75, 86 CrossRef CAS; (b) K. Manna, T. Zhang and W. Lin, J. Am. Chem. Soc., 2014, 136, 6566 CrossRef CAS PubMed; (c) D. Liu, K. Lu, C. Poon and W. Lin, Inorg. Chem., 2014, 53, 1916 CrossRef CAS PubMed; (d) J. L. Wang, C. Wang and W. B. Lin, ACS Catal., 2012, 2, 2630 CrossRef CAS; (e) C. A. Kent, D. Liu, T. J. Meyer and W. Lin, J. Am. Chem. Soc., 2012, 134, 3991 CrossRef CAS PubMed.
- C. A. Kent, B. P. Mehl, L. Ma, J. M. Papanikolas, T. J. Meyer and W. Lin, J. Am. Chem. Soc., 2010, 132, 12767 CrossRef CAS PubMed.
- (a) C. Wang, D. Liu, Z. Xie and W. Lin, Inorg. Chem., 2014, 53, 1331 CrossRef CAS PubMed; (b) R. W. Larsen and L. Wojtas, J. Phys. Chem. A, 2012, 116, 7830 CrossRef CAS PubMed; (c) S. Zhang, L. Han, L. Li, J. Cheng, D. Yuan and J. Luo, Cryst. Growth Des., 2013, 13, 5466 CrossRef CAS; (d) T. Wang, N. Zabarska, Y. Wu, M. Lamla, S. Fischer, K. Monczak, D. Y. Ng, S. Rau and T. Weil, Chem. Commun., 2015, 51, 12552 RSC; (e) Y. Xu, X. B. Yin, X. W. He and Y. K. Zhang, Biosens. Bioelectron., 2015, 68, 197 CrossRef CAS PubMed; (f) X. Yin, Trends Anal. Chem., 2012, 33, 81 CrossRef CAS.
- (a) H. Furukawa, U. Muller and O. M. Yaghi, Angew. Chem., Int. Ed., 2015, 54, 3417 CrossRef CAS PubMed; (b) H. Fei, J. F. Cahill, K. A. Prather and S. M. Cohen, Inorg. Chem., 2013, 52, 4011 CrossRef CAS PubMed; (c) D. Sun, F. Sun, X. Deng and Z. Li, Inorg. Chem., 2015, 54, 8639 CrossRef CAS PubMed; (d) L. J. Wang, H. Deng, H. Furukawa, F. Gandara, K. E. Cordova, D. Peri and O. M. Yaghi, Inorg. Chem., 2014, 53, 5881 CrossRef CAS PubMed; (e) M. Kim, J. F. Cahill, H. Fei, K. A. Prather and S. M. Cohen, J. Am. Chem. Soc., 2012, 134, 18082 CrossRef CAS PubMed.
- (a) K. M. L. T. William, J. Rieter, H. An and W. Lin, J. Am. Chem. Soc., 2006, 126, 9024 Search PubMed; (b) P. Horcajada, R. Gref, T. Baati, P. K. Allan, G. Maurin, P. Couvreur, G. Ferey, R. E. Morris and C. Serre, Chem. Rev., 2012, 112, 1232 CrossRef CAS PubMed.
- K. M. Taylor, A. Jin and W. Lin, Angew. Chem., Int. Ed., 2008, 47, 7722 CrossRef CAS PubMed.
- M. Nakajima, M. Takeda, M. Kobayashi, S. Suzuki and N. Ohuchi, Cancer Sci., 2005, 96, 353–356 CrossRef CAS PubMed.
- F. F. X. Jin, J. Liu, C. Jiang, X. Han, Z. Song, J. Chen, G. Sun, H. Lei and L. Lu, Nanoscale, 2015, 7, 15680 RSC.
- (a) M. X. Yu and J. Zheng, ACS Nano, 2015, 9, 6655 CrossRef CAS PubMed; (b) Z. Yi, W. Lu, H. Liu and S. Zeng, Nanoscale, 2015, 7, 542 RSC; (c) H. X. Zhao, Q. Zou, S.-K. Sun, C. Yu, X. Zhang, R. J. Li and Y. Y. Fu, Chem. Sci., 2016, 7, 5294 RSC.
- (a) L. Z. He, Y. Y. Huang, H. L. Zhu, G. H. Pang, W. J. Zheng, Y. S. Wong and T. F. Chen, Adv. Funct. Mater., 2014, 24, 2754 CrossRef CAS; (b) H. Huang, B. Yu, P. Zhang, J. Huang, Y. Chen, G. Gasser, L. Ji and H. Chao, Angew. Chem., Int. Ed., 2015, 54, 14049 CrossRef CAS PubMed.
Footnote |
| † Electronic supplementary information (ESI) available: All experimental details, crystallographic data collection and refinement statistics, details of chemical synthesis, additional figures and tables. See DOI: 10.1039/c6sc05616d |
| This journal is © The Royal Society of Chemistry 2017 |

