 Open Access Article
From single-site tantalum complexes to nanoparticles of TaxNy and TaOxNy supported on silica: elucidation of synthesis chemistry by dynamic nuclear polarization surface enhanced NMR spectroscopy and X-ray absorption spectroscopy†
Janet C.
Mohandas
 a,
Edy
Abou-Hamad‡
a,
Emmanuel
Callens‡
a,
Edy
Abou-Hamad‡
a,
Emmanuel
Callens‡
 a,
Manoja K.
Samantaray
 a,
David
Gajan
b,
Andrei
Gurinov
 a,
Tao
Ma
 c,
Samy
Ould-Chikh
 a,
Adam S.
Hoffman
c,
Bruce C.
Gates
 *c and
Jean-Marie
Basset
 *a
*a
aKing Abdullah University of Science & Technology, KAUST Catalysis Center (KCC), 23955-6900 Thuwal, Saudi Arabia. E-mail: jeanmarie.basset@kaust.edu.sa
bInstitut de Sciences Analytiques (CNRS/ENS-Lyon/UCB-Lyon 1), Université de Lyon, Centre de RMN à Très Hauts Champs, 69100, Villeurbanne, France
cDepartment of Chemical Engineering, University of California, Davis, California 95616, USA. E-mail: bcgates@ucdavis.edu
First published on 8th June 2017
Abstract
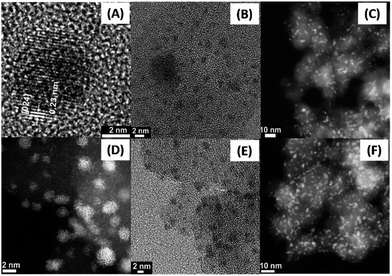
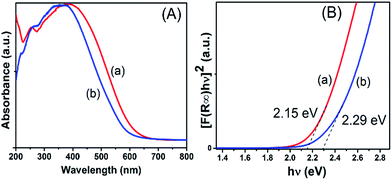
Air-stable catalysts consisting of tantalum nitride nanoparticles represented as a mixture of TaxNy and TaOxNy with diameters in the range of 0.5 to 3 nm supported on highly dehydroxylated silica were synthesized from TaMe5 (Me = methyl) and dimeric Ta2(OMe)10 with guidance by the principles of surface organometallic chemistry (SOMC). Characterization of the supported precursors and the supported nanoparticles formed from them was carried out by IR, NMR, UV-Vis, extended X-ray absorption fine structure, and X-ray photoelectron spectroscopies complemented with XRD and high-resolution TEM, with dynamic nuclear polarization surface enhanced NMR spectroscopy being especially helpful by providing enhanced intensities of the signals of 1H, 13C, 29Si, and 15N at their natural abundances. The characterization data provide details of the synthesis chemistry, including evidence of (a) O2 insertion into Ta–CH3 species on the support and (b) a binuclear to mononuclear transformation of species formed from Ta2(OMe)10 on the support. A catalytic test reaction, cyclooctene epoxidation, was used to probe the supported nanoparticles, with 30% H2O2 serving as the oxidant. The catalysts gave selectivities up to 98% for the epoxide at conversions as high as 99% with a 3.4 wt% loading of Ta present as TaxNy/TaOxNy.
Introduction
Dispersed species ranging from single-metal-atom complexes to clusters and nanoparticles (NPs) of metals and metal oxides are materials that find many applications, especially in catalysis.1–3 Numerous methods have been used to synthesize such NPs, often involving colloidal, solution-based, or chemical or physical vapour-deposition techniques.4,5 Solution-based methods often suffer from the need for capping agents or surfactants to stabilize the clusters or NPs, and deposition methods lack fine control and typically lead to highly nonhomogeneous materials.6,7 In typical catalytic applications, NPs are dispersed on high-area porous supports such as silica, alumina, and zeolites.8,9 The supported NPs are often unstable, undergoing agglomeration or sintering during operation.10A foundation for the synthesis of NPs from molecular building blocks on supports is provided by surface organometallic chemistry. Thus, the supported species can be made without the need for templates, capping agents, or surfactants, and the syntheses thereby offer good prospects for control of the compositions and sizes of the dispersed species. Essential reactant species in such syntheses are the support surface functional groups, exemplified by the –OH groups on silica. Control of the sizes of NPs synthesized from single-metal-atom precursors on supports may be facilitated by the initial bonding of the precursor species to the support to minimize agglomeration. Thus, for instance, surface organometallic chemistry has guided the synthesis of monometallic (Pt) and bimetallic (Pt–Sn) clusters on silica, giving catalysts with high activities and selectivities for catalytic hydrogenolysis, isomerization, and dehydrogenation reactions.11–13 However, only little work has been done to extend the concepts to non-metal NPs including semiconductors, and herein we demonstrate their use to guide the synthesis of silica-supported metal nitride semiconductor NPs.14 Such materials offer prospects as new catalysts, and they could also offer unique optoelectronic properties of potential value in displays, quantum computing, or photovoltaic devices.8,15–22
Unsupported nanocrystalline samples consisting of TaON and Ta3N5 were used by Gao et al.17 to catalyze cyclooctene epoxidation, an industrially important reaction. Epoxidation reactions are sensitive to catalyst surface acidity or basicity, and by incorporating nitrogen in place of oxygen in the framework of Ta2O5, these authors tuned the catalyst basicity and improved its properties.
Syntheses of metal nitrides often lead to mixed phases or non-stoichiometric compositions. Strategies to control metal nitride synthesis have been developed, some involving the application of various nitriding agents such as gaseous or liquid NH3, urea, cyanamide, etc.20,22 A traditional method involving gaseous NH3 is convenient for the synthesis of impurity-free metal nitrides, because the high treatment temperatures lead to the release of N2 and H2, which react with oxides and form water,21,23–25 which can be removed as a gas. Hence, we reasoned that it would be of interest to attempt analogous syntheses to make dispersed metal nitrides on a support, being guided by surface organometallic chemistry and starting with molecular metal complexes anchored to the support. We chose silica as the support because its surface chemistry is well understood and the principles of surface of organometallic chemistry are a powerful guide to manipulating syntheses on it. We chose tantalum as a precursor metal to allow a comparison of our results with those of Gao et al. for the performance of tantalum nitride catalysts for cyclooctene epoxidation.
Understanding the chemistry of species dispersed on solid surfaces emerges best when a battery of complementary characterization techniques is applied to allow elucidation of elementary reactions. Dynamic nuclear polarization surface enhanced NMR spectroscopy (DNP SENS) is especially powerful for elucidation of dispersed surface species and their transformations. The technique requires a simple impregnation of the sample with a stable free radical such as bi-radical nitroxide (TEKPol).26 The effective polarization transfer of free electrons of the radical to the surrounding nuclei (usually 1H) induced by microwave radiation and subsequent cross polarization to the nuclei of interest (13C, 15N, 29Si, 17O, etc.) are essential for the success of this recently developed technique. It allows NMR measurements with signal enhancements, leading to well-resolved spectra of any nuclei of interest.26–30
Taking advantage of this technique, we now report two strategies for the synthesis of air-stable, supported NPs of TaxNy and TaOxNy with sizes in the range of 0.5–3 nm, from well-defined molecular precursors without using any capping agents or surfactants. Such syntheses of finely sized NPs of tantalum nitride have not yet been known. The precursors, TaMe5, 1, and the dimeric Ta(OMe)5, 2, were first grafted onto silica (Aerosil SiO2-700-dehydroxylated at 973 K (700 °C)). Subsequent treatments led to the formation of TaxNy/TaOxNy NPs, which were tested as catalysts for epoxidation of cyclooctene. Conventional characterization techniques were sufficient to demonstrate the formation of the NPs, but understanding of the elementary steps of the surface chemistry required the application of DNP SENS.26–30 Further details of the surface tantalum species, including interatomic distances and coordination numbers, were obtained from extended X-ray absorption fine structure (EXAFS) spectra.31–34
Results and discussion
Summary of synthesis chemistry of silica-supported tantalum nitride nanoparticles from silica-supported tantalum complexes
To begin, we provide a summary roadmap, Scheme 1, illustrating the two synthetic strategies used to prepare the NPs referred to as TaxNy/TaOxNy. These were prepared from TaMe5, 1, and Ta(OMe)5, 2 (which exists as a dimer). The evidence for this chemistry is presented in the paragraphs that follow. The spectroscopic data show that 1 and 2, upon grafting onto SiO2-700, resulted in the formation of the supported species 1A and 2A, respectively, as shown in Scheme 1. 1A is formed as predominantly a monopodal species35–37 that underwent treatment with O2 to form the corresponding tantalum alkoxide 1B (Scheme 1). A tentative pathway corresponding to the O2 insertion is given in Scheme S1 (in the ESI†).38,391B and 2A are mixtures of monopodal and bipodal species, predominantly the former. A schematic representation of the associated surface reactions that occur during the grafting of 2 is provided in Scheme S2 (ESI†). The precursor 2 exists as a dimer in solution as well as in the solid-state.40,41 A binuclear-to-mononuclear transition was observed on the silica surface during the grafting, as shown in Scheme S2.† Nitriding of 1B and 2A at 1173 K for 15 h resulted in the formation of the corresponding tantalum nitrides/oxynitrides that are depicted as 1C and 2B, respectively.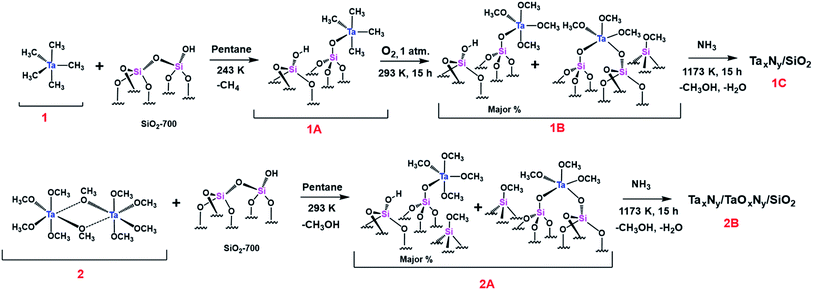 | ||
| Scheme 1 Two different strategies used for the synthesis of TaxNy/TaOxNy NPs (1C and 2B were handled in open air for all the characterizations except for the elemental analysis). | ||
Characterization of silica-supported tantalum complexes: evidence from IR spectroscopy
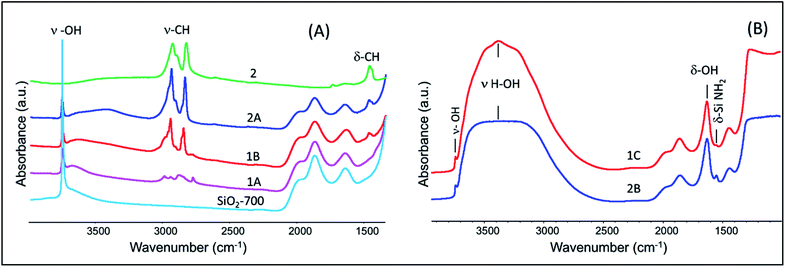
IR spectra of SiO2-700, 1A, 1B, 2A, and 2 are given in Fig. 1(A). The spectrum of the support (SiO2-700) alone includes two prominent, well-known vibrations representing the O–H stretching of isolated silanols, at 3746 cm−1, and lattice vibrations corresponding to Si–O–Si bridges, at 1985, 1864, and 1635 cm−1. The IR spectrum of 1A includes bands corresponding to the stretching vibrations of C–H bonds (ν–CH) of grafted Ta(CH3)5 at 2985 and 2932 cm−1 (νasy) and at 2900 and 2855 cm−1 (νsy). Bending vibrations of C–H groups (δ–CH) were observed at approximately 1397 cm−1.Treatment with 1 bar of O2 resulted in the insertion of oxygen atoms into Ta–Me bonds (Scheme S1, ESI†). Corresponding changes in the C–H stretching vibrations are evident in the spectrum of 1B. Bands corresponding to the C–H stretching vibrations of Ta–O–CH3 at 2960 and 2936 cm−1 (νasy) and 2854 and 2840 cm−1 (νsy) are evident in the spectrum; ν–CH stretching vibrations corresponding to [(![[triple bond, length as m-dash]](https://www.rsc.org/images/entities/char_e002.gif) Si–O–CH3)] (this notation represents methoxide groups bonded to the silica surface) were observed at 2992 (νasy) and 2856 cm−1 (νsy).42,43 Corresponding bending vibrations of C–H in Ta–O–CH3 and
Si–O–CH3)] (this notation represents methoxide groups bonded to the silica surface) were observed at 2992 (νasy) and 2856 cm−1 (νsy).42,43 Corresponding bending vibrations of C–H in Ta–O–CH3 and ![[triple bond, length as m-dash]](https://www.rsc.org/images/entities/char_e002.gif) Si–O–CH3 were observed at 1454 and 1436 cm−1, respectively.
Si–O–CH3 were observed at 1454 and 1436 cm−1, respectively.
The spectrum of 2A includes vibrational features similar to those of 1B, which are assigned to the C–H stretching of Ta–O–CH3 and ![[triple bond, length as m-dash]](https://www.rsc.org/images/entities/char_e002.gif) Si–O–CH3 species. This comparison suggests the presence of similar types of surface species in the samples made from the two precursors. A magnified view of the spectra of 1B, 2A, and 2, Fig. S1 (ESI†), is in line with the suggestion, with the spectrum of 2 supporting the assignments as it shows the stretching and bending vibrations of the precursor complex Ta(OMe)5 at approximately 2919, 2890, and 2823 cm−1. However, grafting resulted in ∼10–30 cm−1 shifts in the vibrational frequencies of Ta–O–CH3 for the complexes 1B and 2A.
Si–O–CH3 species. This comparison suggests the presence of similar types of surface species in the samples made from the two precursors. A magnified view of the spectra of 1B, 2A, and 2, Fig. S1 (ESI†), is in line with the suggestion, with the spectrum of 2 supporting the assignments as it shows the stretching and bending vibrations of the precursor complex Ta(OMe)5 at approximately 2919, 2890, and 2823 cm−1. However, grafting resulted in ∼10–30 cm−1 shifts in the vibrational frequencies of Ta–O–CH3 for the complexes 1B and 2A.
Because the grafting of 2 was accompanied by the release of methanol, we suggest that it might have opened up a nearby Si–O–Si bridge, resulting in the formation of ![[triple bond, length as m-dash]](https://www.rsc.org/images/entities/char_e002.gif) Si–OH and
Si–OH and ![[triple bond, length as m-dash]](https://www.rsc.org/images/entities/char_e002.gif) Si–O–CH3 moieties. Some of the released methanol might also have become adsorbed on the silica. Such adsorbed methanol would likely have been hydrogen bonded with remaining silanols—a possible explanation for the appearance of the broad band in the region of approximately 3400 cm−1 in the spectrum of 2A.
Si–O–CH3 moieties. Some of the released methanol might also have become adsorbed on the silica. Such adsorbed methanol would likely have been hydrogen bonded with remaining silanols—a possible explanation for the appearance of the broad band in the region of approximately 3400 cm−1 in the spectrum of 2A.
Silica-supported tantalum complexes: further evidence from elemental analyses
Elemental analysis data presented in Table S2 (ESI†) (samples for elemental analysis were handled under controlled atmospheres) show that the C/Ta value obtained for 1B is 3.6 ± 0.3, which suggests that the major species formed was monopodal (theoretical C/Ta = 4). 2A has a C/Ta value of 4.6 ± 0.3, which accounts for the major fraction of monopodal species, with Ta–(O–CH3)4 formed, along with neighbouring![[triple bond, length as m-dash]](https://www.rsc.org/images/entities/char_e002.gif) Si–OCH3 groups formed as a result of the reaction of methanol with the strained siloxane bridges (theoretical C/Ta = 5). The elemental analysis data match the expected values for the structures of 1B and 2A given in Scheme 1.
Si–OCH3 groups formed as a result of the reaction of methanol with the strained siloxane bridges (theoretical C/Ta = 5). The elemental analysis data match the expected values for the structures of 1B and 2A given in Scheme 1.
Characterization of supported tantalum nitride NPs
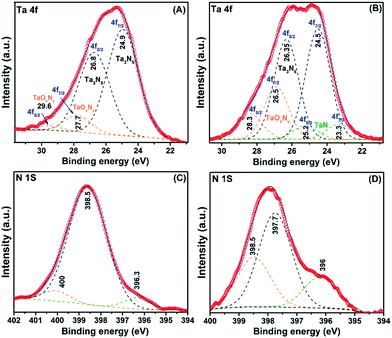 | ||
| Fig. 3 X-ray photoelectron spectra corresponding to Ta 4f of (A) 1C (B) 2B and N 1s of (C) 1C and (D) 2B. | ||
XPS data corresponding to the N 1s of 1C are given in Fig. 3(C). N 1s spectrum shows contributions from three different types of nitrogen environments with their corresponding binding energies at 396.3, 398.5, and 400 eV, similar to the reported values for TaN, TaxNy/Ta3N5, and TaOxNy phases, respectively. Slightly different contributions at 396, 397.7, and 398.5 eV were obtained for 2B as shown in Fig. 3(D).51,52 For 1C the main core-level is located at 398.5 eV (∼83%) whereas for 2B the nitrogen core-levels are more evenly distributed among the three binding energies (396, 397.7, and 398.5 eV). The data suggest that the preparation method has a strong impact on the homogeneity of the final synthesized tantalum nitride NPs: starting from the Ta(Me)5 precursor allows one to form the most homogenous tantalum nitride NPs. More spectra (C 1s, O 1s, and Si 2p) are provided for samples 1C and 2B in Fig. S7–S9, (ESI†). On the basis of the XPS analyses, we designate samples 1C and 2B as a mixture of TaxNy and TaOxNy phases.
Details of the molecular surface organotantalum chemistry
A more detailed characterization of the surface species depicted in Scheme 1 required spectroscopic evidence beyond that accessible from the results presented heretofore. NMR and EXAFS spectroscopies provide the further insights summarized in the following paragraphs.The 1H NMR spectrum of dimeric tantalum pentamethoxide 2 in CD2Cl2 solution at 300 K includes two major resonances, at 4.31 ppm (corresponding to terminal OCH3(a)) and at 4.05 ppm (corresponding to bridging O–CH3(c)), and these indicate a rapid intermolecular exchange of terminal and bridging methoxy groups. The low-temperature 1H NMR spectra include three signals with intensity ratios of 2![[thin space (1/6-em)]](https://www.rsc.org/images/entities/char_2009.gif) :
:![[thin space (1/6-em)]](https://www.rsc.org/images/entities/char_2009.gif) 2
2![[thin space (1/6-em)]](https://www.rsc.org/images/entities/char_2009.gif) :
:![[thin space (1/6-em)]](https://www.rsc.org/images/entities/char_2009.gif) 1, consistent with a dimeric bi-octahedral structure with two bridging methoxy groups. Significantly, the temperature dependence of the spectra indicates that the exchange of terminal methoxide groups occurs faster than the exchange of bridging and terminal methoxide groups.
1, consistent with a dimeric bi-octahedral structure with two bridging methoxy groups. Significantly, the temperature dependence of the spectra indicates that the exchange of terminal methoxide groups occurs faster than the exchange of bridging and terminal methoxide groups.
When the temperature was decreased, the signal at approximately 4.31 ppm split into two distinct singlets, at δ 4.35 and 4.22 ppm, showing that two types of terminal OCH3 groups exist, which are of type (a) and (b), respectively. A weak signal at about 3.33 ppm (CH3–OH), corresponding to traces of methanol in the sample, is also evident in the spectra. We surmise that some of the methanol used in the preparation of 2 remained in the samples. A very weak signal at about 5.3 ppm corresponding to trace amounts of CH2Cl2 (from solvent CD2Cl2) is also evident.
Fig. S11 (ESI†) shows the corresponding 13C NMR spectra of 2 at 300 and 193 K. The intensity ratio of terminal carbons to bridging carbons was found to be 2![[thin space (1/6-em)]](https://www.rsc.org/images/entities/char_2009.gif) :
:![[thin space (1/6-em)]](https://www.rsc.org/images/entities/char_2009.gif) 2
2![[thin space (1/6-em)]](https://www.rsc.org/images/entities/char_2009.gif) :
:![[thin space (1/6-em)]](https://www.rsc.org/images/entities/char_2009.gif) 1, as expected for a dimer. The 1H–13C HSQC spectra of Ta(OMe)5 at 193 K (Fig. S12 (ESI†)) show that the signals corresponding to (a) and (b), representing the terminal methoxides, correlate with the carbon signals at 61 and 58 ppm, whereas the bridging methoxide correlates with the carbon signal at 60 ppm. Furthermore, as expected, the 1H signal at 3.33 ppm, attributed to methanol, correlates with the carbon at 50 ppm. The weak 1H signal at 5.3 ppm correlates with the 13C signal of CH2Cl2-D2 (solvent), which appears at 54 ppm.
1, as expected for a dimer. The 1H–13C HSQC spectra of Ta(OMe)5 at 193 K (Fig. S12 (ESI†)) show that the signals corresponding to (a) and (b), representing the terminal methoxides, correlate with the carbon signals at 61 and 58 ppm, whereas the bridging methoxide correlates with the carbon signal at 60 ppm. Furthermore, as expected, the 1H signal at 3.33 ppm, attributed to methanol, correlates with the carbon at 50 ppm. The weak 1H signal at 5.3 ppm correlates with the 13C signal of CH2Cl2-D2 (solvent), which appears at 54 ppm.
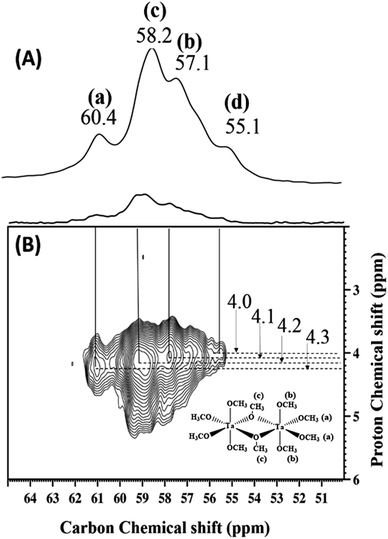
Fig. 5(A) and (B) is a representation of the solid-state 13C CP MAS NMR spectrum of 2 at room temperature and its corresponding two-dimensional 1H–13C correlation (HETCOR) spectrum. The 13C signals include resonances at 60.4, 58.2, 57.1, and 55.1 ppm, corresponding to a-terminal (a), c-bridging (c), b-terminal (b) methoxides and traces of adsorbed methanol, respectively. Fig. 5(B) confirms these assignments and also indicates the direct correlation with the corresponding protons of various types of methoxides and methanol.
The 1H MAS and 13C CP MAS NMR spectra of 1A show major peaks at 0.8 and 73 ppm, respectively, corresponding to methyl groups of Ta–CH3 (Fig. S13(a) and (b) (ESI†)). The 13C CP MAS NMR spectra of 1B and 2A (Fig. S14(a) and (b) (ESI†)) show two prominent signals at about 60 and 49 ppm corresponding to Ta–OCH3 and ![[triple bond, length as m-dash]](https://www.rsc.org/images/entities/char_e002.gif) Si–OCH3, respectively (we emphasize that the acquisition time for each of the corresponding spectra was 4–5 days with poor signal-to-noise ratios).
Si–OCH3, respectively (we emphasize that the acquisition time for each of the corresponding spectra was 4–5 days with poor signal-to-noise ratios).
It is thus clear that conventional NMR spectroscopy is limited for characterization of the surface chemistry involved in the preparation of TaxNy NPs. Hence, we turned to DNP surface-enhanced NMR spectroscopy (SENS) for improved sensitivity. SENS has been used by means of dynamic nuclear polarization (DNP), a technique that allows short acquisition times and is of particular value for samples incorporating species at low concentrations on surfaces.28 DNP SENS measurements were acquired at about 100 K, with TEKPol (stable radical) as the polarizing agent and 1,1,2,2-tetrachloroethane (TCE) and 1,2-dichlorobenzene (DCB) as the solvents.55
The 1H MAS DNP SENS spectrum of 1B in TCE (Fig. S15(a) (ESI†)) gave a very good proton enhancement (εH) of 112. The 13C CP MAS DNP SENS spectrum of 1B shows carbon signals corresponding to the solvent TCE, which overlaps the expected 13C chemical shifts of Ta–OCH3 and ![[triple bond, length as m-dash]](https://www.rsc.org/images/entities/char_e002.gif) Si–OCH3 (Fig. S15(b) (ESI†)). Hence, another solvent, DCB, was used to disperse the TEKPol, showing a proton enhancement of εH = 59 (Fig. S15(c) (ESI†)). The 13C CP MAS DNP SENS spectrum of 1B in DCB (Fig. 6(A)) shows the carbon signals corresponding to Ta–OCH3 and
Si–OCH3 (Fig. S15(b) (ESI†)). Hence, another solvent, DCB, was used to disperse the TEKPol, showing a proton enhancement of εH = 59 (Fig. S15(c) (ESI†)). The 13C CP MAS DNP SENS spectrum of 1B in DCB (Fig. 6(A)) shows the carbon signals corresponding to Ta–OCH3 and ![[triple bond, length as m-dash]](https://www.rsc.org/images/entities/char_e002.gif) Si–OCH3 at 60 and 49 ppm, respectively, without any interference from the solvent.56 The spectra were recorded for the sample including 13C in natural abundance. We were also able to acquire a DNP SENS 2D 1H–13C HETCOR NMR spectrum of 1B (Fig. 6(B)), which shows correlations of the 13C signal at 60 ppm with the 1H signal at 4.1 ppm of Ta–OCH3 and the 13C signal at 49 ppm with the 1H signal at 3.4 ppm of
Si–OCH3 at 60 and 49 ppm, respectively, without any interference from the solvent.56 The spectra were recorded for the sample including 13C in natural abundance. We were also able to acquire a DNP SENS 2D 1H–13C HETCOR NMR spectrum of 1B (Fig. 6(B)), which shows correlations of the 13C signal at 60 ppm with the 1H signal at 4.1 ppm of Ta–OCH3 and the 13C signal at 49 ppm with the 1H signal at 3.4 ppm of ![[triple bond, length as m-dash]](https://www.rsc.org/images/entities/char_e002.gif) Si–O–CH3.
Si–O–CH3.
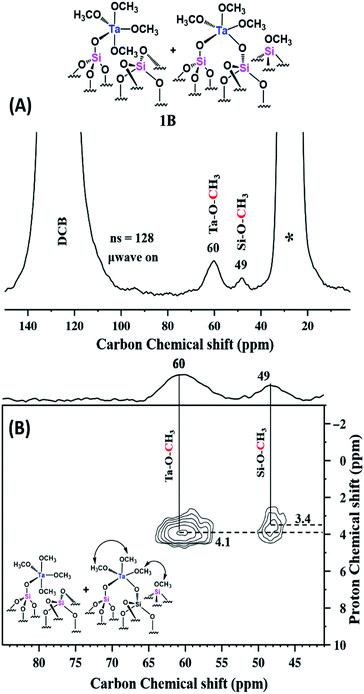 | ||
| Fig. 6 Schematic representation of 1B followed by (A) 13C CP MAS DNP SENS spectra (100 K, 400 MHz/263 GHz gyrotron) of 1B impregnated with 16 mM of TEKPol in DCB solution. The spectra were recorded using 128 scans, recycle delay of 3 s, contact time of 3 ms, and MAS frequency at 8 kHz. (* indicates the sidebands) (B). Two-dimensional 1H–13C heteronuclear correlation (HETCOR) DNP SENS spectrum of 1B acquired with 2048 scans per t1 increment, 96 individual increments, and 0.2 ms contact time. During t1, e-DUMBO-1 homonuclear 1H decoupling was applied and proton chemical shifts were corrected by applying a scaling factor of 0.57 (Table S1 (ESI†)). | ||
The MAS DNP SENS spectrum of 2A in TCE shows a proton and carbon signal enhancement εH = 147 and εC = 62, respectively (Fig. S16(a) & (b) (ESI†)). Here, for the suppression of TCE solvent signals, we used a CP MAS NMR with echo. The corresponding 13C CP MAS echo DNP spectrum (Fig. 7(A)) clearly shows two peaks for the sample, at 60 and 49 ppm, corresponding to Ta–O–CH3 and ![[triple bond, length as m-dash]](https://www.rsc.org/images/entities/char_e002.gif) Si–O–CH3, respectively. As in the case of 1B, the 2D 1H–13C HETCOR with echo spectrum (Fig. 7(B)) of 2A shows that the 13C of TaOCH3 and
Si–O–CH3, respectively. As in the case of 1B, the 2D 1H–13C HETCOR with echo spectrum (Fig. 7(B)) of 2A shows that the 13C of TaOCH3 and ![[triple bond, length as m-dash]](https://www.rsc.org/images/entities/char_e002.gif) Si–O–CH3 correlated with the corresponding 1H signals. A weak tail at 60 ppm correlating with the 1H at about 5.5 ppm might be evidence of a contribution from the solvent TCE.
Si–O–CH3 correlated with the corresponding 1H signals. A weak tail at 60 ppm correlating with the 1H at about 5.5 ppm might be evidence of a contribution from the solvent TCE.
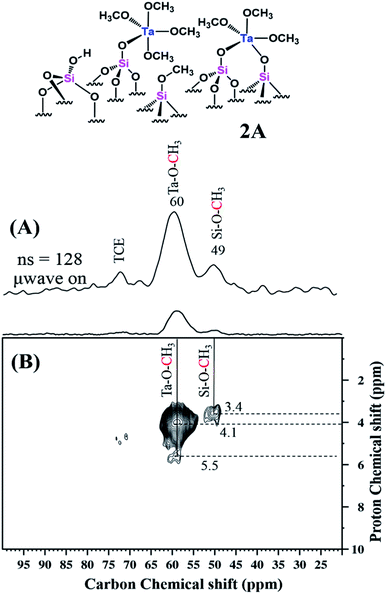 | ||
| Fig. 7 Schematic representation of 2A followed by (A) 13C CP MAS with echo DNP SENS spectra (100 K, 400 MHz/263 GHz gyrotron) of 2A impregnated with 16 mM TEKPOL in TCE solution. The spectra were recorded using 128 scans under microwave irradiation, recycle delay of 3 s, contact time of 3 ms, and MAS frequency at 8 kHz (B) 2D 1H–13C HETCOR DNP SENS spectrum with an echo of 2A acquired with 2048 scans per t1 increment, 96 individual increments and 0.2 ms contact time. During t1, e-DUMBO-1 homonuclear 1H decoupling was applied, and proton chemical shifts were corrected by applying a scaling factor of 0.57 (Table S1 (ESI†)). | ||
The 29Si MAS DNP SENS spectrum of 2A in TCE was acquired with only 1024 scans and showed the presence of Q and D type silicon at −100 and −16 ppm, respectively, attributed to the support Aerosil silica. The nature of the different Q-type Si and the D-type Si signals is explained in Fig. 8(A). The D-type signals are attributed mainly to Si atoms in (–O–Si(R2)–O–)x structures (This might be due to the contamination from grease used in the storage tubes). The two-dimensional 1H–29Si HETCOR DNP-SENS spectrum of 2A, Fig. 8(B), gives evidence of various Q types correlated with various surroundings of protons, namely, (a) that resulting from the interaction of Q3 with a corresponding OH proton (1.8 ppm); (b) that resulting from the direct interaction of Si of ![[triple bond, length as m-dash]](https://www.rsc.org/images/entities/char_e002.gif) Si–OCH3 with the corresponding OCH3 proton (3.2 ppm); and (c) that resulting from the Si of Si–O–Ta–OCH3 with the respective proton (4.4 ppm).
Si–OCH3 with the corresponding OCH3 proton (3.2 ppm); and (c) that resulting from the Si of Si–O–Ta–OCH3 with the respective proton (4.4 ppm).
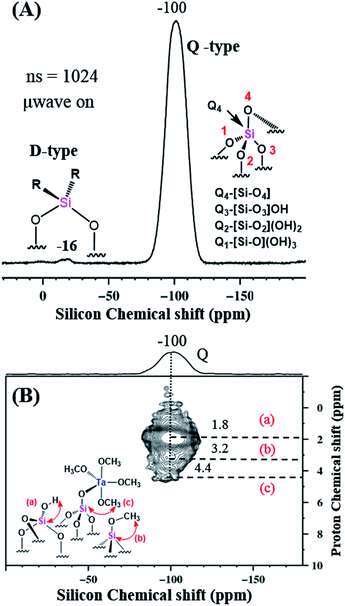 | ||
| Fig. 8 (A) 29Si CP MAS DNP SENS spectra (100 K, 400 MHz/263 GHz gyrotron) of 2A impregnated with 16 mM TEKPOL in TCE solution. The spectra were recorded with 1024 scans, recycle delay of 3 s, contact time of 5 ms, and MAS frequency at 8 kHz. Separate Q and D type Si species are represented for clarity. (B). 2D 1H–29Si HETCOR DNP SENS spectrum of 2A acquired with 2048 scans per t1 increment, 96 individual increments, and 0.2 ms contact time. During t1, e-DUMBO-1 homonuclear 1H decoupling was applied, and proton chemical shifts were corrected by applying a scaling factor of 0.57 (Table S1 (ESI†)). | ||
TaxNy/TaOxNy NPs obtained from both precursors 1B and 2A were subjected to DNP SENS analysis. The MAS DNP SENS spectra of 1C and 2B in TCE show proton enhancements of 119 and 101, respectively (Fig. S17 (ESI†)). The 15N CP MAS DNP SENS spectra of 1C and 2B were recorded with only 3072 scans (Fig. 9). In the case of 1C, the spectrum shows an intense signal at about 24 ppm that is attributed to TaxNy (Fig. 9(A)). For 2B, in addition to the peak at 24 ppm, a signal at 10 ppm is clearly visible that can be assigned to TaOxNy (Fig. 9(C)). There is only one report that describes a similar type of NMR observation for such small clusters of tantalum nitride;57 Wolczansky et al. demonstrated that similar types of alkylidene precursors generated clusters/oligomers of amorphous tantalum nitride at temperatures below 673 K and crystalline cubic tantalum nitride at temperatures above 1023 K. They also observed that the 15N signal corresponding to TaxNy shifted upfield in the case of small partially amorphous clusters.
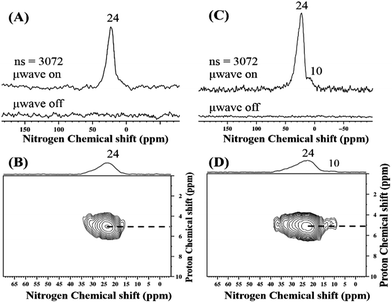 | ||
| Fig. 9 15N CP MAS DNP SENS spectrum (100 K, 400 MHz/263 GHz gyrotron) of (A) 1C and (C) 2B impregnated with 16 mM TEKPol in TCE solution. The spectra were recorded with 3072 scans under microwave irradiation, recycle delay of 3 s, contact time of 4 ms, and MAS frequency at 8 kHz. (B) and (D) Two-dimensional 1H–15N HETCOR DNP SENS spectrum of 1C and 2B acquired with 2048 scans per t1 increment, 96 individual increments, and 4 ms contact time. During t1, e-DUMBO-1 homonuclear 1H decoupling was applied, and proton chemical shifts were corrected by applying a scaling factor of 0.57. See Table S1† for the details. | ||
In general, the 15N signal for a bulk transition metal nitride is expected as a broad band at ∼400 ppm.58 For NPs of metal nitrides, the corresponding signal is shifted up field to 24 ppm (Fig. 9(A)). Moreover, as the coordinating nitrogen is replaced by oxygen, the 15N signal corresponding to TaOxNy is further shifted to 10 ppm (Fig. 9(C)). The 1H–15N HETCOR DNP SENS spectra of 1C and 2B (Fig. 9(B) & (D)) recorded with the long contact time of 5 ms show a distant correlation with the 1H of the solvent, which appears at about 5 ppm. Thus, the 15N DNP SENS results complement the XPS results.
EXAFS data analysis was carried out with the software packages ATHENA and XDAP.60,61 Reference files used for phase shift and backscattering amplitude corrections were calculated with the FEFF 7.0 code.62 A summary of the results is presented in Table 1, and the details of the fitting and analyses are presented in Fig. S18–S30 and Tables S6–S9 (ESI†).
| Sample | Shell | N | R (Å) | Δσ2 × 10³ (Å2) | ΔE0 (eV) |
|---|---|---|---|---|---|
| a Notation: N, coordination number; R, absorber-backscatterer distance; Δσ2, disorder term (Debye–Waller factor); ΔE0, inner potential correction; m, methyl; s, support; mo, methoxy; l, long; t-mo, terminal methoxy; b-mo, bridging methoxy. Estimated error bounds for each parameter are as follows: N ± 20%; R ± 0.02 Å; Δσ2 ± 20%; ΔE0 ± 20%. | |||||
| 1A | Ta–Cm | 4.0 | 2.20 | 3.0 | −10.0 |
| Ta–Os | 1.5 | 1.90 | 1.0 | −9.7 | |
| 1B Model I | Ta–Omo/s | 2.0 | 1.86 | 3.7 | 3.2 |
| Ta–C | 2.3 | 2.57 | 1.1 | 14.4 | |
| Ta–Cmo | 3.5 | 3.18 | 6.2 | −14.7 | |
| Ta–Ol | 5.2 | 3.76 | 10.4 | −6.6 | |
| 1B Model II | Ta–Omo/s | 2.0 | 1.85 | 3.6 | 4.6 |
| Ta–O | 1.6 | 2.55 | 1.4 | 7.5 | |
| Ta–Cmo | 4.2 | 3.20 | 8.2 | −14.7 | |
| Ta–Ol | 3.7 | 3.75 | 6.4 | −5.8 | |
| 2 | Ta–Ot-mo | 2.0 | 1.88 | 4.7 | 3.8 |
| Ta–Ob-mo | 2.0 | 2.20 | 3.4 | −2.7 | |
| Ta–Cmo | 4.0 | 3.15 | 9.9 | −13.6 | |
| Ta–Ta | 1.2 | 3.40 | 4.5 | −11.2 | |
| 2A | Ta–Omo/s | 3.3 | 1.88 | 6.3 | 1.5 |
| Ta–Cmo | 3.3 | 3.11 | 0.1 | −16.6 | |
| Ta–Sis | 2.8 | 3.33 | 5.2 | 3.7 | |
| Ta–Ol | 5.8 | 3.78 | 10.9 | −8.3 | |
The best-fit model for 1A is consistent with the expectation of methyl groups and support oxygen atoms bonded to the tantalum. The model thus gives evidence of a Ta–C contribution and a Ta–O contribution. The non-integer Ta–O coordination number (Table 1) could be an indication of the presence of some bipodal species, possibly formed under the influence of the X-ray beam during the measurement, as was observed for a silica-supported tungsten complex.63 The results are nonetheless consistent with the expectation that the sample consisted of predominantly of monopodal species, [(![[triple bond, length as m-dash]](https://www.rsc.org/images/entities/char_e002.gif) SiO–)Ta(CH3)4].
SiO–)Ta(CH3)4].
In fitting the data characterizing sample 1B, two different models were considered to resolve O in the support and O in the methoxy groups. They are Models I and II, consisting of four shells, the maximum number justified by the data: (1) a Ta–O contribution (where O represents unresolved methoxy and support O atoms), (2) a Ta–C contribution, (3) another Ta–O contribution to represent the interaction of Ta with O atoms of the support at a distance greater than a bonding distance, and (4) another Ta-light atom contribution. In Model I, the light atom is C; in Model II, it is O. These models provided satisfactory fits of the data, with Model II giving a slightly better fit than the other. The important point is the confirmation of the presence of methoxy groups on the Ta, with Ta–O and a Ta–C contributions at appropriate distances for tantalum methoxy species (Table 1). But the results are less than quantitative, failing to resolve all of the Ta–C and Ta–O contributions, and thus reflecting the limitations of EXAFS spectroscopy for structures such as ours.
EXAFS spectroscopy was also used to characterize the dimeric precursor 2, for which there is no known crystal structure. The results (Table 1) demonstrate a Ta–Ta contribution, with a coordination number of 1 (within error) at a distance of 3.34 Å, consistent with a dimer. The EXAFS data also give evidence of methoxy groups (Table 1), but the C/Ta and O/Ta ratio suggested from the Ta–O and Ta–C coordination numbers is about 3, rather than the value of 5 expected for Ta(OMe)5. Thus, the data are less than sufficient for a structure determination, and we postulate that the sample was degraded under the influence of the X-ray beam in the experiment, consistent with our observation that the second and third scans were different from the first (the third scan was used in the data analysis, because the data quality was higher than that of the earlier scans).
An approach similar to that described above for sample 1B was used in fitting the data characterizing the supported sample prepared from precursor 2, that is, 2A. Again, it was found that resolution of the various Ta–O contributions was not justified by the data, and so a simplified model was used (Table 1). The best-fit model leads to the important result that there is no EXAFS evidence of a Ta–Ta contribution, and thus there is support for the above-stated inference that the dimers broke and gave single-site species.
Thus, although EXAFS data were not sufficient to provide conclusive evidence of the exact structures of 1B and 2, the best-fit models support the following hypothesis: (a) transformation of 1 to 1B takes place by oxygen insertion (Ta–C to Ta–O–C), (b) 2 is a dimer with two bridging methoxide ligands with a Ta–Ta contribution, (c) 2A is a single-site species with no Ta–Ta contribution, and (d) 1B and 2A are similar types of surface species.
Catalytic properties of silica-supported tantalum nitride NPs
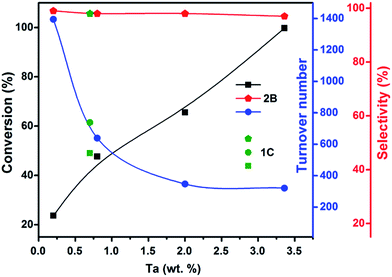
TaxNy and TaOxNy NPs (1C and 2B) were tested as catalysts for cyclooctene epoxidation with liquid-phase reactants including 30 wt% H2O2 as the oxidant. Dilute hydrogen peroxide is one of the most convenient oxidants for epoxide formation because of its ease of handling and high oxygen content, and the relative lack of by-products in the reactions.64,65 The reaction conditions were as follows: a volume of 0.92 mL of cyclooctene in 4 mL of methanol with 4–70 mg of catalyst was used in a batch reactor; 3 mL of H2O2 was used as the oxidant. The epoxidation reaction was carried out at 333 K for 18 h under refluxing conditions. Blank experiments were conducted in the absence of either a catalyst or H2O2 to assess the activity. No conversion was observed in the absence of the peroxide. In contrast, 8% conversion and approximately 98% selectivity were observed in the presence of H2O2 but in the absence of a catalyst. The catalyst performance data are presented in Fig. 10 and Table S4(a) (ESI†).Turnover numbers as high as 1395 were observed with 0.2 wt% of Ta in the catalyst. With an increase in Ta content, a gradual decrease of TON values was observed.66 In contrast, conversion increased with increasing catalyst Ta content. The product formed was mainly cyclooctene epoxide with traces of cyclooctene diol. The observed selectivities were between 98 and 99% for the lower catalyst Ta loadings. A reaction with Aerosil silica but without NPs was conducted to provide evidence of the effect of the support. Results were similar to that of the blank reaction (performed with H2O2 but no catalyst) showing a conversion of ∼10% and a relatively low selectivity of ∼87%. Thus, silica is not just an innocent spectator in this partial oxidation reaction, but its effect under our reaction conditions was minimal, corresponding to its weak Brønsted acidity.67 The catalyst performance data indicate that 1C (Ta content ∼0.7 wt%) shows only slightly better performance than 2B, which might be attributed to the smaller particles of 1C. For Ta contents below 3.4 wt%, the observed selectivities were ∼98%. Yet, similar selectivities were observed for various Ta contents. However, a further increase in Ta content resulted in a decline in the selectivity. A significant improvement in the conversion, from 23 to 99% or more, was achievable with increasing Ta content.
On the basis of reported17 mechanisms, we suggest that only surface Ta sites, which are either oxo or bis-hydroxide, could be the active sites (Scheme S3 (ESI†)). Because the surface to volume ratio of the NPs is high, they have more Ta sites than the corresponding masses of bulk tantalum nitrides and are evidently more efficient catalysts. Gao et al.17 reported that pure Ta3N5 has a higher basicity than TaON. High basicity might induce the decomposition of H2O2. As a result, the effective amount of H2O2 available in the reaction medium may not be sufficient for the formation of tantalum hydroperoxide active sites. Their study has shown that TaON with controlled basicity influences the epoxidation activity positively. The surface of tantalum nitride NPs undergoes oxidation to form a similar surface layer of TaOxNy which probably generates the active sites during the reaction, and this might be the reason for the observed similarities in activities of 1C and 2B. XPS results show the presence of TaOxNy phase in 1C.
Gao et al.17 used unsupported Ta3N5/TaON NPs (∼20 nm in average diameter) for the same reaction. They found approximately 57% conversion with Ta2O5, whereas Ta3N5 or TaON showed higher conversions, including, for example, 97% conversion with 96% selectivity with TaON nanoclusters being the best. By making use of supported NPs (0.5–3 nm in diameter) for the same reaction under similar reaction conditions, we observed conversions approaching 100% without loss of selectivity with a catalyst Ta content as low as ∼3.4 wt%. Notably, we did not observe any leaching of the active species from the surface. The substrate scope of the TaxNy supported catalyst was probed with other substrates such as styrene, cyclohexene, and 1-octene and the results are presented in Table S4(b) (ESI†).
We compared the observed activities with literature values (shown for catalysts incorporating transition metals and supported on silica) for the catalytic cyclooctene epoxidation (Table S4(a) and S5 (ESI†)). Although a direct comparison of our data with literature data is not possible, we have sufficient data to infer that the activities reported in the literature are lower than that of the supported nitride/oxynitride catalyst reported here. At all of the Ta loadings tested, high selectivities were obtained for cyclooctene epoxide, both with samples 1C and 2B. These observations and the comparisons with the literature suggest that our metal nitride or metal oxynitride/silica samples could be promising alternatives to metal/silica catalysts for the cyclooctene epoxidation reaction. On the basis of the literature, we suggest a tentative mechanism for the cyclooctene epoxidation catalyzed by TaxNy/TaOxNy NPs on silica, as summarized in Scheme S3.†17,68–73
Conclusions
Highly dispersed TaxNy/TaOxNy NPs with diameters in the range of 0.5 to 3 nm supported on silica were synthesized from supported tantalum complexes according to the strategy of surface organometallic chemistry. Characterization of the surface species at various stages of the synthesis by a range of spectroscopic and microscopic methods gave evidence of the chemistry. Especially helpful was solid-state NMR spectroscopy, specifically, DNP SENS, for understanding this chemistry—this technique enabled the sensitive detection of hetero nuclei including 13C, 15N, and 29Si with the aid of the polarizing agent TEKPol. The results indicate oxygen insertion into supported tantalum alkyl complexes to form tantalum alkoxides at room temperature. NMR and EXAFS data provide evidence of a binuclear to mononuclear transformation of Ta2(OMe)10 upon grafting to the support. Irrespective of whether the precursor was mono- or binuclear, nitriding resulted in the formation of a mixture of TaxNy and TaOxNy NPs from the molecular precursors, with the sizes depending on the precursor. The NPs catalyse cyclooctene epoxidation with selectivities of ∼98% at conversions of ∼99%.Acknowledgements
We gratefully acknowledge the financial support provided by the King Abdullah University of Science and Technology (KAUST). We thank Dr Kun Li, Dr Nejib Hedili, and Dr Abdul-Hamid Emwas of the KAUST core labs for HRTEM, XPS, and NMR measurements, respectively, and Prof. Kazuhiro Takanabe for help with the ammonia treatments. We acknowledge Prof. Lyndon Emsley, EPFL, Switzerland, for helpful suggestions. We acknowledge beam time at beamline 4-1 of the Stanford Synchrotron Radiation Lightsource supported by the U.S. DOE Division of Materials Science under Contract No. DE-AC02-76SF00515.Notes and references
- A. Borodziński and M. Bonarowska, Langmuir, 1997, 13, 5613–5620 CrossRef.
- W. Lu and C. M. Lieber, Nat. Mater., 2007, 6, 841–850 CrossRef CAS PubMed.
- J. Yang, T. Ling, W.-T. Wu, H. Liu, M.-R. Gao, C. Ling, L. Li and X.-W. Du, Nat. Commun., 2013, 4, 1695 CrossRef PubMed.
- (a) X. Cheng, S. B. Lowe, P. J. Reece and J. J. Gooding, Chem. Soc. Rev., 2014, 43, 2680–2700 RSC; (b) C.-T. Ho, K.-B. Low, R. F. Klie, K. Maeda, K. Domen, R. J. Meyer and P. T. Snee, J. Phys. Chem. C, 2011, 115, 647–652 CrossRef CAS.
- L. Fan, M. Zhu, X. Lee, R. Zhang, K. Wang, J. Wei, M. Zhong, D. Wu and H. Zhu, Part. Part. Syst. Charact., 2013, 30, 764–769 CrossRef CAS.
- C. Zhen, L. Wang, G. Liu, G. Q. Lu and H.-M. Cheng, Chem. Commun., 2013, 49, 3019–3021 RSC.
- T. Hisatomi, M. Otani, K. Nakajima, K. Teramura, Y. Kako, D. Lu, T. Takata, J. N. Kondo and K. Domen, Chem. Mater., 2010, 22, 3854–3861 CrossRef CAS.
- G. H. Carey, A. L. Abdelhady, Z. Ning, S. M. Thon, O. M. Bakr and E. H. Sargent, Chem. Rev., 2015, 115, 12732–12763 CrossRef CAS PubMed.
- J. P. Wilcoxon, T. Martino, E. Klavetter and A. P. Sylwester, in Nanophase Materials: Synthesis—Properties—Applications, ed. G. C. Hadjipanayis and R. W. Siegel, Springer Netherlands, Dordrecht, 1994, pp. 771–780, DOI:10.1007/978-94-011-1076-1_80.
- T. Bligaard, R. M. Bullock, C. T. Campbell, J. G. Chen, B. C. Gates, R. J. Gorte, C. W. Jones, W. D. Jones, J. R. Kitchin and S. L. Scott, ACS Catal., 2016, 6, 2590–2602 CrossRef CAS.
- F. Humblot, J. P. Candy, F. Le Peltier, B. Didillon and J.-M. Basset, J. Catal., 1998, 179, 459–468 CrossRef CAS.
- H. Zhu, D. H. Anjum, Q. Wang, E. Abou-Hamad, L. Emsley, H. Dong, P. Laveille, L. Li, A. K. Samal and J.-M. Basset, J. Catal., 2014, 320, 52–62 CrossRef CAS.
- C. R. Kagan and C. B. Murray, Nat. Nanotechnol., 2015, 10, 1013–1026 CrossRef CAS PubMed.
- A. P. Alivisatos, Science, 1996, 271, 933–937 CAS.
- W. Jiang, C. Siming, S. Alwyn and L. Huiyun, J. Phys. D: Appl. Phys., 2015, 48, 363001 CrossRef.
- X. Wang, G. Sun, N. Li and P. Chen, Chem. Soc. Rev., 2016, 45, 2239–2262 RSC.
- Q. S. Gao, S. N. Wang, Y. C. Ma, Y. Tang, C. Giordano and M. Antonietti, Angew. Chem., Int. Ed., 2012, 51, 961–965 CrossRef CAS PubMed.
- Q. S. Gao, C. Giordano and M. Antonietti, Small, 2011, 7, 3334–3340 CrossRef CAS PubMed.
- Q. Gao, C. Giordano and M. Antonietti, Angew. Chem., 2012, 124, 11910–11914 CrossRef.
- Q. Gao, C. Giordano and M. Antonietti, Small, 2011, 7, 3334–3340 CrossRef CAS PubMed.
- Z. Wang, J. Hou, S. Jiao, K. Huang and H. Zhu, J. Mater. Chem., 2012, 22, 21972–21978 RSC.
- K. Maeda, ACS Catal., 2013, 3, 1486–1503 CrossRef CAS.
- Y. Sasaki, Z. Tokuyasu, Y. Ono, M. Iwasaki and S. Ito, Adv. Mater. Sci. Eng., 2009, 2009, 4 Search PubMed.
- Y.-C. Wang, C.-Y. Chang, T.-F. Yeh, Y.-L. Lee and H. Teng, J. Mater. Chem. A, 2014, 2, 20570–20577 CAS.
- M. Jansen and H. P. Letschert, Nature, 2000, 404, 980–982 CrossRef CAS PubMed.
- (a) A. J. Rossini, A. Zagdoun, M. Lelli, A. Lesage, C. Copéret and L. Emsley, Acc. Chem. Res., 2013, 46, 1942–1951 CrossRef CAS PubMed; (b) E. Pump, J. Viger-Gravel, E. Abou-Hamad, M. K. Samantaray, B. Hamzaoui, A. Gurinov, D. H. Anjum, D. Gajan, A. Lesage, A. Bendjeriou-Sedjerari, L. Emsley and J.-M. Basset, Chem. Sci., 2017, 8, 284–290 RSC.
- L. Piveteau, T.-C. Ong, A. J. Rossini, L. Emsley, C. Copéret and M. V. Kovalenko, J. Am. Chem. Soc., 2015, 137, 13964–13971 CrossRef CAS PubMed.
- E. Bouleau, P. Saint-Bonnet, F. Mentink-Vigier, H. Takahashi, J. F. Jacquot, M. Bardet, F. Aussenac, A. Purea, F. Engelke, S. Hediger, D. Lee and G. De Paepe, Chem. Sci., 2015, 6, 6806–6812 RSC.
- A. Lesage, M. Lelli, D. Gajan, M. A. Caporini, V. Vitzthum, P. Miéville, J. Alauzun, A. Roussey, C. Thieuleux, A. Mehdi, G. Bodenhausen, C. Coperet and L. Emsley, J. Am. Chem. Soc., 2010, 132, 15459–15461 CrossRef CAS PubMed.
- M. Valla, A. J. Rossini, M. Caillot, C. Chizallet, P. Raybaud, M. Digne, A. Chaumonnot, A. Lesage, L. Emsley, J. A. van Bokhoven and C. Copéret, J. Am. Chem. Soc., 2015, 137, 10710–10719 CrossRef CAS PubMed.
- O. A. Nikonova, G. A. Seisenbaeva, V. G. Kessler, P. A. Shcheglov and D. V. Drobot, Russ. J. Inorg. Chem., 2007, 52, 1687–1693 CrossRef.
- C. Copéret, A. Comas-Vives, M. P. Conley, D. P. Estes, A. Fedorov, V. Mougel, H. Nagae, F. Núñez-Zarur and P. A. Zhizhko, Chem. Rev., 2016, 116, 323–421 CrossRef PubMed.
- A. Johansson, M. Roman, G. A. Seisenbaeva, L. Kloo, Z. Szabo and V. G. Kessler, J. Chem. Soc., Dalton Trans., 2000, 387–394, 10.1039/A907720K.
- M. T. Vandenborre, B. Poumellec, C. Alquier and J. Livage, J. Non-Cryst. Solids, 1989, 108, 333–337 CrossRef CAS.
- Y. Chen, E. Abou-hamad, A. Hamieh, B. Hamzaoui, L. Emsley and J.-M. Basset, J. Am. Chem. Soc., 2015, 137, 588–591 CrossRef CAS PubMed.
- Y. Chen, S. Ould-Chikh, E. Abou-Hamad, E. Callens, J. C. Mohandas, S. Khalid and J.-M. Basset, Organometallics, 2014, 33, 1205–1211 CrossRef CAS.
- R. R. Schrock and P. Meakin, J. Am. Chem. Soc., 1974, 96, 5288–5290 CrossRef CAS.
- E. C. Garrett, T. M. Figg and T. R. Cundari, Inorg. Chem., 2014, 53, 7789–7798 CrossRef CAS PubMed.
- S.-J. Chen and Z.-L. Xue, Organometallics, 2010, 29, 5579–5584 CrossRef CAS.
- L. G. Hubert-Pfalzgraf and J. G. Riess, Inorg. Chem., 1975, 14, 2854–2856 CrossRef CAS.
- D. C. Bradley and C. E. Holloway, J. Chem. Soc. A, 1968, 219–223 RSC.
- R. P. Saint-Arroman, J.-M. Basset, F. Lefebvre and B. Didillon, Appl. Catal., A, 2005, 290, 181–190 CrossRef CAS.
- L. J. Burcham, G. Deo, X. Gao and I. E. Wachs, Top. Catal., 2000, 11, 85–100 CrossRef.
- (a) Y. Luo, J. Yi, D. Tong and C. Hu, Green Chem., 2016, 18, 848–857 RSC; (b) R. K. Singha, S. Ghosh, S. S. Acharyya, A. Yadav, A. Shukla, T. Sasaki, A. M. Venezia, C. Pendem and R. Bal, Catal. Sci. Technol., 2016, 6, 4601–4615 RSC.
- A. Noshay, M. Matzner and T. C. Williams, Ind. Eng. Chem. Prod. Res. Dev., 1973, 12, 268–277 CAS.
- E. Nurlaela, S. Ould-Chikh, M. Harb, S. del Gobbo, M. Aouine, E. Puzenat, P. Sautet, K. Domen, J.-M. Basset and K. Takanabe, Chem. Mater., 2014, 26, 4812–4825 CrossRef CAS.
- L. Li, E.-W. Niu, G.-H. Lv, W.-R. Feng, W.-C. Gu, G.-L. Chen, G.-L. Zhang, S.-H. Fan, C.-Z. Liu and S.-Z. Yang, Chin. Phys. Lett., 2006, 23, 3018 CrossRef CAS.
- N. Arshi, J. Lu, Y. K. Joo, J. H. Yoon and B. H. Koo, Surf. Interface Anal., 2015, 47, 154–160 CrossRef CAS.
- H. X. Dang, N. T. Hahn, H. S. Park, A. J. Bard and C. B. Mullins, J. Phys. Chem. C, 2012, 116, 19225–19232 CAS.
- A. Arranz and C. Palacio, Appl. Phys. A, 2005, 81, 1405–1410 CrossRef CAS.
- M. Chisaka, A. Ishihara, N. Uehara, M. Matsumoto, H. Imai and K. Ota, J. Mater. Chem. A, 2015, 3, 16414–16418 CAS.
- M. Liao, J. Feng, W. Luo, Z. Wang, J. Zhang, Z. Li, T. Yu and Z. Zou, Adv. Funct. Mater., 2012, 22, 3066–3074 CrossRef CAS.
- Y. Kado, C.-Y. Lee, K. Lee, J. Muller, M. Moll, E. Spiecker and P. Schmuki, Chem. Commun., 2012, 48, 8685–8687 RSC.
- E. Nurlaela, M. Harb, S. del Gobbo, M. Vashishta and K. Takanabe, J. Solid State Chem., 2015, 229, 219–227 CrossRef CAS.
- A. Zagdoun, G. Casano, O. Ouari, M. Schwarzwälder, A. J. Rossini, F. Aussenac, M. Yulikov, G. Jeschke, C. Copéret, A. Lesage, P. Tordo and L. Emsley, J. Am. Chem. Soc., 2013, 135, 12790–12797 CrossRef CAS PubMed.
- M. W. McKittrick and C. W. Jones, Chem. Mater., 2003, 15, 1132–1139 CrossRef CAS.
- M. M. Banaszak Holl, P. T. Wolczanski, D. Proserpio, A. Bielecki and D. B. Zax, Chem. Mater., 1996, 8, 2468–2480 CrossRef CAS.
- K. J. D. MacKenzie, R. H. Meinhold, D. G. McGavin, J. A. Ripmeester and I. Moudrakovski, Solid State Nucl. Magn. Reson., 1995, 4, 193–201 CrossRef CAS PubMed.
- R. E. Jentoft, S. E. Deutsch and B. C. Gates, Rev. Sci. Instrum., 1996, 67, 2111–2112 CrossRef CAS.
- E. A. Stern, M. Newville, B. Ravel, Y. Yacoby and D. Haskel, Phys. B, 1995, 208, 117–120 CrossRef.
- M. Newville, J. Synchrotron Radiat., 2001, 8, 96–100 CrossRef CAS PubMed.
- S. I. Zabinsky, J. J. Rehr, A. Ankudinov, R. C. Albers and M. J. Eller, Phys. Rev. B: Condens. Matter Mater. Phys., 1995, 52, 2995–3009 CrossRef CAS.
- N. Maity, S. Barman, E. Callens, M. K. Samantaray, E. Abou-Hamad, Y. Minenkov, V. D'Elia, A. S. Hoffman, C. M. Widdifield, L. Cavallo, B. C. Gates and J.-M. Basset, Chem. Sci., 2016, 7, 1558–1568 RSC.
- W. R. Sanderson, Pure Appl. Chem., 2000, 72, 1289–1304 CrossRef CAS.
- R. Noyori, M. Aoki and K. Sato, Chem. Commun., 2003, 1977–1986, 10.1039/B303160H.
- S. Xue, G. Chen, Z. Long, Y. Zhou and J. Wang, RSC Adv., 2015, 5, 19306–19314 RSC.
- P. Chandra, D. S. Doke, S. B. Umbarkar, K. Vanka and A. V. Biradar, RSC Adv., 2015, 5, 21125–21131 RSC.
- P. J. Cordeiro and T. D. Tilley, ACS Catal., 2011, 1, 455–467 CrossRef CAS.
- D. A. Ruddy and T. D. Tilley, Chem. Commun., 2007, 3350–3352 RSC.
- N. Morlanes and J. M. Notestein, Appl. Catal., A, 2010, 387, 45–54 CrossRef CAS.
- U. Arnold, R. Serpa da Cruz, D. Mandelli and U. Schuchardt, J. Mol. Catal. A: Chem., 2001, 165, 149–158 CrossRef CAS.
- N. A. Stephenson and A. T. Bell, J. Am. Chem. Soc., 2005, 127, 8635–8643 CrossRef CAS PubMed.
- M.-L. Lin, K. Hara, Y. Okubo, M. Yanagi, H. Nambu and A. Fukuoka, Catal. Commun., 2011, 12, 1228–1230 CrossRef CAS.
Footnotes |
| † Electronic supplementary information (ESI) available: Complete experimental procedures, supporting characterization techniques, data and the details for the prepared compounds are provided. See DOI: 10.1039/c7sc01365e |
| ‡ These authors contributed equally. |
| This journal is © The Royal Society of Chemistry 2017 |

