 Open Access Article
Precise synthesis of unique polydopamine/mesoporous calcium phosphate hollow Janus nanoparticles for imaging-guided chemo-photothermal synergistic therapy†
Manjie
Zhang
,
Lingyu
Zhang
,
Yidan
Chen
,
Lu
Li
*,
Zhongmin
Su
 and
Chungang
Wang
 *
*
College of Chemistry, Northeast Normal University, Changchun, 130024, P. R. China. E-mail: wangcg925@nenu.edu.cn; lil106@nenu.edu.cn
First published on 2nd October 2017
Abstract
Multifunctional polymer–inorganic Janus nanoparticles (JNPs) that simultaneously have therapeutic and imaging functions are highly desired in biomedical applications. Here, we fabricated spherical polydopamine/mesoporous calcium phosphate hollow JNPs (PDA/mCaP H-JNPs) via a novel and facile approach. The obtained PDA/mCaP H-JNPs were further selectively functionalized with indocyanine green (ICG) and methoxy-poly(ethylene glycol)thiol (PEG-SH) on PDA domains to achieve a superior photoacoustic (PA) imaging capability and stability, while the other mCaP sides with hollow cavities served as storage spaces and passages for the anti-cancer drug, doxorubicin (DOX). The resultant PEG–ICG–PDA/mCaP H-JNPs possess excellent biocompatibility, a competent drug loading capability, high photothermal conversion efficiency, strong near-infrared (NIR) absorbance, and pH/NIR dual-responsive properties, enabling the H-JNPs to be applied for PA imaging-guided synergistic cancer chemo-phototherapy in vitro and in vivo. Furthermore, the synthetic approach could be extended to prepare PDA/various mesoporous inorganic H-JNPs with spherical shapes for specific applications.
Introduction
Elaborately designed novel multifunctional theranostic agents are highly desired for efficient cancer therapy and diagnosis.1–6 Recently, Janus nanoparticles (JNPs) consisting of two domains of different chemical composition have drawn considerable attention for cancer theranostics because their tunable and controllable asymmetric structure allows for the enhancement of the multifunctionality, which maximizes the efficacy of simultaneous multimodal imaging and synergistic therapy compared to that of their individual counterparts.7–14 Generally, JNPs can be divided into three main categories: polymer–polymer, inorganic–inorganic, and polymer–inorganic hybrid particles with different morphologies such as dumbbell-like, half-raspberry-like, acorn-like, snowman-like and mushroom-like.15–23 Compared to polymer–polymer and inorganic–inorganic JNPs, polymer–inorganic JNPs are of great interest due to the totally different complementary chemistries with respect to both counterparts, which allows for the integration of diverse functions for biomedical applications. For the fabrication of polymer–inorganic JNPs, commonly used synthetic methods involve phase separation, immobilization and surface nucleation.24–28 To date, snowman-like polymer–Au JNPs have been prepared using different polymers, such as amphiphilic diblock copolymers (PS154-b-PAA60), PS-poly(isoprene), and polyaniline.24,29,30 Recently, Feyen et al. synthesized mushroom-like FexOy@poly(styrene-co-divinylbenzene)–SiO2 nanostructures via the partial encapsulation of FexOy in polymer nanospheres and the spatially controlled coating of SiO2 on the surface of the FexOy.9 However, so far there have been no reports on polymer–inorganic hollow JNPs (H-JNPs) with a spherical shape. In addition, the studies mentioned above are mainly focused on the synthesis of polymer–inorganic JNPs, and there are no reports on their biomedical applications in vivo due to a lack of space for loading anti-cancer drugs and the involvement of non-biodegradable or toxic organic polymers. Thus, the great challenge in this field is not only to develop a novel and facile synthetic strategy to precisely fabricate spherical polymer–inorganic H-JNPs with spatially separated functionalities, excellent biocompatibility, sufficient drug storage and effective response to stimuli capabilities, but also to further explore their application in imaging-guided synergistic cancer therapy.Herein, we present a novel, facile yet reproducible synthetic strategy for the fabrication of unique polydopamine/mesoporous calcium phosphate (PDA/mCaP) H-JNPs with spherical shapes under mild conditions for the first time. The as-fabricated PDA/mCaP H-JNPs were further preferentially decorated with methoxy-poly(ethylene glycol)thiol (PEG-SH) and indocyanine green (ICG) (designated as PEG–ICG–PDA/mCaP H-JNPs) on the PDA domains, while the other mCaP sides with hollow cavities were utilized as storage spaces and passages for the anti-cancer drug. Overall, the synthesized PEG–ICG–PDA/mCaP H-JNPs were designed to integrate the prominent drug storage capability, excellent photothermal conversion efficiency, NIR and pH dual-responsive drug release property and photoacoustic (PA) imaging capability into one single H-JNP that could act as a novel theranostic agent for PA imaging-guided chemo-photothermal cancer therapy.
Results and discussion
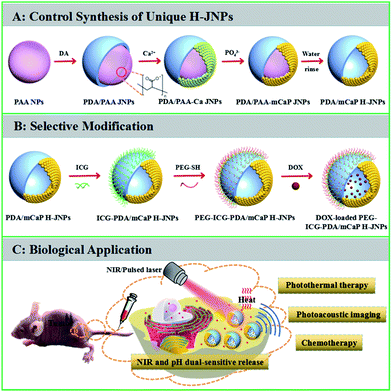
The synthetic strategy for the PEG–ICG–PDA/mCaP H-JNPs is elucidated in Scheme 1. The poly(acrylic acid) (PAA) NPs were firstly fabricated according to our previous report.31 Then, the controlled formation of PDA on one side of the PAA NPs was achieved upon the addition of dopamine hydrochloride (DA) to obtain well-dispersed PDA/PAA JNPs. The resulting PDA/PAA JNPs were further utilized as templates to selectively grow mCaP on the surface of the PAA domains via coordination between the carboxyl groups on the PAA surface and the calcium ions by introducing CaCl2, leaving the PDA domains untouched, and subsequently the addition of Na2HPO4 to achieve sandwich-like PDA/PAA-mCaP JNPs. Interestingly, the PAA inside the sandwich-like PDA/PAA-mCaP JNPs can be removed by washing with water due to the solubility of the PAA in water, thus forming PDA/mCaP H-JNPs with interior void spaces. To endow the PDA/mCaP H-JNPs with superior biocompatibility and imaging capabilities for cancer theranostics, PEG and ICG were added to functionalize the PDA domains. The other mCaP side with hollow cavities was used for the high-loading anticancer drug, doxorubicin (DOX). Lastly, the DOX-loaded H-JNPs were used as NIR and pH dual-stimuli responsive drug delivery vehicles for PA imaging-guided synergistic cancer therapy.Typically, the PAA NPs with diameters of about 120 nm were synthesized by adding isopropyl alcohol (IPA) dropwise into an aqueous mixture of ammonia and PAA at room temperature (Fig. 1A), where the pH value was 8.5. Subsequently, DA was introduced to polymerize on one side of the PAA NPs at 50 °C for 3.5 h to obtain PDA/PAA JNPs with diameters of 140 ± 20 nm (Fig. 1B), where the final ratio of water to IPA was about 1![[thin space (1/6-em)]](https://www.rsc.org/images/entities/char_2009.gif) :
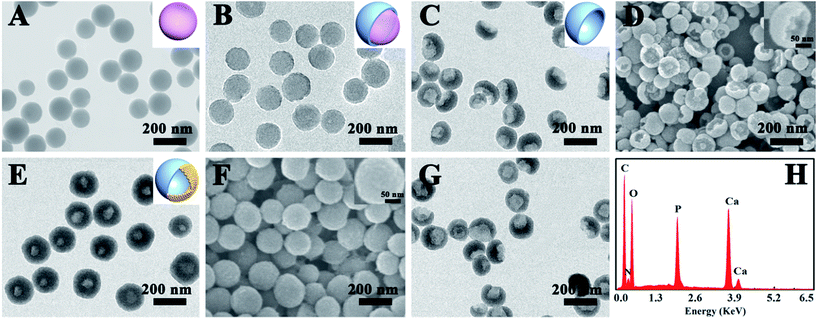
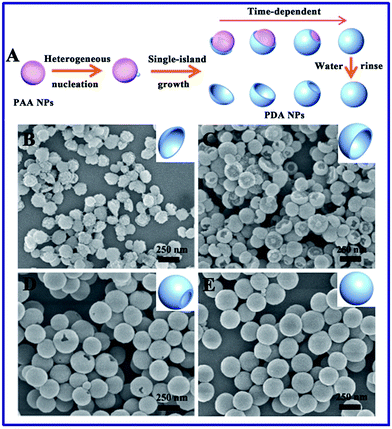
:![[thin space (1/6-em)]](https://www.rsc.org/images/entities/char_2009.gif) 3. The synthetic process is extremely simple, readily scalable, and highly reproducible. The reaction can be easily scaled up to 1000 mL, as shown in Fig. S1,† and produced the same well-dispersed PDA/PAA JNPs. The as-prepared PDA/PAA JNPs were washed with water to remove the PAA, generating bowl-like PDA NPs (Fig. 1C and D). The results strongly confirm the formation of PDA on one side of the PAA NPs, which is probably due to the island nucleation and anisotropic growth of PDA on the PAA templates. To better understand the mechanism of such bowl-like PDA nanostructures, we assume that the structural evolution of the PDA NPs was achieved at different reaction times after washing with water, as illustrated schematically in Fig. 2A. Firstly, with the start of the reaction, the polymerization of DA occurred at the PAA NPs to form PDA islands as seeds. Subsequently, the seed-mediated anisotropic growth process yielded PDA NPs with different shapes at different reaction times. This process is quite similar to the Volmer–Weber growth mode, through which the growth material often forms segregated islands on the seed NPs to reduce the number of interfaces.32–34 Importantly, the PAA NPs can simultaneously absorb and retain water, which provides basic conditions due to the involvement of an ammonia solution. In this way, DA was gradually polymerized on the surface of the PAA based on the PDA islands.36,41 To test this hypothesis, the morphological evolution process of the PDA NPs was examined using scanning electron microscopy (SEM) images as the reaction progressed. As shown in Fig. 2B–E, the morphology was gradually tuned from plate-like PDA NPs to bowl-like PDA NPs, then single-hole PDA NPs, and finally to intact PDA NPs without openings at different processing times. This variability in the product proves that the PAA NPs serve as templates for the island nucleation and anisotropic growth of the PDA NPs to obtain different morphologies by adjusting the reaction time. The importance of the PAA NPs in the preparation of bowl-like PDA NPs was further verified under identical conditions. Without the addition of the PAA NPs, only solid PDA NPs with diameters of approximately 100 nm and spherical shapes were formed before and after washing with water (Fig. S2†). These results demonstrate that the PAA NPs play crucial roles as templates in fabricating the PDA NPs with different shapes. In addition, the amount of DA is another important factor. The morphology of the synthesized PDA NPs varies from bowl-like NPs, to a mixture of single-hole NPs and bowl-like NPs, to total nanospheres by altering the amount of DA in the initial mixture (Fig. S3†), and they are not uniform in shape and size. This is probably because the polymerization rate is affected by the different amounts of DA. After using a series of optimized conditions, the bowl-like PDA NPs were fabricated by adding an amount of DA (3 mL, 5 mg mL−1) at 50 °C for 3.5 h.
3. The synthetic process is extremely simple, readily scalable, and highly reproducible. The reaction can be easily scaled up to 1000 mL, as shown in Fig. S1,† and produced the same well-dispersed PDA/PAA JNPs. The as-prepared PDA/PAA JNPs were washed with water to remove the PAA, generating bowl-like PDA NPs (Fig. 1C and D). The results strongly confirm the formation of PDA on one side of the PAA NPs, which is probably due to the island nucleation and anisotropic growth of PDA on the PAA templates. To better understand the mechanism of such bowl-like PDA nanostructures, we assume that the structural evolution of the PDA NPs was achieved at different reaction times after washing with water, as illustrated schematically in Fig. 2A. Firstly, with the start of the reaction, the polymerization of DA occurred at the PAA NPs to form PDA islands as seeds. Subsequently, the seed-mediated anisotropic growth process yielded PDA NPs with different shapes at different reaction times. This process is quite similar to the Volmer–Weber growth mode, through which the growth material often forms segregated islands on the seed NPs to reduce the number of interfaces.32–34 Importantly, the PAA NPs can simultaneously absorb and retain water, which provides basic conditions due to the involvement of an ammonia solution. In this way, DA was gradually polymerized on the surface of the PAA based on the PDA islands.36,41 To test this hypothesis, the morphological evolution process of the PDA NPs was examined using scanning electron microscopy (SEM) images as the reaction progressed. As shown in Fig. 2B–E, the morphology was gradually tuned from plate-like PDA NPs to bowl-like PDA NPs, then single-hole PDA NPs, and finally to intact PDA NPs without openings at different processing times. This variability in the product proves that the PAA NPs serve as templates for the island nucleation and anisotropic growth of the PDA NPs to obtain different morphologies by adjusting the reaction time. The importance of the PAA NPs in the preparation of bowl-like PDA NPs was further verified under identical conditions. Without the addition of the PAA NPs, only solid PDA NPs with diameters of approximately 100 nm and spherical shapes were formed before and after washing with water (Fig. S2†). These results demonstrate that the PAA NPs play crucial roles as templates in fabricating the PDA NPs with different shapes. In addition, the amount of DA is another important factor. The morphology of the synthesized PDA NPs varies from bowl-like NPs, to a mixture of single-hole NPs and bowl-like NPs, to total nanospheres by altering the amount of DA in the initial mixture (Fig. S3†), and they are not uniform in shape and size. This is probably because the polymerization rate is affected by the different amounts of DA. After using a series of optimized conditions, the bowl-like PDA NPs were fabricated by adding an amount of DA (3 mL, 5 mg mL−1) at 50 °C for 3.5 h.
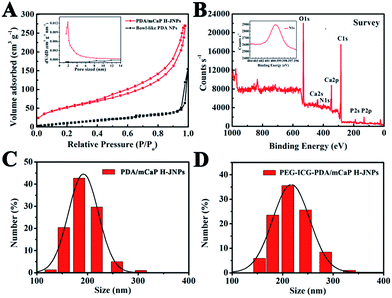
For the unique PDA/PAA JNPs, the PAA domains bearing abundant carboxylic groups are not only capable of absorbing and retaining water in the organic phase, making them excellent water-absorbents, but they can also coordinate with metal ions, making the PAA domains act as nanoreactors for the confined growth of inorganic NPs.35,36 Encouraged by these facts, the PDA/PAA JNPs obtained at 3.5 h were further employed to spatially and selectively coat a mCaP on the PAA domain. Initially, the PDA/PAA–Ca JNPs were fabricated by introducing calcium ions, which can coordinate with the carboxyl groups on the PAA surface. Upon the addition of Na2HPO4, sandwich-like PDA/PAA-mCaP JNPs were obtained, leaving the exposed surface of the PDA domains. Subsequently, the water soluble PAA inside the sandwich-like JNPs was removed by washing with water to generate novel PDA/mCaP H-JNPs with diameters of about 150 ± 20 nm and hollow cavities of around 50 nm (Fig. 1E and F), which are quite uniform, and a selected broken H-JNP indicates the formation of the hollow structure (Fig. S4†). To further clarify this Janus nanostructure, the H-JNPs were immersed in an acidic solution for dissolving the mCaP sides, and the morphology changed from spherical to bowl-like (Fig. 1G), agreeing with those depicted in the TEM image in Fig. 1C. Furthermore, a control experiment was performed to verify that the PDA domains were untouched. Upon the addition of CaCl2 and Na2HPO4 into the PDA NPs without PAA, the morphology and size remained unchanged, no CaP coating on the PDA NPs was observed, and no Ca and P appeared in the energy dispersive X-ray (EDX) spectra, indicating that there was no coordination between the o-dihydroxyl groups and the Ca2+ ions (Fig. S5†). These results confirm that the spherical H-JNPs were composed of separate PDA and CaP domains. The chemical composition of the PDA/mCaP H-JNPs was determined using an EDX spectrum, and C, O, N, Ca and P were detected (Fig. 1H). The N2 adsorption–desorption isotherm of the PDA/mCaP H-JNPs exhibits characteristic type-IV curves with an obvious hysteresis loop at a relative pressure of 0.4–0.9 (Fig. 3A), and the Brunauer–Emmett–Teller surface area of the PDA/mCaP H-JNPs is as high as 188.4 m2 g−1 compared to 11.6 m2 g−1 of the bowl-like PDA NPs, suggesting the formation of a mesoporous structure. Compared to the undetectable mesopores in the bowl-like PDA NPs, the H-PDA/mCaP JNPs show a sharp pore size distribution centered at approximately 2 nm, originating from the CaP sides. X-ray photoelectron spectrum (XPS) analysis was used to further confirm the successful coating of mCaP (Fig. 3B). The characteristic peak at around 32° in the X-ray diffraction spectra indicates the amorphous nature of the mCaP NPs (Fig. S6†).37 In addition, inductively coupled plasma atomic emission spectroscopy confirmed that the content of Ca was 18.5 wt%. All of these results indicate the successful synthesis of the PDA/mCaP H-JNPs.
To endow the PDA/mCaP H-JNPs with a superior imaging capability and to promote their stability and long circulation time, ICG and PEG were preferentially functionalized on the PDA domains via π–π electrostatic interactions and Michael addition reactions,38–41 respectively, resulting in the formation of PEG–ICG–PDA/mCaP H-JNPs. Dynamic light scattering (DLS) measurements reveal that the mean hydrodynamic diameters of the PDA/mCaP and PEG–ICG–PDA/mCaP H-JNPs are 190 and 216 nm, respectively, as shown in (Fig. 3C and D), and this difference in diameter is ascribed to the surface decoration of PEG and ICG on the PDA/mCaP H-JNPs. The presence of ICG on the surface of the H-JNPs was confirmed by the strong absorbance at 780 nm (Fig. S7†). Fourier transform infrared (FTIR) spectra further prove the successful mCaP coating and PEG grafting (Fig. S8†). These PEG–ICG–PDA/mCaP H-JNPs show excellent stability in different physiological solutions (Fig. S9†).
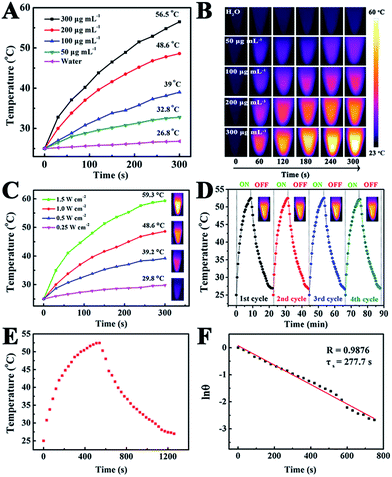
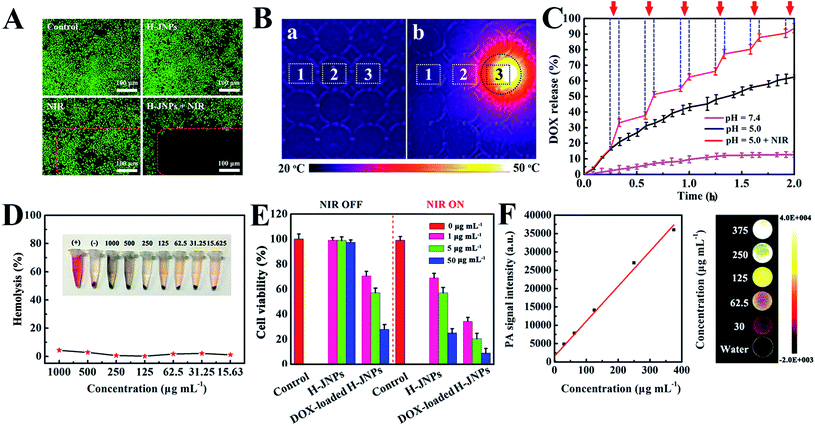
To reveal the photothermal property of the PEG–ICG–PDA/mCaP H-JNPs, H-JNP solutions of various concentrations were irradiated with a NIR laser (1 W cm−2). After 5 min of irradiation, the solution could be heated up to 56.5 °C and the pure water only increased by 1.8 °C (Fig. 4A). Meanwhile, the high thermal contrast produced by the H-JNPs showed that they had a high IR thermal (IRT) imaging property (Fig. 4B). The temperature increase was shown to be laser-power-dependent (Fig. 4C). When the H-JNPs were irradiated using NIR light for four cycles, the photothermal performance of the H-JNPs did not significantly change (Fig. 4D), and the size and morphology of the H-JNPs remained unchanged (Fig. S10†), suggesting that they had excellent photostability. In addition, the photothermal transduction efficiency (η) was calculated to be 45.3% (Fig. 4E and F), which prompted us to evaluate the intracellular photothermal therapeutic (PTT) effect.42–44 As expected, no apparent cell death could be observed when treated with a solo laser or the H-JNPs (Fig. 5A). Conversely, almost all of the cells are dead when treated with H-JNPs along with laser irradiation inside the region of the laser spot, since the IRT images of the cells show that only the well containing the H-JNPs could be heated highly (49 °C) under irradiation (Fig. 5B). These results suggest that the H-JNPs could transform laser energy into heat energy, which can kill cells as a promising PTT agent.
For an efficient drug delivery system, a high drug-loading capability and a stimuli-responsive drug release property have been recognized as two essential factors.45,46 In our system, the loading efficiency of DOX into the H-JNPs was as high as 92.0% (loading capacity = 0.73 mg DOX per mg H-JNPs; Fig. S11A†), which could be the main reason for the mesoporous structure of CaP and its hollow cavity. The pH-dependent drug release from the drug carriers was monitored over 12 h (Fig. S11B†). Meanwhile, the pH and NIR light triggered controllable release of DOX from the H-JNPs was investigated and is shown in Fig. 5C. A burst in the release of DOX (94.5%) can be observed at a pH of 5.0 with NIR light irradiation, which is about 1.5 times higher than that of the group that had a pH of 5.0 without NIR light (62.2%), and 7.4 times higher than that of the pH 7.4 group (12.7%). Such dramatically enhanced DOX release can be attributed to the structural disruption of the mCaP and the thermal effect derived from the H-JNPs, which realized pH and NIR dual-stimuli responsive DOX release. To verify the dissolution of mCaP, the increase in the Ca2+ content in PBS buffer (pH 5.0) was investigated as a function of time (Fig. S12†). In contrast, an extremely slow release of Ca2+ occurred at a pH of 7.4 and the structure of the H-JNPs was stable (Fig. S13†). All of the above results reveal that the H-JNPs can be used simultaneously as agents for PTT and potential drug carriers for pH/NIR dependent anti-tumor drug release.
Given the above results, we systematically investigated the biocompatibility of the H-JNPs and their therapy effect in vitro. First and foremost, the biocompatibility of the H-JNPs was tested, since it is the prerequisite for biomedical applications. The CellTiter-Blue cell viability assay shows that the H-JNPs exhibit negligible toxicity to cells at different concentrations (Fig. S14†). Moreover, we also detected their influence on the hemolysis of red blood cells. The H-JNPs with different concentrations show hemolysis that lower than 5.0% (Fig. 5D), revealing the good biocompatibility of the as-prepared H-JNPs. The cytotoxicity study of the H-JNPs with different treatments was conducted. As depicted in Fig. S14,† the DOX-loaded H-JNPs show comparable cytotoxicity with free DOX at the same concentration of DOX, suggesting that the H-JNPs can act as efficient drug delivery vehicles for cancer treatment. When the cancer cells were incubated with H-JNPs and were the subjected to 808 nm NIR laser irradiation at 1 W cm−2 for 5 min, enhanced cytotoxicity was observed with the increase of the dose, suggesting that NIR laser irradiation can cause dose dependent cancer cell death via PTT. In the control experiment, the cells were treated with an NIR laser under identical conditions and no significant influence on the viability of the cells was observed, further confirming that the death of the cells is caused by the localized heating generated by the H-JNPs. Moreover, the viability of the cells treated with both DOX-loaded H-JNPs and NIR laser irradiation is extremely low (9.0%) compared to that of other groups due to chemo-photothermal synergistic therapy effects (Fig. 5E).
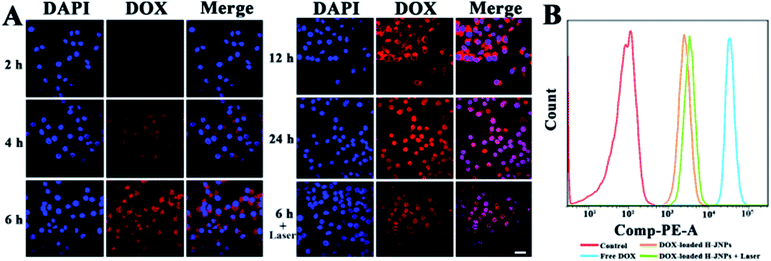
The cellular uptake and the intracellular release performance of the DOX-loaded H-JNPs were investigated via confocal laser scanning microscopy (CLSM). It can be observed that the red fluorescence of the DOX inside the HepG-2 cells increases along with the incubation time, indicating successful time-related cellular uptake. After a 6 h incubation, the cells were exposed to NIR illumination for 5 min (808 nm, 1 W cm−2), and considerably enhanced intracellular DOX fluorescence in both the cytoplasm and nucleus could be visualized in comparison to those without irradiation, implying that the NIR light would accelerate the drug release inside the cancer cells (Fig. 6A). The flow cytometry results were in line with those from using CLSM (Fig. 6B). It can be reasoned that the hyperthermia provided by the H-JNPs can increase the cellular internalization of the NPs through a promoted cellular metabolism and membrane permeability enhancement.47,48 These results show that the DOX-loaded H-JNPs can be engulfed by the cells and the release of DOX can be triggered by NIR light.
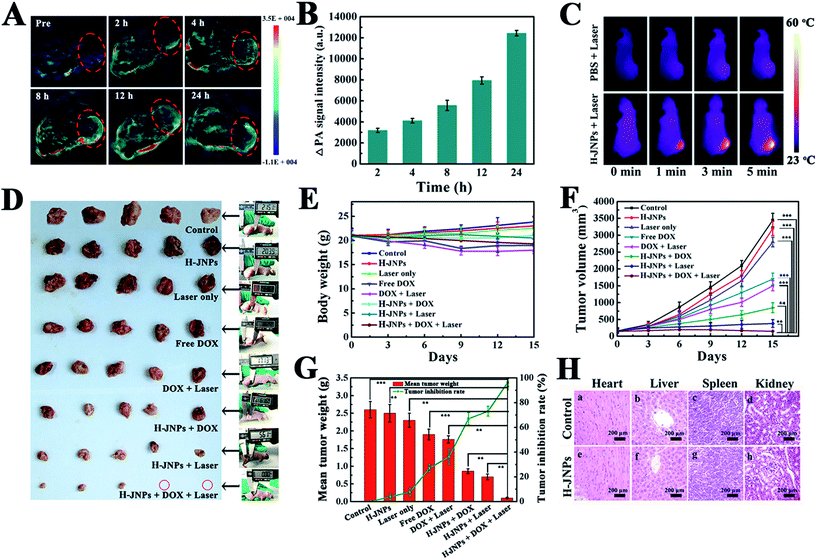
Encouraged by the results of absorbance of the H-JNPs in the NIR region, we first evaluated the PA signals of various concentrations of H-JNPs in aqueous solution. The PA signal linearly strengthened with an increase in the concentration of the H-JNPs, as shown in Fig. 5F. A nude mouse was intravenously injected with the H-JNPs and imaged at different time points. As indicated in Fig. 7A and B, the PA signals were enhanced with prolongation time around the tumor region. Notably, the highest PA signal appeared at 24 h (Fig. S15†), which was of importance to clearly illuminate the tumor site and was chosen as the optimal time for 808 nm irradiation to implement PTT. Fig. 7C shows that the local surface temperature of tumors sites rapidly reached 56 °C when they were treated with the H-JNPs under NIR irradiation at 1 W cm−2. On the other hand, a negligible increase was observed in the mice treated with PBS plus laser irradiation. These results reveal that the H-JNPs are excellent agents for PA imaging-guided cancer therapy.
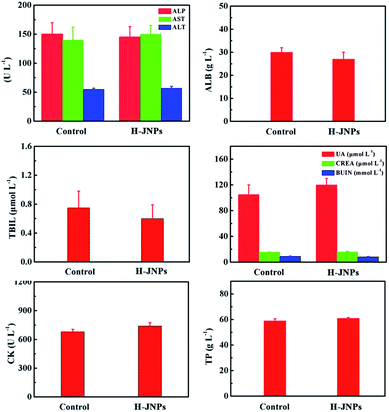
To assess the therapeutic effect in vivo, Balb/c nude mice were randomly divided into 8 groups for different treatments. There was no obvious difference in the weight changes among these groups except the free DOX and DOX with laser groups on day 9, demonstrating no significant acute toxicity of the therapeutic agents but a slight side effect of the free drug (Fig. 7E). Remarkably, there is an extreme difference in the tumor volume of the control group and the other treated groups (Fig. 7F). In the control group, the tumor volume exhibited a rapid increase in tumor size within 15 days. Meanwhile, the laser only group shows a similar tumor growth rate to the control group, revealing that the low temperature elevation from the NIR irradiation is not sufficient to kill the cancer cells. Moreover, the DOX-loaded H-JNPs group presents a significant delay in the tumor growth compared to the free DOX group, and this enhanced tumor inhibition of the DOX-loaded H-JNPs may be attributed to the sustained DOX release from the H-JNPs and the passive targeting in the tumor sites via the EPR effect.49,50 Notably, the mice injected with DOX-loaded H-JNPs and were subjected to NIR irradiation display significantly restrained tumor growth compared to the other groups, and this phenomenon can be ascribed to both the PTT effect and the improvement in the DOX release from the DOX-loaded H-JNPs when applying the NIR laser irradiation. On day 15, the mice tumors were excised and weighed. Photographs of the tumors from different treatments are displayed in Fig. 7D. The tumor size in the DOX-loaded H-JNPs under NIR laser irradiation group is the smallest and the tumor suppression is as high as 96.2% compared to the monotherapy, implying that there was an effective synergistic effect in vivo (Fig. 7G). Furthermore, no tissue damage could be found in the major organs between the PBS and H-JNPs injected groups assessed using H&E staining (Fig. 7H). The mice remained healthy with slightly increased body weight (Fig. S16†). Different biochemical parameters were tested, including liver and kidney function indicators. No physiologically significant difference (p > 0.05) was observed between the two groups, indicating that the administration of the H-JNPs caused no obvious dysfunction to the liver and kidneys (Fig. 8). All of the results demonstrate that our unique H-JNPs are promising for precise cancer theranostics.
Conclusions
In summary, we successfully fabricated unique polymer/mesoporous inorganic H-JNPs with spherical shapes, PDA/mCaP H-JNPs, via a facile and novel synthetic strategy for the first time, which involved three steps: anisotropic growth, selective coating and water washing. In the obtained PDA/mCaP H-JNPs, the exposed PDA domains were selectively functionalized with ICG and PEG to achieve a superior PA imaging capability, biocompatibility and stability, as well as long circulation time, and the hollow cavities and CaP domains with mesoporous structure served as storage spaces and passages for the anti-cancer drug, DOX. The resultant PEG–ICG–PDA/mCaP H-JNPs possess an excellent drug loading capability, high light-to-heat conversion efficiency, strong NIR absorbance and pH/NIR dual-responsive properties, and were employed as PA imaging-guided synergistic cancer chemo-phototherapy agents. Furthermore, the synthetic approach could be extended for preparing spherical PDA/various mesoporous inorganic H-JNPs for specific applications. Taken together, such unique multifunctional H-JNPs provide an intriguing nanoplatform for imaging-guided combined therapy, which will undoubtedly be promising for the development of a new generation of cancer treatment materials in the future.Experimental
Materials
Dopamine hydrochloride (98%), doxorubicin hydrochloride (DOX), PEG-SH (Mw ≈ 5000), indocyanine green (ICG, 99%) and polyacrylic acid (PAA, Mw ≈ 1800) were bought from Sigma (USA). Deionized water was used throughout this study.Characterization
Fourier transform infrared (FTIR) spectra were obtained using a Magna 560 FTIR spectrometer (Nicolet, USA). Transmission electron microscopy (TEM) was performed on a JEOL-2100F transmission electron microscope using a 200 kV accelerating voltage. Scanning electron microscopy (SEM) images and the energy dispersive X-ray (EDX) spectrum were recorded on an XL30 ESEM-FEG field-emission scanning electron microscope (FEI Co.). The N2 adsorption/desorption measurements were performed using an intelligent gravimetric analyzer Autosorb-iQ (Quantachrome). X-ray diffraction (XRD) patterns were obtained using a D8 Focus diffractometer (Bruker) with CuKα radiation (l = 0.15405 nm). The X-ray photoelectron spectrum (XPS) was recorded using an ECSALAB 250 with non-monochromatized Al Kα radiation. Ultraviolet-visible (UV-vis) absorption spectroscopy was performed using a U-3010 spectro-photometer (Hitachi, Japan). UV-vis-NIR absorption spectra were recorded using a Cary 500 UV-vis spectrophotometer (Varian, USA). Confocal laser scanning microscopy (CLSM) was performed using an Olympus Fluoview FV1000. A continuous-wave (CW) diode laser (LSR808H) with a wavelength of 808 nm was used for the laser irradiation experiments (with a power density of 1 W cm−2). Fluorescence spectra were recorded on an Olympus DP73 spectrometer. Thermal imaging was performed using a T460SC infrared camera (FLIR, Sweden). A MSOT inVision 128 small animal imaging system (iThera Medical GmbH, Munich, Germany) was used for the photoacoustic (PA) imaging.Controllable synthesis of the PDA/PAA JNPs
Firstly, PAA (200 μL, 0.2 g mL−1) and NH3·H2O (200 μL, 25–28%) were added to 7 mL of water whilst stirring for 10 min at room temperature. Then, 30 mL of IPA was added dropwise to the flask to achieve well-dispersed PAA NPs. Subsequently, 3 mL samples of dopamine hydrochloride with different concentrations (5, 8 and 13 mg mL−1) were injected into the mixture at 50 °C, where the final volume ratio of water to IPA was 1![[thin space (1/6-em)]](https://www.rsc.org/images/entities/char_2009.gif) :
:![[thin space (1/6-em)]](https://www.rsc.org/images/entities/char_2009.gif) 3. After polymerization for different time intervals (2, 3.5, 5 and 9 h), the unreacted reagents were removed via centrifugation, followed by re-dispersion in 40 mL of IPA. The PDA/PAA NPs were then washed with water to clearly visualize the morphologies of the obtained NPs. After using a series of optimized conditions, bowl-like PDA NPs were fabricated with good dispersity by adding dopamine hydrochloride (3 mL, 5 mg mL−1) into the mixture at 50 °C for 3.5 h.
3. After polymerization for different time intervals (2, 3.5, 5 and 9 h), the unreacted reagents were removed via centrifugation, followed by re-dispersion in 40 mL of IPA. The PDA/PAA NPs were then washed with water to clearly visualize the morphologies of the obtained NPs. After using a series of optimized conditions, bowl-like PDA NPs were fabricated with good dispersity by adding dopamine hydrochloride (3 mL, 5 mg mL−1) into the mixture at 50 °C for 3.5 h.
Synthesis of the spherical PDA NPs
For the preparation of the PDA NPs with diameters of about 100 nm, NH3·H2O (200 μL, 25–28%) was mixed with IPA (30 mL) and water (7 mL) at 50 °C. After vigorous stirring for 10 min, 3 mL of dopamine hydrochloride (5 mg mL−1) was added into the above reaction system. The solution was allowed to react for 3.5 h, yielding the final PDA NPs.Synthesis of the PDA/mCaP H-JNPs
400 μL of NH3·H2O solution was added to 40 mL of as-prepared PDA/PAA JNP solution. In succession, 200 μL of CaCl2 (0.8 mM) was injected dropwise into the solution at room temperature for 4 h. Then, 35 mg of Na2HPO4 was dropped into the above mixed suspension with magnetic stirring for more than 48 h. Finally, the PDA/mCaP H-JNPs were collected via centrifugation at 8000 rpm for 6 min and were washed with water several times.Synthesis of the ICG-PDA/mCaP H-JNPs
300 μL of ICG solution (1 mg mL−1) was added dropwise to 4 mL of PDA/mCaP H-JNP solution (0.5 mg mL−1). The mixture was then stirred at room temperature for 6 h under dark conditions.Preparation of the PEG–ICG–PDA/mCaP H-JNPs
1 mL of PEG-SH (80 mg mL−1 in H2O) was added dropwise into 10 mL of hollow ICG-PDA/mCaP solution (1 mg mL−1, pH = 10) under sonication for 20 min, and then the mixed solution was left overnight. After that, the PEG–ICG–PDA/mCaP H-JNPs were achieved by centrifuging and washing with water to remove the free PEG.Measurement of the photothermal effect
To determine the photothermal effect, the PEG–ICG–PDA/mCaP H-JNPs with different concentrations in centrifuge tubes were exposed to an 808 nm NIR laser (1 W cm−2, 300 s). The temperatures of the solutions was measured using a digital thermometer. The details of calculations are given in the ESI.†DOX loading and release
The drug-loaded H-JNPs were prepared by mixing DOX aqueous solution (10 mg mL−1, 40 μL) with 1 mL of PEG–ICG–PDA/mCaP H-JNP solution (0.5 mg mL−1). The pH value of the solution for the DOX loading was ∼7. The mixture was shaken for 24 h. Then, the solution was centrifuged and washed three times with water to remove the DOX that had adsorbed on the surface. The DOX-loading efficiency (DLE) was calculated using eqn (1): | (1) |
The pH/NIR dual-stimuli responsive controlled release of DOX was evaluated using UV-vis spectroscopy with a wavelength of 480 nm. Firstly, two equal portions of the obtained DOX-loaded PEG–ICG–PDA/mCaP H-JNPs were added to PBS (1 mL) at pH values of 7.4 and 5.0, respectively, at 37 °C. To verify that laser irradiation can accelerate the drug release, the same amount of DOX-loaded PEG–ICG–PDA/mCaP H-JNPs was injected into PBS buffer at pH 5.0 with 808 nm NIR laser irradiation at the selected time interval. In addition, the Ca2+ content in the supernatants of the PEG–ICG–PDA/mCaP H-NPs (1 mg) in PBS buffer (pH 5.0 and 7.4) at the selected time intervals were determined using ICP-AES.
Cytotoxicity studies in vitro
The chemo-photothermal cytotoxicity was estimated via a standard CellTiter-Blue cell viability assay. HepG-2 cells were plated in 96-well plates at a density of 7 × 10³ cells per well. The medium was replaced with serum-free medium containing free DOX, PEG–ICG–PDA/mCaP H-JNPs and DOX-loaded PEG–ICG–PDA/mCaP H-JNPs of various concentrations for another 24 h, respectively. The cells incubated with the above samples with and without NIR laser irradiation (1 W cm−2, 5 min) were used to assess the photothermal-induced cytotoxicity effect. The concentrations of free DOX were at the same level as the DOX concentrations in the DOX-loaded H-JNPs. The HepG-2 cells were incubated with the above samples (0.375, 0.75, 3.75, 7.5, 37.5 and 75 μg mL−1). After incubation, the medium was removed and 0.1 mL of free DMEM containing 10 μL of CellTiter-Blue reagent was added into each well, and then incubated for another 4 h. The absorbance was detected using a microplate reader (λex = 560 nm, λem = 590 nm). The cell viability was measured using eqn (2): | (2) |
Hemolysis assay of the PEG–ICG–PDA/mCaP H-JNPs
Hemolysis tests were carried out using human blood to evaluate the hematotoxicity of the PEG–ICG–PDA/mCaP H-JNPs in vitro. Red blood cells were obtained by centrifuging five times to remove the serum and were washed with physiological saline. After that, 0.3 mL of diluted cell suspension (10%) was mixed with 1.2 mL of PBS (as a negative control), 1.2 mL of water (as a positive control), and 1.2 mL of the product suspensions with various concentrations. The nine samples were shaken for 2 h. After that, the mixtures were centrifuged at 3000 rpm for 3 min and the hemolysis percentage was calculated as follows: | (3) |
Cell uptake assay
CLSM was used to examine the cellular uptake. The HepG-2 cells were incubated in fresh DMEM medium containing DOX-loaded PEG–ICG–PDA/mCaP H-JNPs (3 μg mL−1) for a specific time (2, 4, 6, 12 and 24 h, respectively). The cells were stained with 4,6-diamino-2-phenylindole (DAPI) for 10 min, after rinsing with PBS, and directly subjected to fluorescence imaging.To study the NIR light triggering drug release in vitro, HepG-2 cells were seeded in a confocal dish containing PEG–ICG–PDA/mCaP H-JNPs for 6 h. After rinsing with PBS, the incubated HepG-2 cells were irradiated using an 808 nm NIR laser (1 W cm−2, 5 min).
Flow cytometry
HepG-2 cells were incubated in DMEM medium (2 mL) containing DOX-loaded PEG–ICG–PDA/mCaP H-JNPs (3 μg mL−1) for 6 h and then irradiated with an 808 nm laser (1 W cm−2, 5 min). Afterwards, the cells were trypsinized, harvested, washed with PBS twice and analyzed using BD FACSCanto™ II Flow Cytometry.Photothermal ablation in vitro
The HepG-2 cells were divided into four groups: group 1 were incubated with PBS (as the control); group 2 were incubated with PEG–ICG–PDA/mCaP H-JNPs (25 μg mL−1); group 3 were incubated with NIR only and group 4 were incubated with PEG–ICG–PDA/mCaP H-JNPs + NIR laser. Finally, calcein AM was used to stain the cells to detect the photothermal effect using fluorescence microscopy.PA imaging in vitro
Agar gel cylinders with a diameter of 3 mm containing different concentrations of PEG–ICG–PDA/mCaP H-JNPs (0, 30, 62.5, 125, 250 and 375 μg mL−1) were fabricated and the PA signals of these cylinders were obtained at 808 nm.Infrared thermal (IRT) and PA imaging
Balb/c nude mice were purchased from the Changchun Institute of Biological Products and all of the animal procedures were approved by the University Animal Care and Use Committee. The HepG-2 tumor-bearing Balb/c nude mice were separately treated with PEG–ICG–PDA/mCaP H-JNPs (200 μL, 1.5 mg mL−1) and PBS (200 μL). 24 h after they were intravenously injected, the tumors were irradiated with the 808 nm laser (1 W cm−2, 5 min), and thermal images were recorded at different time points.For the PA imaging, a MSOT inVision 128 small animal imaging system was used. A HepG-2 tumor-bearing Balb/c nude mouse was injected intravenously with PEG–ICG–PDA/mCaP H-JNPs (200 μL, 7.5 mg mL−1). The mice were anaesthetized with 2% isoflurane throughout the experiments.
Combination therapy in vivo
When the tumors grew to 200 mm3, the HepG-2 tumor-bearing Balb/c nude mice were randomly assigned to eight groups, which were intravenously injected with 200 μL of PBS (control group), PDA-ICG-PEG/mCaP H-JNPs (3.3 mg kg−1), PBS with NIR irradiation, free DOX, free DOX plus laser, DOX-loaded PEG–ICG–PDA/mCaP H-JNPs (in terms of 2.5 mg kg−1 DOX, and in terms of 3.3 mg kg−1 PDA-ICG-PEG/mCaP H-JNPs), PEG–ICG–PDA/mCaP H-JNPs with NIR laser and DOX-loaded PEG–ICG–PDA/mCaP H-JNPs with NIR irradiation. After 24 h, the tumors were irradiated with or without NIR irradiation (1 W cm−2, 5 min). The tumor volume (V, mm3) was calculated to be V = (width2 × length)/2. At day 15, all of the mice were sacrificed and the tumor growth inhibition rate was calculated according to the formula for the inhibition: (%) = (C − T)/C × 100, where T is the average tumor weight of each treated group and C expresses the average tumor weight of the control group.Histology examination and blood analysis
After 15 days, the tissues (heart, spleen, liver and kidneys) were collected from the PEG–ICG–PDA/mCaP H-JNPs and PBS groups and 10% formalin solution was added dropwise. The tissue sections were stained with H&E. Finally, an optical microscope was used to detect the histological sections.In order to evaluate the toxicity and side effects of the PEG–ICG–PDA/mCaP H-JNPs, healthy and tumor-free Balb/c mice were used as the subjects. The mice were randomly divided into two groups (5 mice per group). One group of mice were injected with the PEG–ICG–PDA/mCaP H-JNPs (20 mg kg−1) via the tail vein. Other healthy mice were used as the untreated control. Approximately 0.8 mL of blood from each mouse was collected for a blood chemistry test and complete blood panel analysis before the mouse was euthanatized. The results show the mean and standard deviation of the liver function markers (alkaline phosphatase (ALP), aspartate aminotransferase (AST), and alanine aminotransferase (ALT)), albumin (ALB), total bilirubin (TBIL), renal function markers (creatinine (CREA), uric acid (UA), and blood urea nitrogen (BUN)), creatine kinase (CK), and total protein (TP).
Conflicts of interest
There are no conflicts of interest to declare.Acknowledgements
Manjie Zhang and Lingyu Zhang contributed equally to this work. We would like to thank the National Natural Science Foundation of China (21573040 and 21301027), the Natural Science Foundation and Science and Technology Development Planning of Jilin Province (20140520088JH and 20150204086GX), the Program for New Century Excellent Talents in University (NCET-13-0720), the Fundamental Research Funds for the Central Universities (2412016KJ007 and 2412016KJ020), Jilin Provincial Research Foundation for Basic Research (20160519012JH) and Jilin Provincial Key Laboratory of Micro-Nano Functional Materials (Northeast Normal University).Notes and references
- D. M. Yang, P. A. Ma, Z. Y. Hou, Z. Y. Cheng, C. X. Li and J. Lin, Chem. Soc. Rev., 2015, 44, 1416–1448 RSC.
- S. L. Gai, C. X. Li, P. P. Yang and J. Lin, Chem. Rev., 2014, 114, 2343–2389 CrossRef CAS PubMed.
- Y. L. Dai, H. H. Xiao, J. H. Liu, Q. H. Yuan, P. A. Ma, D. M. Yang, C. X. Li, Z. Y. Cheng, Z. Y. Hou, P. P. Yang and J. Lin, J. Am. Chem. Soc., 2013, 135, 18920–18929 CrossRef CAS PubMed.
- L. Rao, L. L. Bu, Q. F. Meng, B. Cai, W. W. Deng, A. Li, K. Y. Li, S. S. Guo, W. F. Zhang, W. Liu, Z. J. Sun and X. Z. Zhao, Adv. Funct. Mater., 2017, 27 DOI:10.1002/adfm.201604774.
- L. Rao, B. Cai, L. L. Bu, Q. Q. Liao, S. S. Guo, X. Z. Zhao, W. F. Dong and W. Liu, ACS Nano, 2017, 11, 3496–3505 CrossRef CAS PubMed.
- L. Rao, L. L. Bu, B. Cai, J. H. Xu, A. Li, W. F. Zhang, Z. J. Sun, S. S. Guo, W. Liu, T. Wang and X. Z. Zhao, Adv. Mater., 2016, 28, 3460–3466 CrossRef CAS PubMed.
- Y. J. Liu, X. Y. Yang, Z. Q. Huang, P. Huang, Y. Zhang, L. Deng, Z. T. Wang, Z. J. Zhou, Y. Liu, H. Kalish, N. M. Khachab, X. Y. Chen and Z. H. Nie, Angew. Chem., Int. Ed., 2016, 55, 15297–15300 CrossRef CAS PubMed.
- I. Schick, S. Lorenz, D. Gehrig, A.-M. Schilmann, H. Bauer, M. Panthöfer, K. Fischer, D. Strand, F. Laquai and W. Tremel, J. Am. Chem. Soc., 2014, 136, 2473–2483 CrossRef CAS PubMed.
- M. Feyen, C. Weidenthaler, F. Schüth and A. H. Lu, J. Am. Chem. Soc., 2010, 132, 6791–6799 CrossRef CAS PubMed.
- X. M. Li, L. Zhou, Y. Wei, A. M. El-Toni, F. Zhang and D. Y. Zhao, J. Am. Chem. Soc., 2014, 136, 15086–15092 CrossRef CAS PubMed.
- J. Hu, S. X. Zhou, Y. Y. Sun, X. S. Fang and L. M. Wu, Chem. Soc. Rev., 2012, 41, 4356–4378 RSC.
- L. Y. Zhang, Y. Y. Chen, Z. L. Li, L. Li, P. Saint-Cricq, C. X. Li, J. Lin, C. G. Wang, Z. M. Su and J. Zink, Angew. Chem., Int. Ed., 2016, 55, 2118–2121 CrossRef CAS PubMed.
- D. Shao, X. Zhang, W. L. Liu, F. Zhang, X. Zheng, P. Qiao, J. Li, W. F. Dong and L. Chen, ACS Appl. Mater. Interfaces, 2016, 8, 4303–4308 CAS.
- D. Shao, J. Li, X. Zheng, Y. Pan, Z. Wang, M. Zhang, Q. X. Chen, W. F. Dong and L. Chen, Biomaterials, 2016, 100, 118–133 CrossRef CAS PubMed.
- L. C. Bradley, K. J. Stebe and D. Lee, J. Am. Chem. Soc., 2016, 138, 11437–11440 CrossRef CAS PubMed.
- W. Kim, D. Lee, H. C. Shum and D. A. Weitz, Adv. Mater., 2008, 20, 3239–3243 CrossRef.
- L. Cheng, G. Zhang, L. Zhu, D. Chen and M. Jiang, Angew. Chem., Int. Ed., 2008, 47, 10171–10174 CrossRef CAS PubMed.
- Z. W. Seh, S. Liu, S. Zhang, M. S. Bharathi, H. Ramanarayan, M. Low, K. W. Shah, Y. Zhang and M. Han, Angew. Chem., Int. Ed., 2011, 50, 10140–10143 CrossRef CAS PubMed.
- C. Xu, B. Wang and S. Sun, J. Am. Chem. Soc., 2009, 131, 4216–4217 CrossRef CAS PubMed.
- B. H. Wu, S. H. Tang, M. Chen and N. F. Zheng, Chem. Commun., 2014, 50, 174–176 RSC.
- S. Yin, C. Wang, Z. Yu, J. Wang, S. Liu and S. Chen, Adv. Mater., 2011, 23, 2915–2919 CrossRef CAS PubMed.
- H. Xing, Z. Wang, Z. Xu, N. Y. Wong, Y. Xiang, G. Liu and Y. Lu, ACS Nano, 2012, 6, 802–809 CrossRef CAS PubMed.
- Q. Chen, S. C. Bae and S. Granick, Nature, 2011, 469, 381–384 CrossRef CAS PubMed.
- T. Chen, M. X. Yang, X. J. Wang, L. H. Tan and H. Y. Chen, J. Am. Chem. Soc., 2008, 130, 11858–11859 CrossRef CAS PubMed.
- A. Ohnuma, E. C. Cho, P. H. C. Camargo, L. Au, B. Ohtani and Y. Xia, J. Am. Chem. Soc., 2009, 131, 1352–1353 CrossRef CAS PubMed.
- J. He, Y. J. Liu, T. C. Hood, P. Zhang, J. L. Gong and Z. H. Nie, Nanoscale, 2013, 5, 5151–5166 RSC.
- B. Wang, B. Li, B. Zhao and C. Y. Li, J. Am. Chem. Soc., 2008, 130, 11594–11595 CrossRef CAS PubMed.
- B. Liu, H. Mohwald and D. Y. Wang, Chem. Commun., 2013, 49, 9746–9748 RSC.
- H. Yabu, K. Koike, K. Motoyoshi, T. Higuchi and M. Shimomura, Macromol. Rapid Commun., 2010, 31, 1267–1271 CrossRef CAS PubMed.
- S. X. Xing, Y. H. Feng, Y. Y. Tay, T. Chen, J. Xu, M. Pan, J. T. He, H. H. Hng, Q. Y. Yan and H. Y. Chen, J. Am. Chem. Soc., 2010, 132, 9537–9539 CrossRef CAS PubMed.
- S. N. Li, L. Y. Zhang, T. T. Wang, L. Li, C. G. Wang and Z. M. Su, Chem. Commun., 2015, 51, 14338–14341 RSC.
- Y. H. Feng, J. He, H. W. Wang, Y. Y. Tay, H. Sun, L. Zhu and H. Y. Chen, J. Am. Chem. Soc., 2012, 134, 2004–2007 CrossRef CAS PubMed.
- B. Y. Guan, L. Yu and X. W. Lou, J. Am. Chem. Soc., 2016, 138, 11306–11311 CrossRef CAS PubMed.
- Y. H. Feng, Y. W. Wang, J. T. He, X. H. Song, Y. Y. Tay, H. H. Hng, X. Y. Ling and H. Y. Chen, J. Am. Chem. Soc., 2015, 137, 7624–7627 CrossRef CAS PubMed.
- L. L. Chen, L. Li, L. Y. Zhang, S. X. Xing, T. T. Wang, Y. A. Wang, C. G. Wang and Z. M. Su, ACS Appl. Mater. Interfaces, 2013, 5, 7282–7290 CAS.
- B. P. Bastakoti, M. Inuoe, S. Yusa, S. H. Liao, K. C. Wu, K. Nakashima and Y. Yamauchi, Chem. Commun., 2012, 48, 6532–6534 RSC.
- Y. B. Li, T. Wiliana and K. C. Tam, Mater. Res. Bull., 2007, 42, 820–827 CrossRef CAS.
- D. H. Hu, C. B. Liu, L. Song, H. D. Cui, G. H. Gao, P. Liu, Z. H. Sheng and L. T. Cai, Theranostics, 2016, 6, 1043–1052 CrossRef CAS PubMed.
- X. Y. Zhong, K. Yang, Z. L. Dong, X. Yi, Y. Wang, C. C. Ge, Y. L. Zhao and Z. Liu, Adv. Funct. Mater., 2015, 25, 7327–7336 CrossRef CAS.
- J. Park, T. F. Brust, H. J. Lee, S. C. Lee, V. J. Watts and Y. Yeo, ACS Nano, 2014, 8, 3347–3356 CrossRef CAS PubMed.
- Y. L. Liu, K. L. Ai and L. H. Lu, Chem. Rev., 2014, 114, 5057–5115 CrossRef CAS PubMed.
- P. Huang, P. F. Rong, J. Lin, W. W. Li, X. F. Yan, M. G. Zhang, L. M. Nie, G. Niu, J. Lu, W. Wang and X. Chen, J. Am. Chem. Soc., 2014, 136, 8307–8313 CrossRef CAS PubMed.
- W. Q. Wang, L. Wang, Y. Li, S. Liu, Z. G. Xie and X. B. Jing, Adv. Mater., 2016, 28, 9320–9325 CrossRef CAS PubMed.
- W. S. Chen, K. Zeng, H. Liu, L. Q. Wang, Y. Liu, H. Wang, L. Deng and L. Y. Nan, Adv. Funct. Mater., 2017, 27 DOI:10.1002/adfm.201605795.
- S. Mura, J. Nicolas and P. Couvreur, Nat. Mater., 2013, 12, 991–1003 CrossRef CAS PubMed.
- L. Zhou, Z. W. Chen, K. Dong, M. L. Yin, J. S. Ren and X. G. Qu, Adv. Mater., 2014, 26, 2424–2430 CrossRef CAS PubMed.
- Z. Li, H. Ying, K. A. Howard, T. T. Jiang, X. L. Fang, Z. H. Miao, Y. Sun and F. Besenbacher, ACS Nano, 2016, 10, 984–997 CrossRef CAS PubMed.
- T. T. Zheng, G. G. Li, F. Zhou, R. Wu, J. J. Zhu and H. Wang, Adv. Mater., 2016, 28, 8218–8226 CrossRef CAS PubMed.
- H. Liu, D. Chen, L. Li, T. Liu, L. Tan, X. Wu and F. Tang, Angew. Chem., Int. Ed., 2011, 50, 891–895 CrossRef CAS PubMed.
- N. Lee, D. Yoo, D. S. Ling, H. C. Mi, T. Hyeon and J. Cheon, J. Chem. Rev., 2015, 115, 10637–10689 CrossRef CAS PubMed.
Footnote |
| † Electronic supplementary information (ESI) available: FTIR spectroscopy, UV-vis absorption spectra, XRD, etc. See DOI: 10.1039/c7sc03521g |
| This journal is © The Royal Society of Chemistry 2017 |

