Synthesis of a nano-sized hybrid C3N4/TiO2 sample for enhanced and steady solar energy absorption and utilization†
Junqing
Yan
*a,
Ping
Li
a,
Hui
Bian
a,
Huan
Wu
a and
Shengzhong (Frank)
Liu
 *ab
*ab
aA Key Laboratory of Applied Surface and Colloid Chemistry, National Ministry of Education, Shaanxi Key Laboratory for Advanced Energy Devices, Shaanxi Engineering Lab for Advanced Energy Technology, School of Materials Science and Engineering, Shaanxi Normal University, Xi'an, 710119, P. R. China. E-mail: junqingyan@snnu.edu.cn; liusz@snnu.edu.cn
bState Key Laboratory of Catalysis, iChEM, Dalian Institute of Chemical Physics, Dalian National Laboratory for Clean Energy, Chinese Academy of Sciences, Dalian, 116023, P. R. China
First published on 21st January 2017
Abstract
The effect of maximum incident light absorption, conversion and utilization by a semiconductor on solar fuel generation was investigated in this study. Sub-15 nm g-C3N4–TiO2 (CN–TiO2) was synthesized through a hydrothermal process at a relatively high temperature. Three samples with different TiO2 sizes, i.e. 9, 12 and 15 nm, were obtained by changing the pH of solution and named CN–TiO2-9, CN–TiO2-12 and CN–TiO2-15. Based on the Mie scattering law, the nano-sized heterojunction samples can achieve almost 100% incident light absorption without reflection. Characterization results from XRD and FTIR indicate that the samples are composed of protonated g-C3N4 and anatase TiO2. Further results from TEM images provide information on the size of the synthesized hybrid samples. It is established that the two components together show sub-15 nm particle size. The nano-sized heterojunction delivered considerable solar-to-hydrogen conversion efficiency with the apparent quantum yield (AQY) of 6.9% under 405 nm visible light irradiation. Moreover, it is interesting to find that the AQY values do not decrease when increasing the incident photon flux. The large absorption cross-section area and the prolonged lifetime of photogenerated carriers of the sub-15 nm CN–TiO2 heterojunction are the origin of the high photon-to-electron conversion.
1. Introduction
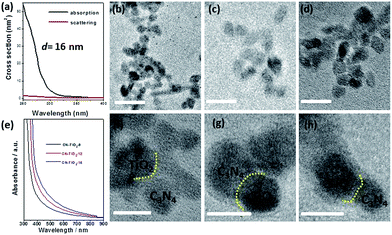
Solar energy is regarded as the sustainable clean substitute for limited traditional fossil fuel energy and can ameliorate the current global problems of climate change and environmental issues.1–12 However, the sunlight photoconversion presently achieved by semiconductors is always hindered by the intermittence of weather regimes, that is to say, the solar intensity possesses the inevitable effect on photoexcitation and application of semiconductors.13–23 To receive constant and stable power from solar energy, it is necessary to develop semiconductor systems with considerable steady light absorption and excitation abilities. Steady solar response indicates constant absorption and utilization of small or large numbers of incident photons as well as maximizing their absorption and utilization consistently. To accomplish this goal, two import aspects should be satisfied: the first one is large absorption cross-section and the second is excellent separation ability of photogenerated carriers. The applicable and appropriate semiconductor candidate for the steady light response should act as the conducting bridge for fully converting the incident photon to chemical energy.24–33Nano-sized semiconductor particles are well-known for the following distinctive properties: large photo-absorption cross-section, low reflectance, large specific surface area, more exposed reaction sites, and significantly short photogenerated charge migration distance.34–41 Thus far, several nano-sized semiconductor systems have been developed; for example, the sub-10 nm rutile TiO2 system reported by our group with significantly more surface to bulk defect ratio.14 It should be mentioned that the key challenge to achieve high photo-electric conversion efficiency under different incident light intensities, is to develop a good semiconductor that can provide high carrier separation efficiency.41,42 Numerous approaches have been proposed, such as the construction of a heterojunction system, to achieve high photo-electric conversion efficiency.42 To the best of our knowledge, to date, the nano-sized (such as, ca. 15 nm) semiconductor heterojunction system has not been systematically reported for the application of weak light response. Regarding the abovementioned issues and with the intention of obtaining the maximum absorption of incident light, we herein first carried out electromagnetism calculations based on the Mie scattering law to disclose the optical properties of the samples, as shown in Fig. 3(a). When the size is ca. 16 nm, the small semiconductor nanoparticles will show the negligible reflection effect, at the same time the scattering cross-section of the nanoparticle is almost zero to the photon with wavelength larger than 200 nm, indicating that all interacted light is absorbed by the nanoparticles.
Our recent study suggests that an assembled TiO2/C3N4 hybrid nanostructure obtained through a one-pot hydrothermal process can achieve considerable photogenerated carrier separation.43 However, the g-C3N4 component presents a relatively large size, which may have a negative effect on the absorption of incident light; this indirectly lowers the solar-to-chemical conversion efficiency. Based on above discussion, in this study, we report a new heterojunction system of two compositions, i.e. TiO2 and g-C3N4 with a tight contact and nanoparticles smaller than 10 nm, which is synthesized through a one-pot hydrothermal treatment at a temperature of 180 °C making use of TiCl4 and bulk g-C3N4 treated with concentrated nitric acid. Furthermore, the size of the TiO2 particles can be slightly regulated by controlling the pH of the reaction solution.15 The obtained CN–TiO2 samples gave steady solar-to-hydrogen conversion under different intensities of incident light with the apparent quantum yields (AQYs) of 70% and 6.9% for 365 and 405 nm LED lamp irradiation, respectively.
2. Experimental
2.1 Preparation of photocatalysts
All of the chemical reagents with analytical grade were purchased from Alfa Aesar Chemical Co. and used as received without further purification. Distilled water was used in all experiments.To regulate the particle size of the TiO2, the PH of the reaction solution was slightly changed using NaOH solution.
2.2 Characterization techniques
The X-ray diffraction (XRD) patterns of studied samples were recorded on a Rigaku Smartlab-9 kW powder diffractometer using Cu-Kα X-ray (λ = 1.54186 Å) tubes at a scanning rate of 4° min−1 in the region of 2θ = 10–80°.Diffuse reflectance ultraviolet-visible (UV-Vis) spectra of the studied samples (ca. 20 mg diluted in ca. 80 mg BaSO4) were recorded in air against BaSO4 in the region of 200–800 nm on a Perkin-Elmer Lambda 950 spectrophotometer.
Transmission electron microscopy (TEM) images were taken on a FEI Tecnai G2 F20 electron microscope at an accelerating voltage of 200 kV. A few drops of alcohol suspension containing the sample were placed on a carbon-coated copper grid, followed by evaporation at ambient temperature.
X-ray photoelectron spectra (XPS) were recorded on a Kratos Axis Ultra DLD spectrometer with a monochromated Al-Kα X-ray source (hν = 1486.6 eV), hybrid (magnetic/electrostatic) optics and a multi-channel plate and delay line detector (DLD). All spectra were recorded using an aperture slot of 300 × 700 microns; survey spectra were recorded with a pass energy of 160 eV and high-resolution spectra with a pass energy of 40 eV. Accurate binding energies (±0.1 eV) were determined with respect to the position of the adventitious C 1s peak at 284.8 eV.
Fourier transform infrared reflectance (FTIR) spectra observations of samples were carried out on a Bruker EQUINX55 spectrometer with 128 scans at a resolution of 2 cm−1. The spectra were recorded in dry air with KBr as the background.
Photoluminescence (PL) spectra were recorded on a Perkin Elmer LS55 fluorescence spectrophotometer. The samples of ca. 200 mg were dry-pressed into self-supporting wafers and then illuminated by incident light of 320 nm wavelength at ambient temperature.
Time-resolved IR absorption was carried out on a Nicolet 870 FTIR spectrometer with the MCT detector. The samples were fixed on a CaF2 plate at a density of 2 mg cm−2 and placed in a gas cell evacuated at 10−5 Torr. The 355 nm (1 Hz, 3 mJ per pulse) pulse laser was used as the excitation light. The detection of IR absorption is from 1000 to 4000 cm−1 wavelength. A Stanford Research pulse generator (Model DG535) was used to synchronize laser excitation and data acquisition.
Time-resolved fluorescence decays were recorded using the time-correlated single photon counting method. Data analysis was carried out using commercial software provided by Horiba Instruments. A transparent sample ethanol solution was prepared through multiple ultrasound treatment before the test.
2.3 Photocurrent measurement
Elemental analysis was conducted in a conventional three-electrode cell on a Zennium Zahner electrochemical workstation with the Ag/AgCl (saturated KCl) and Pt as the reference and counter electrode, respectively. The studied samples were ground roughly and 5 mg was dispersed in 0.5 mL of DMF. The mixture was ultrasonically treated to obtain a slurry, which was spread onto FTO glass (Note: FTO glass should be treated through sonication in acetone, ethanol and deionized water, successively, and then nitrogen purging to ensure that the catalysts are successfully coated). For improving adhesion, the working electrode was further dried at 373 K for 2 h. 0.5 M Na2SO4 was used as the electrolyte for the photocurrent response measurement.2.4 Water splitting reaction
Water photo-splitting was performed in a homemade side-irradiation-type Pyrex reaction cell connected to a closed gas circulation and evacuation system under the irradiation of a 150 W Xe lamp without filters or 365/405 nm LED lamp. In a typical experiment, 200 mg catalyst sample was suspended in ca. 200 mL aqueous solution in the reaction cell, 10% (v/v) methanol–water solution was used for H2 generation, and 1 wt% Pt was in situ photo-deposited on the surface of the catalyst. After evacuation for ca. 30 min, the reactor cell was irradiated at a constant temperature of 298 K under stirring. The gaseous products were analyzed via an online gas chromatograph (Shanghai GC122) with a thermal conductivity detector and Ar as the carrier gas.3. Results and discussion
3.1 Structural characterization of CN–TiO2 sample
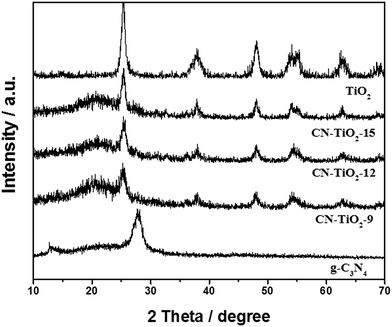
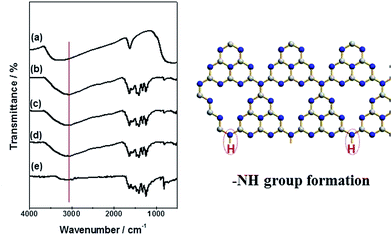
Fig. 1 shows the XRD patterns of CN–TiO2 samples. It reveals that the crystalline structure of the anatase TiO2 phase is well preserved without noticeable rutile phase; the small peak at 2 theta of 27.4°, detected in all three XRD patterns, is attributed to the diffraction from the (002) planes of g-C3N4.44–47 The weak signal of g-C3N4 suggests the integrity of the skeleton and the relatively low content. Using the Scherer equation to analyze the anatase TiO2 (101), the TiO2 is determined to have a size of 9.3 nm for CN–TiO2-9, 12.5 nm for CN–TiO2-12 and 15.4 nm for CN–TiO2-15. We noted that the TiO2 component presents the main XRD signals with the direct evidence of C3N4 functioning as the loading agent. On the other hand, the particle size of TiO2 supporter is slightly adjusted through changing the pH of the precursor.It should be mentioned that the graphitic C3N4 can be cut into small structural units under high temperature hydrothermal environment with a low pH reaction solution. In our earlier study, the g-C3N4 retained its layered structure at 150 °C.43 Herein, we chose a relatively high temperature of 180 °C for obtaining the nano-sized g-C3N4. On the other hand, protonated g-C3N4 is always synthesized under weak acidic conditions.46,47 To obtain more information about the chemical structure and surface functional groups of the samples under study, FTIR studies were carried out and Fig. 2 gives the corresponding result. Typically, the adsorption peak at 805 cm−1 is attributed to the breathing mode of the tris-triazine rings.45–47 The peak at 1200–1600 cm−1 is the stretching mode of CN heterocycles, and the broad peak at 3100 cm−1 is assigned to the stretching vibration of N–H or O–H.45–47 The abovementioned results clearly suggest that g-C3N4 holds its main structure and the 3100 cm−1 peak can be assigned to the N–H group, as shown in the model (Fig. 2 right). Notably, the peaks of CN–TiO2 at 805 and 3100 cm−1 become weaker and stronger, respectively, compared with the reference g-C3N4, which further suggests that more –NH groups have been formed through the hydrothermal treatment. Moreover, we changed the treatment process at 200 °C and the characteristic infrared peak of g-C3N4 almost disappeared (not given here), which suggests that the main structure has been destroyed.
As the introduction mentioned, when the nanoparticle size is below 16 nm, the scattering effect of incident light can be ignored and Fig. 3(a) gives the corresponding electrodynamic calculation result. We also carried out the simulation on the 10 nm particle with the results of almost all of the band gap absorption and negligible scattering effect; the result is shown in Fig. S1.†
To determine the nanoparticle size of the CN–TiO2 samples under study, a TEM test was carried out and the corresponding results are given in Fig. 3(b)–(d). We further calculated the particle sizes of the three samples through the mathematical statistics method based on the original TEM results, as shown in Fig. S2,† with the corresponding particle sizes of 9, 12 and 15 nm for the three particles studied. The TEM results were well consistent with the abovementioned XRD results. Therefore, the three studied samples can be named as sub-15 nm particles. We also gave the results of element mapping with the relative element ratios as shown in Fig. S3.† The results clearly suggested a similar proportion of C3N4 to TiO2. High-resolution TEM images in Fig. 3(f)–(h) present the clear heterojunction interface (TiO2 shows lattice fringes and C3N4 does not). In the heterojunction assembly process, the TiO2 and C3N4 were in situ crystallised and turned small, respectively, and then contacted with each other tightly. In addition, the close interaction was found to be favorable for the photogenerated carriers' migration. For the synthesized sub-15 nm CN–TiO2 compounds, the absorption property was also characterized and the results are given in Fig. 3(e). All samples show similar absorption up to 440 nm in the visible-light region, which is attributed to the band–band transition of g-C3N4. A slight blue shift can be detected as the TiO2 particle size decreases. The absorbance intensity of the three samples presents the following order: CN–TiO2-9 < CN–TiO2-12 < CN–TiO2-15, which can be explained by referring to the quantum size effect.
Based on the abovementioned experimental results, the formation mechanism of sub-15 nm C3N4–TiO2 samples can be illustrated as follows. The precursor of TiO2 is present as Ti(OH)x− at the low concentration of TiCl4.42 By adding bulk g-C3N4 to the abovementioned solution and ultrasonically treating, the uniform precursor suspension is formed. During the hydrothermal process, the Ti(OH)x− ions are inserted into the layered g-C3N4 and the two compositions inter-attach onto each other. Subsequently, pure anatase TiO2 phase with the sub-15 nm particle size was produced and the bulk g-C3N4 was broken into small molecules under the weak acid environment. The hydrothermal temperature is important for the nano-sized heterojunction formation.
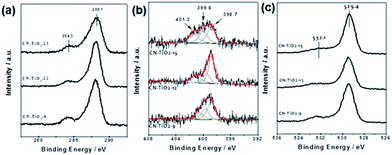
XPS analysis was carried out to study the surface and sub-surface chemical states (5 nm in depth) of the CN–TiO2 samples, as shown in Fig. 4 and S4.† The C 1s spectra in Fig. 4(a) shows two peaks; the main one at 288.4 eV typically originates from the sp2-bonded carbon of the N–C![[double bond, length as m-dash]](https://www.rsc.org/images/entities/char_e001.gif) N backbone in the aromatic ring of g-C3N4, whereas the one at 284.9 eV is assigned to graphitic carbon.45–47 There is no prominent difference in C 1s peaks for all three samples. The N 1s spectra, shown in Fig. 4(b), can be deconvoluted into three peaks located at 398.7, 399.7 and 401.3 eV. The peak at 398.7 eV is a typical signal for sp2-hybridized nitrogen (C–N
N backbone in the aromatic ring of g-C3N4, whereas the one at 284.9 eV is assigned to graphitic carbon.45–47 There is no prominent difference in C 1s peaks for all three samples. The N 1s spectra, shown in Fig. 4(b), can be deconvoluted into three peaks located at 398.7, 399.7 and 401.3 eV. The peak at 398.7 eV is a typical signal for sp2-hybridized nitrogen (C–N![[double bond, length as m-dash]](https://www.rsc.org/images/entities/char_e001.gif) C) in triazine rings, while the peak centered at 399.7 eV is assigned to the N–(C)3 groups of the skeleton.42,43 The last weak peak at 401.1 eV is attributed to the surface uncondensed bridging N atom with C–N–H functional groups attached. It is clear that the relative N–H groups show higher intensity than the reference g-C3N4,46,47 suggesting that more –NH groups are formed, which is in good agreement with the FTIR results. The O 1s and Ti 2p in Fig. 4(c) and S7(a)† affirm no prominent difference between the three samples. The wide XPS survey spectrum shown in Fig. S4(b)† indicates that the surface elements of the synthesized CN–TiO2 heterojunction samples include only C, N, O, and Ti elements.
C) in triazine rings, while the peak centered at 399.7 eV is assigned to the N–(C)3 groups of the skeleton.42,43 The last weak peak at 401.1 eV is attributed to the surface uncondensed bridging N atom with C–N–H functional groups attached. It is clear that the relative N–H groups show higher intensity than the reference g-C3N4,46,47 suggesting that more –NH groups are formed, which is in good agreement with the FTIR results. The O 1s and Ti 2p in Fig. 4(c) and S7(a)† affirm no prominent difference between the three samples. The wide XPS survey spectrum shown in Fig. S4(b)† indicates that the surface elements of the synthesized CN–TiO2 heterojunction samples include only C, N, O, and Ti elements.
For solar energy absorption and conversion utilization, especially the photocatalytic reaction, some physicochemical properties, such as specific surface area (BET), band gap and morphology should be clear. For the synthesized CN–TiO2 heterojunction, the relative content between g-C3N4 and TiO2 also determines the final reaction efficiency. Table 1 summarizes the BET, band gap, morphology and relative amounts of the studied CN–TiO2 nano-sized particles, which have similar light absorption scope.
| Sample | BET (m2 g−1) | The relative amount (% w/w C3N4/TiO2) | ||
|---|---|---|---|---|
| EDS | XPS | ICP | ||
| CN–TiO2-9 | 82 | 4.0 | 3.9 | 4.1 |
| CN–TiO2-12 | 84 | 4.1 | 4.1 | 4.0 |
| CN–TiO2-15 | 86 | 4.1 | 4.0 | 4.0 |
3.2 Photocatalytic H2 generation of CN–TiO2 sample
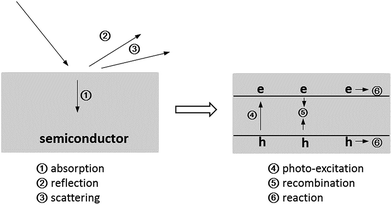
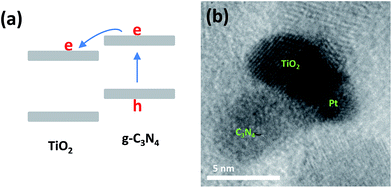
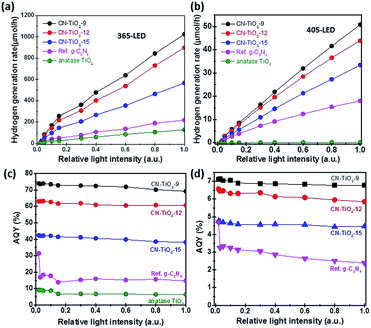
For a photocatalysis reaction on the semiconductor surface, six brief processes should be mentioned, as shown in Fig. 5. For the nanoparticle system, the light reflection and scattering processes can be ignored because the wavelength of incident light is far longer than the particle size of the semiconductor (Fig. 3 and S2†). On the other hand, the carriers' recombination processes limit the photocatalytic reaction. In this study, we synthesized a sub-15 nm CN–TiO2 system for the total absorption of the incident photons and constructed the g-C3N4 and TiO2 tight heterojunction to maximize the photogenerated carriers' separation. To test the abovementioned conjecture, the nano-materials were used as model catalysts in a photocatalytic hydrogen evolution system. Fig. S5† shows the comparison of hydrogen generation using different catalysts. Clearly, the sub-15 nm CN–TiO2 samples provide notable enhancement of hydrogen generation. The CN–TiO2-9 sample gives the considerable activity (1400 μmol h−1) and presents ca. 10 times higher than the reference TiO2/C3N4 heterojunction (150 μmol h−1), and 46 times higher than 10 nm TiO2 particles (30 μmol h−1). The abovementioned result directly suggests the advantage of the sub-15 nm heterojunction structure for incident photon absorption conversion utilization. To explore more details of the solar-to-hydrogen activity of the CN–TiO2 samples, we selected two monochromatic wavelengths of 365 and 405 nm as light sources. Fig. S6† shows the corresponding results. It is seen that the H2 evolution rate under the two wavelength conditions decreases slightly from CN–TiO2-9 to CN–TiO2-15, and the rate of H2 evolution of 365 nm illumination is nearly 20 times higher than that of 405 nm illumination. The significant activity difference can be well explained by the existence of the two photo-activated parts of C3N4 and TiO2 under ultraviolet radiation, and also the heterojunction structure. For the anatase TiO2 and g-C3N4, the type II band position alignment promotes the photogenerated electrons to transfer from g-C3N4 to TiO2, as shown in Fig. 6(a). To give direct evidence and address the tight heterojunction structure, we give the HRTEM result of the CN–TiO2-9 sample immersed in HPtCl4. After the photocatalytic reaction under visible light, the Pt nanoparticles will in situ load onto a part of the photocatalyst surface where the photogenerated electrons will accumulate. Fig. 6(b) shows the corresponding result. Clearly, the lattice fringes of TiO2 and Pt can be distinguished. Importantly, the Pt particle was loaded on the TiO2 surface, indicating that the photogenerated holes and electrons have been separated by the heterojunction and the electrons have been accumulated into the TiO2 particle. We also used the measurements of UV-Vis diffuse reflectance spectra and electrochemical Mott–Schottky tests to give the relative band edge position of g-C3N4 and TiO2. Fig. S7† gives the corresponding results. Clearly, the C3N4/TiO2 has the potential of catalyzing H2 generation from water.In the photocatalytic process, the photogenerated carriers will recombine or diffuse to the surface of the semiconductor to undergo a chemical reaction (Fig. 5). A certain catalyst system has a special photon-to-electron conversion ratio; this means that there may be a given coefficient relating to the conversion. However, the exact consideration and mechanism of the abovementioned thoughts on the important photocatalytic processes is lacking, unclear to date, and requires further detailed studies. Herein, we chose the 365 and 405 nm wavelength photons and changed the incident photon number through the modulation of power of the LED lamp used for a steady light response study. Fig. 7(a) and (b) show the evolution rate of H2 under the control experiment. The hydrogen generation increases with the increase of incident light power, indicating an intuitive impression of a linear relationship between photon and hydrogen. However, when we transformed the results to apparent quantum yield (AQY), which is the ratio of photogenerated electrons participating in the hydrogen generation reaction to the number of incident photons (see the Experimental section); an interesting phenomenon appeared as given in Fig. 7(c) and (d). The AQY values under 365 and 405 nm illumination conditions are almost unchanged, demonstrating that the incident photons are changed into chemical electrons through the sub-15 nm CN–TiO2 sample under a special internal conversion coefficient. On the other hand, the AQY values based on the sub-15 nm CN–TiO2 heterojunction are as high as 70% and 6.9% under 365 and 405 nm irradiation, respectively. To better understand the remarkable photocatalytic hydrogen activity, we considered two comparisons based on g-C3N4 and TiO2/C3N4, as given in Tables S1 and S2.† Notably, the AQY value of the CN–TiO2 sample is still lower than that of the g-C3N4 systems (Table S1†); however, the sub-15 nm TiO2/C3N4 sample shows the best activity based on TiO2/C3N4 systems (Table S2†). To further confirm the abovementioned speculation, we tested the corresponding results of the reference sub-10 nm anatase TiO2 and TiO2/C3N4 heterojunctions. Fig. S8† gave the hydrogen evolution and AQY results. The hydrogen generation rates of the two samples were found to increase with increasing incident light power. However, the AQY values show an undesirable decrease.
Based on the abovementioned measurements, the sub-15 nm heterojunction provides not only maximum light absorption but also excellent carrier separation (Fig. 5). To get more information about the excellent carrier separation capability of the synthesized nano-sized CN–TiO2 heterojunction, room temperature photoluminescence (PL) spectroscopy was carried out, and the results are given in Fig. 8(a). The CN–TiO2 samples show considerable PL intensity, which is clearly weaker than that of the reference TiO2/C3N4 sample, indicating efficient charge separation at the heterojunction interface. On the other hand, it is well known that small particles are beneficial to solar-to-chemical reaction because of their shorter carrier migration distance from where the carrier is generated to the semiconductor surface. For the heterojunction with the two components at the nm scale, the carrier migration distance reduces accordingly, resulting in a longer carrier lifetime. The time-resolved infrared spectrum (TRIR) analysis was carried out to confirm the theory and get a direct proof of the extended life of the photogenerated electrons. Fig. 8(b) compares the TRIR from CN–TiO2-9, reference TiO2/C3N4 heterojunction and sub-10 nm anatase TiO2. It is clear that the sub-10 nm CN–TiO2 sample gives the longest carrier lifetime, followed by TiO2/C3N4 and then anatase TiO2. Fig. 8(c) gives the photocurrent–time curves of the CN–TiO2, TiO2/C3N4 and reference TiO2 samples. The CN–TiO2-9 sample shows ca. 0.5 mA cm−2 photocurrent, and the TiO2/C3N4 exhibit 0.3 mA cm−2 photocurrent. The reference TiO2 presents ca. 0.1 mA cm−2 photocurrent. The I–t results further confirm the importance of the heterojunction structure and the nano-sized hybrid components for the enhanced photogenerated carrier separation.
The photophysical properties of photoexcited charge carriers of the CN–TiO2-9, reference TiO2/C3N4 heterojunction and TiO2 samples were further analyzed using nanosecond-level time-resolved fluorescence decay spectra under 325 nm monochromatic light excitation at room temperature. Fig. S9† shows the corresponding result. The decay spectra were fitted to obtain the radiative lifetimes of the samples via the following function:
Table 2 gives the e fitting results with the two lifetime components (τ1 and τ2) and the corresponding relative percentages of charge carriers. Clearly, for the three samples, the longer lifetime (τ1) shows the major relative percentage of the radiative fluorescence with the slight change of charge carriers. In addition, the lifetime (τ1) values for CN–TiO2-9, TiO2/C3N4 and TiO2 are 15.4, 13.3 and 6.9 ns, respectively. Clearly, the trend of lifetime (τ1) suggests the importance of the heterojunction structure for increasing the radiative lifetimes of charge carriers. The prolonged lifetime of charge carriers can be explained by the fast interface transfer of the photoexcited electrons between the two components of heterojunction samples.48,49 Moreover, the sample of CN–TiO2-9 shows a longer lifetime (τ1) than TiO2/C3N4, suggesting that the size of the heterojunction affects not only the incident light absorption but also the carrier migration. Combining with the abovementioned TRIR and I–t results, the synthesized sub-15 nm CN–TiO2 samples present the maximum incident light absorption, maximum separation of charge carriers, prolonged lifetime of charge carriers and fast interface migration, and thereby reflect considerable solar energy absorption and utilization.
| Sample | τ 1 (ns) | Relative% | τ 2 (ns) | Relative% |
|---|---|---|---|---|
| CN–TiO2-9 | 15.4 | 95.5 | 3.17 | 4.5 |
| TiO2/C3N4 | 13.3 | 96.0 | 2.28 | 4.0 |
| TiO2 | 6.9 | 95.6 | 2.06 | 4.4 |
4. Conclusion
In conclusion, we have successfully synthesized sub-15 nm CN–TiO2 samples through a hydrothermal process under a relatively high temperature (180 °C), which is important for the nano-sized C3N4/TiO2 formation. The lower or higher hydrothermal temperature will result in the layered or dissociated C3N4, which affects the light absorption and conversion. As predicted by the Mie scattering law, the synthesized nano-sized heterojunction samples can absorb almost all incident light without reflection. The TRIR, I–t results and time-resolved fluorescence suggest the maximum incident light absorption, maximum separation of charge carriers, prolonged lifetime of charge carriers and fast interface migration. The synthesized CN–TiO2 samples impart the nano-sized heterojunction with considerable solar-to-hydrogen conversion, achieving the AQY of 6.9% under 405 nm visible light irradiation. Moreover, the AQY values showed no decrease on increasing the incident photon number, demonstrating a steady solar-to-hydrogen conversion process. The large absorption cross-section area and the prolonged lifetime of photogenerated carriers of the sub-15 nm CN–TiO2 heterojunction act as the bridge to photon-to-electron conversion. This study can help us understand more about photocatalysis and design other excellent semiconductor systems to fully utilize solar energy to produce chemicals.Acknowledgements
We thank the support from the National University Research Fund (GK261001009), the Changjiang Scholar and Innovative Research Team (IRT_14R33), the 111 Project (B14041), Natural Science Foundation of China (No. 21603136), National Key Research Program of China (2016YFA0202403), Young Talent fund of University Association for Science and Technology in Shaanxi (20150104) and the Fundamental Research Funds for the Central Universities (GK201602007); the Chinese National 1000-Talent-Plan program is also acknowledged.Notes and references
- T. Hisatomi, J. Kubota and K. Domen, Chem. Soc. Rev., 2014, 43, 7520 RSC.
- A. Fujishima and K. Honda, Nature, 1972, 238, 37 CrossRef CAS PubMed.
- K. Maeda, K. Teramura, D. Lu, T. Takata, N. Saito, Y. Inoue and K. Domen, Nature, 2006, 440, 295 CrossRef CAS PubMed.
- Z. Zou, J. Ye, K. Sayama and H. Arakawa, Nature, 2001, 414, 625 CrossRef CAS PubMed.
- J. Barber, Chem. Soc. Rev., 2009, 38, 185 RSC.
- M. Wasielewski, Acc. Chem. Res., 2009, 42, 1910 CrossRef CAS PubMed.
- W.-J. Ong, L.-L. Tan, Y. H. Ng, S.-T. Yong and S.-P. Chai, Chem. Rev., 2016, 116, 7159 CrossRef CAS PubMed.
- D. Zheng, X.-N. Cao and X. Wang, Angew. Chem., Int. Ed., 2016, 55, 11512 CrossRef CAS PubMed.
- D. Dontsova, C. Fettkenhauer, V. Papaefthimiou, J. Schmidt and M. Antonietti, Chem. Mater., 2016, 28, 772 CrossRef CAS.
- G. Zhang, Z.-A. Lan, L. Lin, S. Lin and X. Wang, Chem. Sci., 2016, 7, 306 Search PubMed.
- A. Indra, P. W. Menezes, K. Kailasam, D. Hollmann, M. Schröder, A. Thomas, A. Brückner and M. Driess, Chem. Commun., 2016, 52, 104 RSC.
- G. Zhang, G. Li and X. Wang, ChemCatChem, 2015, 7, 2864 CrossRef CAS.
- Y. Tachibana, L. Vayssieres and J. Durrant, Nat. Photonics, 2012, 6, 511 CrossRef CAS.
- L. Li, J. Yan, T. Wang, Z.-J. Zhao, J. Zhang, J. Gong and N. Guan, Nat. Commun., 2015, 6, 5881 CrossRef PubMed.
- J. Yan, G. Wu, N. Guan, L. Li, Z. Li and X. Cao, Phys. Chem. Chem. Phys., 2013, 15, 10978 RSC.
- J. Yan, G. Wu, N. Guan and L. Li, Appl. Catal., B, 2014, 280, 152 Search PubMed.
- L. Liao, Q. Zhang, Z. Su, Z. Zhao, Y. Wang, Y. Li, X. Lu, D. Wei, G. Feng, Q. Yu, X. Cai, J. Zhao, Z. Ren, H. Fang, F. Robles-Hernandez, S. Baldelli and J. Bao, Nat. Nanotechnol., 2013, 9, 69 CrossRef PubMed.
- J. Liu, Y. Liu, N. Liu, Y. Han, X. Zhang, H. Huang, Y. Lifshitz, S. Lee, J. Zhong and Z. Kang, Science, 2015, 347, 970 CrossRef CAS PubMed.
- X. Wang, K. Maeda, A. Thomas, K. Takanabe, G. Xin, J. Carlsson, K. Domen and M. Antonietti, Nat. Mater., 2009, 8, 76 CrossRef CAS PubMed.
- G. Zhang, M. Zhang, X. Ye, X. Qiu, S. Lin and X. Wang, Adv. Mater., 2014, 26, 805 CrossRef CAS PubMed.
- J. Zhang, M. Grzelczak, Y. Hou, K. Maeda, K. Domen, X. Fu, M. Antonietti and X. Wang, Chem. Sci., 2012, 3, 443 RSC.
- Y. Cui, J. Zhang, G. Zhang, J. Huang, P. Liu, M. Antonietti and X. Wang, J. Mater. Chem., 2011, 21, 13032 RSC.
- J. Yan, Y. Zhang, S. (Frank) Liu, G. Wu, L. Li and N. Guan, J. Mater. Chem. A, 2015, 3, 21434 CAS.
- B. Chai, T. Peng, J. Mao, K. Li and L. Zan, Phys. Chem. Chem. Phys., 2012, 14, 16745 RSC.
- Y. Zhu, Y. Wang, Q. Ling and Y. Zhu, Appl. Catal., B, 2017, 200, 222 CrossRef CAS.
- L. Shang, B. Tong, H. Yu, G. I. N. Waterhouse, C. Zhou, Y. Zhao, M. Tahir, L.-Z. Wu, C.-H. Tung and T. Zhang, Adv. Energy Mater., 2016, 6, 1501241 CrossRef.
- F. Liang and Y. Zhu, Appl. Catal., B, 2016, 180, 324 CrossRef CAS.
- D. Chen, K. Wang, W. Hong, R. Zong, W. Yao and Y. Zhu, Appl. Catal., B, 2015, 166–167, 366 CrossRef CAS.
- C. Zhou, Y. Zhao, L. Shang, R. Shi, L.-Z. Wu, C.-H. Tung and T. Zhang, Chem. Commun., 2016, 52, 8239 RSC.
- W. Jiang, W. Luo, R. Zong, W. Yao, Z. Li and Y. Zhu, Small, 2016, 12, 4370 CrossRef CAS PubMed.
- P. Niu, L. Zhang, G. Liu and H.-M. Cheng, Adv. Funct. Mater., 2012, 22, 4763 CrossRef CAS.
- M. Zhang, W. Jiang, D. Liu, J. Wang, Y. Liu, Y. Zhu and Y. Zhu, Appl. Catal., B, 2016, 183, 263 CrossRef CAS.
- J. Zhang, M. Zhang, L. Lin and X. Wang, Angew. Chem., Int. Ed., 2015, 54, 6297 CrossRef CAS PubMed.
- D. Martin, P. Reardon, S. Moniz and J. Tang, J. Am. Chem. Soc., 2014, 136, 12568 CrossRef CAS PubMed.
- C. Soci, A. Zhang, B. Xiang, S. Dayeh, D. Aplin, J. Park, X. Bao, Y. Lo and D. Wang, Nano Lett., 2007, 7, 1003 CrossRef CAS PubMed.
- K. Gerasimos, H. Ian, F. Armin, H. Sjoerd, C. Jason, K. Ethan, L. Larissa and S. H. Edward, Science, 2006, 442, 180 Search PubMed.
- O. Lopez-Sanchez, D. Lembke, M. Kayci, A. Radenovic and A. Kis, Nat. Nanotechnol., 2013, 8, 497 CrossRef CAS PubMed.
- P. Avouris, Nano Lett., 2010, 10, 4285 CrossRef CAS PubMed.
- G. Konstantatos and E. H. Sargent, Nat. Nanotechnol., 2010, 5, 391 CrossRef CAS PubMed.
- X. Gong, M. Tong, Y. Xia, W. Cai, J. S. Moon, Y. Cao, G. Yu, C.-L. Shieh, B. Nilsson and A. J. Heeger, Science, 2009, 325, 1665 CrossRef CAS PubMed.
- Y. Jin, J. Wang, B. Sun, J. Blakesley and N. Greenham, Nano Lett., 2008, 8, 1649 CrossRef CAS PubMed.
- J. Yan, H. Wu, H. Chen, L. Pang, Y. Zhang, R. Jiang, L. Li and S. Liu, Appl. Catal., B, 2016, 194, 74 CrossRef CAS.
- J. Yan, H. Wu, H. Chen, Y. Zhang, F. Zhang and S. Liu, Appl. Catal., B, 2016, 191, 130 CrossRef CAS.
- C. Ye, J. Li, Z. Li, X. Li, X. Fan, L. Zhang, B. Chen, C. Tung and L. Wu, ACS Catal., 2015, 5, 6973 CrossRef CAS.
- Y. Zhang, A. Thomas, M. Antonietti and X. Wang, J. Am. Chem. Soc., 2009, 131, 50 CrossRef CAS PubMed.
- J. Zhang, M. Zhang, L. Lin and X. Wang, Angew. Chem., Int. Ed., 2015, 54, 6297 CrossRef CAS PubMed.
- K. Xu, X. Li, P. Chen, D. Zhou, C. Wu, Y. Guo, L. Zhang, J. Zhao, X. Wu and Y. Xie, Chem. Sci., 2015, 6, 283 RSC.
- F. Dong, Q. Li, Y. Sun and W.-K. Ho, ACS Catal., 2014, 4, 4341 CrossRef CAS.
- M. V. Dozzi, C. D'Andrea, B. Ohtani, G. Valentini and E. Sell, J. Phys. Chem. C, 2013, 117, 25586 CAS.
Footnote |
| † Electronic supplementary information (ESI) available: TEM images; the wide XPS spectra; photocatalytic hydrogen evolution of reference TiO2/C3N4 heterojunction and 10 nm anatase TiO2 under 150 W xenon lamp and the monochromatic light of 365 and 405 nm; hydrogen evolution rate under the special LED lamp with different relative light intensity of the reference anatase TiO2 (365 nm irradiation) and TiO2/C3N4 heterojunction (405 nm irradiation). See DOI: 10.1039/c6se00048g |
| This journal is © The Royal Society of Chemistry 2017 |

