 Open Access Article
Creative Commons Attribution 3.0 Unported Licence
Light-driven generation of chlorine and hydrogen from brine using highly selective Ru/Ti oxide redox catalysts†
L.
McCafferty
 a,
C.
O'Rourke
b,
A.
Mills
*b,
A.
Kafizas
a,
I. P.
Parkin
a and
J. A.
Darr
*a
a,
C.
O'Rourke
b,
A.
Mills
*b,
A.
Kafizas
a,
I. P.
Parkin
a and
J. A.
Darr
*a
aChristopher Ingold Building, Department of Chemistry, University College London, 20 Gordon Street, London, WC1H 0AJ, UK. E-mail: j.a.darr@ucl.ac.uk
bSchool of Chemistry and Chemical Engineering, Queen's University Belfast, Stranmillis Road, Belfast BT9 5AG, UK. E-mail: andrew.mills@qub.ac.uk
First published on 11th January 2017
Abstract
Ultrafine ruthenium–titanium oxide catalysts were directly produced using a continuous hydrothermal flow synthesis process and assessed as chloride oxidation catalysts. Selectivity towards chlorine (over oxygen) evolution was shown to generally increase with decreasing ruthenium content. The optimum catalyst was then used to make an anode for a light-driven brine-splitting demonstrator device to produce hydrogen and chlorine gases.
Sunlight is mankind's largest energy source; the amount that reaches the surface of the earth every hour, is twice the global energy consumed by human activity annually.1 Solar cells convert sunlight into electricity and are currently the fastest growing renewable technology,2 but they suffer from the intermittency of sunlight and are not optimal when energy is most needed, i.e. in winter and/or at night.3 Natural photosynthesis is the perfect example of how sunlight can produce renewable fuels that can be stored and used when required, thereby circumventing the problem of solar intermittency. Learning from nature, bio-inspired approaches deemed artificial photosynthesis (AP) have shown great promise, where devices are being developed that can drive the synthesis of molecular fuels using sunlight.4 Currently, the most popular approach to AP is the solar photolysis of water, i.e. water splitting, which produces hydrogen (H2), and oxygen (O2) gases, the former being a carbon neutral fuel.5 However, one of the major obstacles towards the efficient photocleavage of water, is the facile oxidation of water, which requires the transfer of four electrons per oxygen molecule formed.6 Even when using the best water oxidation catalysts (WOCs) based on ruthenium and iridium oxides, a large overpotential (η ∼ 400 mV at 10 mA cm−2) is required to drive the reaction efficiently.7
The much less-studied photocleavage of brine (salt water) to hydrogen and chlorine gas, can be considered an elegant alternative to water splitting. The overall reaction, a 2 electron transfer, is much easier to effect, requiring a significantly lower overpotential than the cleavage of water8 (η ∼ 50 mV at 10 mA cm−2). Not only does it produce an invaluable fuel, but also an oxidized chloride product, either chlorine gas or sodium hypochlorite (NaOCl), depending on reaction pH, which are important chemical feedstocks, with many uses. Both Cl2 and NaOCl are produced on a very large scale industrially through the electrochemical chlor-alkali and chlorate processes, respectively.9 Generating these chemicals electrochemically, consumes vast amounts of electricity, therefore, the scope for producing these chemicals using a renewable energy source is attractive. As the transportation of chlorine gas is expensive and dangerous, the production of chlorine in situ using a portable solar powered device, such as that developed herein, would facilitate production at the point of consumption, which may be particularly attractive to those in the developing world.
Although electrochemically relatively facile, the oxidation of chloride still presents a significant challenge, since the standard electrochemical potential required to oxidize chloride is 1.33 VRHE (as opposed to the 1.23 VRHE required for that of water). Additionally, chlorine is an aggressive oxidant, and only a few materials, most notably RuO2, when mixed with other elements10,11 is resistant to anodic corrosion.12 Thus, in industry, for the chlor-alkali and chlorate processes, a typical anode is composed of an intimate mixture of RuO2 and TiO2 (optimum Ru content ∼30–40 at%), which is known as a dimensionally stable anode (DSA). The reasons for adding TiO2 are three-fold; (i) it improves stability,13 (ii) it reduces cost (as Ti is less expensive than Ru) and, (iii) it can improve selectivity for chloride oxidation (as opposed to the competing water oxidation reaction).14,15 Typically, ruthenium content values <30 at% are not favoured as they require increased overpotential to drive chloride oxidation. In industry, DSAs use electricity from the grid and are maintained at current densities >1 A cm−2. In comparison, if a solar cell is used to power a brine splitting device, the current density of a typical solar cell, would be ca. 10 mA cm−2 (i.e. about 100 times less than industry). Considering this, it may be possible that a DSA catalyst with relatively low Ru content, could prove more effective for the solar-driven cleavage of brine (compared to the DSAs used in industry). This report explores the effect of Ru![[thin space (1/6-em)]](https://www.rsc.org/images/entities/char_2009.gif) :
:![[thin space (1/6-em)]](https://www.rsc.org/images/entities/char_2009.gif) Ti ratio on activity and selectivity for Cl2 evolution using ultrafine, i.e. high surface area, crystalline Ru/Ti nano-oxide redox catalysts, prepared using a continuous hydrothermal flow synthesis (CHFS) process.16–19 The best electrocatalyst was then used in a solar-driven brine splitting demonstration cell.
Ti ratio on activity and selectivity for Cl2 evolution using ultrafine, i.e. high surface area, crystalline Ru/Ti nano-oxide redox catalysts, prepared using a continuous hydrothermal flow synthesis (CHFS) process.16–19 The best electrocatalyst was then used in a solar-driven brine splitting demonstration cell.
In the CHFS process, nanoparticles were formed when a flow of aqueous metal salt solution was mixed with supercritical (or superheated) water, typically at up to 450 °C and 24 MPa. This resulted in rapid simultaneous hydrolysis and dehydration of the metal salt(s) in the mixture, to form the corresponding nanoparticulate metal oxides.20 The authors previously developed a confined jet mixer,21 that was shown to eliminate blockages in flow by minimising undesirable preheating of the incoming metal salt precursors.22 Further details of the design of the system are described in previous publications.23,24 In this study, ruthenium and titanium salts in water, were used to produce RuO2:TiO2 nanopowders, the relative concentrations of the precursors were varied according to the desired ruthenium content in the oxide product (1, 5, 10, 15, 20, 25, 50, 75 and 100 at% Ru, with the remainder being Ti).
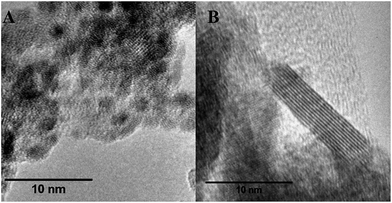
The nanopowders from CHFS, were analysed by transmission electron microscopy (TEM). Particles were primarily spherical and <10 nm in size, with some rod-like particles at high Ru at%, which typically measured <5 × 20 nm (Fig. 1). BET analysis revealed high surface areas in the range 189–260 m2 g−1; with the highest surface area seen at 50 at% Ru. Elemental ratios of ruthenium to titanium in the solids were analysed by Energy Dispersive X-ray Spectroscopy (EDS) and compared well with the relative concentrations used for the precursors during synthesis.
 | ||
Fig. 1 High resolution transmission electron micrographs of CHFS made nanopowders of (A) 50 at% Ru![[thin space (1/6-em)]](https://www.rsc.org/images/entities/char_2009.gif) : :![[thin space (1/6-em)]](https://www.rsc.org/images/entities/char_2009.gif) 50 at% Ti and (B) 100% at% Ru. 50 at% Ti and (B) 100% at% Ru. | ||
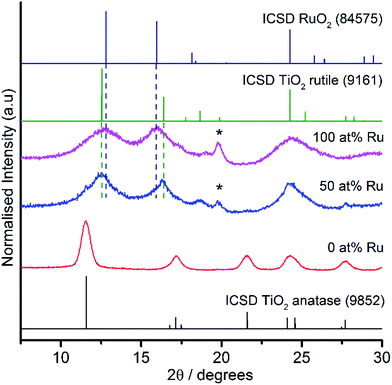
PXRD analysis was carried out on all the samples and selected results are illustrated in Fig. 2. These findings confirmed that for undoped TiO2 (100 at% Ti), the anatase phase was observed exclusively, which was consistent with previous work.25 As the nominal percentage of titanium decreased, the intensity of the anatase (101) peak (2θ = 11.6°) decreased until it was no longer visible by the sample with 50 at% Ru. At and above 50 at% Ru, a small fraction of ruthenium metal was observed along with predominately a rutile structure with very broad peaks straddling the rutile peaks for TiO2 and RuO2. It is suggested by PXRD that for the mixed metal samples, the TiO2 component was a mixture of anatase and rutile TiO2, where the rutile polymorph was favoured with increasing Ru content. Broad bands and low signal to noise ratios were found in all samples, attributed to the small crystallite sizes. Application of the Scherrer equation to selected PXRD peaks, suggested that average crystallite sizes ranged from 2 to 7 nm.
The catalytic activities of the different ClOCs were assessed using a Ce(IV)/Cl− test system, details of which are reported elsewhere,26 in which a 90 μL aliquot of Ce(IV) solution was injected into a 1 cm cuvette containing a 2.5 mL 0.5 M H2SO4 with 2 M NaCl solution and a dispersion (60 mg L−1) of the (ClOC) catalyst powder under test. The subsequent decay of the Ce(IV), due to reaction (1), was monitored spectrophotometrically (UV-Vis).
 | (1) |
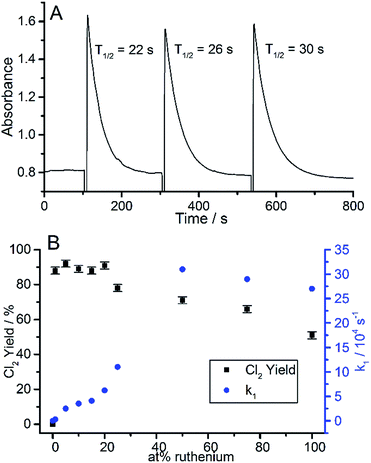
It was noted that in the absence of a catalyst, Ce(IV) was stable in the acidic solution, even in the presence of 2 M NaCl. A typical set of Ce(IV) absorbance vs. time decay profiles, for RuO2 as a ClOC (catalyst) for three repeated injections of Ce(IV), is illustrated in Fig. 3A. A first order analysis of each decay plot, revealed a straight line over three half-lives, from which a value for the first order rate constant, k1, for reaction (1) was obtained. This process of testing ClOC activity was repeated for all CHFS-made RuO2:TiO2 samples, and a plot of k1vs. Ru at% is illustrated in Fig. 3B. The mass of catalyst used was kept constant and not normalised to differences in catalyst dispersion in solution. The measured rates for all samples were faster in the presence of chloride than without, indicating that under these conditions, the oxidation of brine is more facile than that of water.
From these results, it appears that from 1 to 50 at% Ru, there is a sigmoid, “S”, shaped correlation between catalytic activity (k1) with ruthenium content. Above this level, no further activity increase is observed, which is presumably related to the availability of Ru on or near the surface, reaching saturation. This suggested that perhaps a 50 at% Ru loaded catalyst was optimum in terms of cost (linked to Ru content) vs. activity. Interestingly, a similar trend is observed in industrial Ru/Ti DSA electrodes.14
The yields of Cl2 evolution for all the Ru:Ti catalysts tested using 2 M NaCl in reaction (1), were always high (>90%). However, by using a much lower NaCl concentration (0.05 M), it was possible to explore the selectivities of the RuO2:TiO2 catalysts for generating Cl2, via reaction (1) rather than oxygen, via reaction (2):
 | (2) |
A plot of the measured % Cl2 yields vs. at% Ru content, for the different ClOCs tested, is illustrated in Fig. 3B and revealed that the highest selectivities were achieved using samples with low ruthenium content, even though these catalysts exhibited the lowest activity (i.e. lowest value for k1). The Cl2 selectivity increased as the ruthenium content decreased. Arikawa et al. reported similar trends for ruthenium and titanium DSAs, and showed that the threshold electrode potential for oxygen evolution, increased more rapidly than that of chlorine evolution as ruthenium content was decreased.14 When studying DSA type electrodes, surface inhomogeneity can influence selectivity.27 Previous CHFS studies of nanomaterials have shown the process can yield homogenous elemental distributions and can increase the solubility limit of solid solutions.24 No change in Ru![[thin space (1/6-em)]](https://www.rsc.org/images/entities/char_2009.gif) :
:![[thin space (1/6-em)]](https://www.rsc.org/images/entities/char_2009.gif) Ti ratio was detectable in CHFS prepared nanopowders analysed by SEM-EDS and depth profiled XPS. However, local changes in individual particles cannot be ruled out. From the results of this work, it seems that the best trade-off in terms of: activity, selectivity and minimum Ru content (to reduce costs) for CHFS-made catalysts, was ca. 50 at% Ru for the samples made herein.
Ti ratio was detectable in CHFS prepared nanopowders analysed by SEM-EDS and depth profiled XPS. However, local changes in individual particles cannot be ruled out. From the results of this work, it seems that the best trade-off in terms of: activity, selectivity and minimum Ru content (to reduce costs) for CHFS-made catalysts, was ca. 50 at% Ru for the samples made herein.
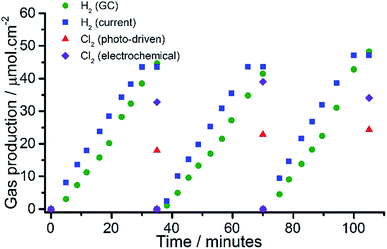
The most promising ClOC sample, i.e. that containing 50 at% Ru, was used to produce an anode on transparent conducting glass and then used in a demonstrator device for solar brine splitting that incorporated an amorphous silicon solar cell (see ESI Fig. S1† for diagram). The ClOC electrode was placed in an acidified brine photocleavage cell and connected to the solar cell. A light source was used to illuminate the solar cell, which when connected to the electrolysis cell, generated an average current of 4.8 mA and voltage of 1.89 V. The plots of H2 and Cl2 yields arising from this work are illustrated in Fig. 4. A comparison of the current with the temporal production of H2, revealed an almost 100% efficiency of production and collection, whereas for Cl2 evolution it was nearer to 50% of that expected. Under the conditions used (the applied voltage and current density provided by the solar cell), it was suggested that water oxidation competed with chloride oxidation. Evidence for this was provided by further studies; by first running an otherwise identical cell, in the absence of chloride ions, a similar current was generated, presumably due to the photoelectrolysis of water, suggesting that the oxidation of water occurred at a similar rate to that of chloride (under those conditions). Increasing the NaCl concentration to 6 M had little effect on the measured Cl2 yield (54%). A lower operating voltage was shown to be more selective towards Cl2 evolution; with 80% Cl2 yield obtained at 1.44 V. A conventional sol–gel DSA film, with similar at% Ru content, was prepared on FTO glass (rather than the more conventional Ti metal) and evaluated in the solar demonstrator under the same conditions (see ESI† for preparation method). All measurements were normalised to geometric surface area, which does not account for surface roughness or gas bubble formation that change the utilised surface area.28 At 1.36 V and 1.44 V, CHFS-made materials exhibited superior activity and selectivity (90% and 80% Cl2 yields, respectively) when compared to the DSA-type material (50% Cl2 yield). Increasing the applied potential reduced the Cl2 selectivity for the CHFS samples, whereas for the DSA-type material it remained fairly constant at all applied potentials tested (ESI Fig. S2†). “Mud crack structures”, which can influence performance,29 were seen at the DSA surface but not for CHFS prepared films prepared via spin coating. The stability of both anodes were tested by fixing the applied potential and monitoring current loss over 12 h in a functioning chlorine evolution cell, the CHFS-made anode showed a 4% loss in activity, which was much better than the conventional sol–gel made DSA anode on FTO (16% loss).
In summary, a range of high surface area ruthenium–titanium oxides were prepared using a continuous hydrothermal flow synthesis (CHFS) method. Using a high throughput chemical oxidation test, both activity and selectivity (towards chloride oxidation) of these catalysts were rapidly assessed. This revealed that the ClOCs were highly active, owing partially to the high surface area. As the ruthenium content was reduced, the selectivity towards chloride oxidation increased. A 50![[thin space (1/6-em)]](https://www.rsc.org/images/entities/char_2009.gif) :
:![[thin space (1/6-em)]](https://www.rsc.org/images/entities/char_2009.gif) 50 Ru
50 Ru![[thin space (1/6-em)]](https://www.rsc.org/images/entities/char_2009.gif) :
:![[thin space (1/6-em)]](https://www.rsc.org/images/entities/char_2009.gif) Ti oxide mixture was identified as the optimum composition of the set, therefore it was used as an anode material in a light-driven brine splitting demonstrator device. The photocleavage of brine is presented as an alternative to water splitting, resulting in the formation of Cl2 gas (that is used in a number of chemical processes including water purification), and H2 (which can be stored and used as a fuel or converted to electricity via a fuel cell). This work provides a basis for the future use of our methodology to rapidly make and screen libraries of alternative nanomaterials for brine oxidation catalysts composed of inexpensive and abundant elements.
Ti oxide mixture was identified as the optimum composition of the set, therefore it was used as an anode material in a light-driven brine splitting demonstrator device. The photocleavage of brine is presented as an alternative to water splitting, resulting in the formation of Cl2 gas (that is used in a number of chemical processes including water purification), and H2 (which can be stored and used as a fuel or converted to electricity via a fuel cell). This work provides a basis for the future use of our methodology to rapidly make and screen libraries of alternative nanomaterials for brine oxidation catalysts composed of inexpensive and abundant elements.
Acknowledgements
The EPSRC is thanked for funding the projects titled “Sustainable Oxidation Catalysts for the Production of Solar Hydrogen and Chlorine from Brine” (EP/M008754/1 and EP/M008061/1).Notes and references
- O. Morton, Nature, 2006, 443, 19–22 CrossRef CAS PubMed.
- S. Bilgen, S. Keleş, A. Kaygusuz, A. Sarı and K. Kaygusuz, Renew. Sust. Energ. Rev., 2008, 12, 372–396 CrossRef.
- B. K. Sovacool, Util. Pol., 2009, 17, 288–296 CrossRef.
- Y. Tachibana, L. Vayssieres and J. R. Durrant, Nat. Photonics, 2012, 6, 511–518 CrossRef CAS.
- A. Fujishima and K. Honda, Nature, 1972, 238, 37–38 CrossRef CAS PubMed.
- D. K. Zhong and D. R. Gamelin, J. Am. Chem. Soc., 2010, 132, 4202–4207 CrossRef CAS PubMed.
- A. Mills, D. Hazafy, S. Elouali and C. O'Rourke, J. Mater. Chem. A, 2016, 4, 2863–2872 CAS.
- H. A. Hansen, I. C. Man, F. Studt, F. Abild-Pedersen, T. Bligaard and J. Rossmeisl, Phys. Chem. Chem. Phys., 2010, 12, 283–290 RSC.
- R. K. B. Karlsson and A. Cornell, Chem. Rev., 2016, 116, 2982–3028 CrossRef CAS PubMed.
- S. Trasatti, Electrochim. Acta, 2000, 45, 2377–2385 CrossRef CAS.
- S. Trasatti, Electrochim. Acta, 1984, 29, 1503–1512 CrossRef CAS.
- S. Trasatti, Electrochim. Acta, 1987, 32, 369–382 CrossRef CAS.
- H. B. Beer, J. Electrochem. Soc., 1980, 127, 303C–307C CrossRef CAS.
- T. Arikawa, Y. Murakami and Y. Takasu, J. Appl. Electrochem., 1998, 28, 511–516 CrossRef CAS.
- F. Hine, M. Yasuda and T. Yoshida, J. Electrochem. Soc., 1977, 124, 500–506 CrossRef CAS.
- T. Adschiri, Y. W. Lee, M. Goto and S. Takami, Green Chem., 2011, 13, 1380–1390 RSC.
- T. Adschiri, S. Takami, K. Minami, T. Yamagata, K. Miyata, T. Monshita, M. Ueda, K. Fukushima, M. Ueno, T. Okada, H. Oshima, Y. Mitani, S. Asahina and S. Unno, Adv. Mater. Nanotech., 2012, 700, 145–149 CAS.
- C. J. Tighe, R. Quesada-Cabrera, R. I. Gruar and J. A. Darr, Ind. Eng. Chem. Res., 2013, 52, 5572–5578 CrossRef.
- C. J. Denis, C. J. Tighe, R. I. Gruar, N. M. Makwana and J. A. Darr, Cryst. Growth Des., 2015, 15, 4256–4265 CAS.
- J. A. Darr and M. Poliakoff, Chem. Rev., 1999, 99, 495–541 CrossRef CAS PubMed.
- R. I. Gruar, C. J. Tighe and J. A. Darr, Ind. Eng. Chem. Res., 2013, 52, 5270–5281 CrossRef CAS.
- C. Y. Ma, J. J. Liu, Y. Zhang and X. Z. Wang, J. Supercrit. Fluids, 2015, 98, 211–221 CrossRef CAS.
- N. M. Makwana, C. J. Tighe, R. I. Gruar, P. F. McMillan and J. A. Darr, Mater. Sci. Semicond. Process., 2016, 42, 131–137 CrossRef CAS.
- X. Weng, J. K. Cockcroft, G. Hyett, M. Vickers, P. Boldrin, C. C. Tang, S. P. Thompson, J. E. Parker, J. C. Knowles, I. Rehman, I. Parkin, J. R. G. Evans and J. A. Darr, J. Comb. Chem., 2009, 11, 829–834 CrossRef CAS PubMed.
- N. M. Makwana, C. J. Tighe, R. I. Gruar, P. F. McMillan and J. A. Darr, Mater. Sci. Semicond. Process., 2016, 42(1), 131–137 CrossRef CAS.
- A. Mills and A. Cook, Analyst, 1987, 112, 1289–1291 RSC.
- A. R. Zeradjanin, N. Menzel, W. Schuhmann and P. Strasser, Phys. Chem. Chem. Phys., 2014, 16, 13741–13747 RSC.
- A. R. Zeradjanin, E. Ventosa, A. S. Bondarenko and W. Schuhmann, ChemSusChem, 2012, 5, 1905–1911 CrossRef CAS PubMed.
- A. R. Zeradjanin, F. La Mantia, J. Masa and W. Schuhmann, Electrochim. Acta, 2012, 82, 408–414 CrossRef CAS.
Footnote |
| † Electronic supplementary information (ESI) available. See DOI: 10.1039/c6se00057f |
| This journal is © The Royal Society of Chemistry 2017 |


