Impact of molecular structure of working fluids on performance of organic Rankine cycles (ORCs)
Maciej Z.
Lukawski
 *a,
Jefferson W.
Tester
*b and
Ronald
DiPippo
c
aCornell Energy Institute, School of Chemical and Biomolecular Engineering, Cornell University, Ithaca, NY 14853, USA. E-mail: mzl8@cornell.edu
bCornell Energy Institute, School of Chemical and Biomolecular Engineering, Atkinson Center for a Sustainable Future, Cornell University, Ithaca, NY 14853, USA. E-mail: jwt54@cornell.edu
cChancellor Professor Emeritus of Mechanical Engineering, University of Massachusetts Dartmouth, Dartmouth, MA 02748, USA. E-mail: rondipippo@comcast.net
First published on 12th April 2017
Abstract
Organic Rankine cycle (ORC) power plants are the most mature and economically competitive technology used for converting low- and medium-temperature heat to electricity, especially for renewable energy sources such as geothermal and solar thermal. This paper analyzes the performance of four types of ORC plants (subcritical and supercritical cycles, both with and without heat recuperator) optimized for maximum utilization or exergetic efficiency. The analysis was performed for 13 working fluids, heat source temperatures from 100 to 230 °C, and for cycles with either a wet cooling tower or an air cooled condenser. The primary objective of this work was to investigate the effect of the molecular structure of the working fluids on the efficiency of ORC plants. Using group contribution methods, a number of thermodynamic properties of working fluids can be easily evaluated based on their molecular structures. We show that using two of such properties, namely, the reduced ideal gas heat capacity C0p/R and the critical temperature of the working fluid, one can accurately predict a number of ORC performance metrics including: (1) maximum utilization efficiency of the ORC plant and the heat source temperature at which it is achieved, (2) sensitivity of utilization efficiency to changes in the heat source temperature, and (3) increase in both thermal efficiency and heat source outlet temperature due to addition of heat recuperator.
1. Introduction
In contrast to fossil fuels, thermal energy from renewable sources is available mostly at low temperatures, typically below 250 °C. Low-temperature renewable resources including geothermal and solar energy are widespread and, together with waste heat available from industrial processes, can provide a significant portion of the U.S. energy demand.1,2 These resources can be used directly to provide heat, or to generate electricity by employing an appropriate thermal power cycle. While low-temperature thermal energy is better aligned thermodynamically with low-temperature uses such as direct-use applications,3 the limitations in transporting thermal energy over very long distances coupled with the increased emphasis in many countries on generating electricity sustainably have created a demand for electricity generation from low-grade heat.The most widely recognized and commercially mature technology for converting low-temperature heat to electricity is the organic Rankine cycle (ORC). ORC plants feature a design similar to conventional Rankine cycle plants, but use low-boiling point organic working fluids instead of water. Because of that, ORC plants achieve higher efficiency than steam cycles at low heat source temperatures.4 Expanders in small ORC plants are also simpler and more efficient than comparable steam turbines, which makes ORC a popular choice for small (<20 MWe) biomass boilers and waste heat recovery applications.
Increased implementation of ORC technology has been supported by research aimed at improving ORC plant performance through design modifications. Recent studies have focused on the selection of both pure working fluids5–9 and multicomponent fluid mixtures,10–12 high-temperature ORCs for waste heat recovery13 and biomass boilers,14 and hybrid plants using more than one source of heat.15,16
In several earlier investigations, ORC plants were optimized either to maximize their utilization (exergetic) efficiency or, if cost information was available, to either minimize their levelized cost of electricity (LCOE),4,7,17,18 minimize the total specific cost of the plant,19 or maximize the net present value (NPV).20 These studies compared the optimal operating parameters and various performance metrics of several organic working fluids and made recommendations for optimal cycle configurations. In addition, researchers performed parametric studies of ORCs to understand the impact of individual design parameters and to develop generalized design rules.21
A number of studies have made a distinction between so-called wet and dry working fluids. With wet working fluids, the saturated vapor curve has a negative slope in temperature–entropy coordinates and thus an expansion process from saturated vapor produces a vapor–liquid mixture. For dry working fluids, the saturation curve shows a positive slope over most of the range of interest and the expansion yields superheated vapor. Fluids with nearly vertical saturated vapor lines are called “isentropic” fluids. This difference in behavior of various working fluids has been linked to their molecular complexity and quantified using molecular mass, acentric factor, reduced ideal gas heat capacity, or directly by the slope of vapor saturation line.13,22–25 Working fluids with dry expansion characteristics were shown to require less turbine inlet superheat22,25 and provide higher thermal efficiency in cycles using heat recuperators.13,21
Prior studies have also investigated other working fluid selection criteria, which can be used to identify next-generation working fluids. For example, working fluids with low molecular entropies were shown to yield higher thermal efficiencies in ORCs.8 Thermodynamic properties including compressibility factor, ideal gas isobaric heat capacity, critical temperature, liquid heat capacity, molecular weight, and heat of vaporization were linked to the specific work of the turbine and pump, size of the turbine, ORC efficiency, and optimal heat source temperature.22,24,26,27 Another approach successfully used to identify promising working fluids is computer-aided molecular design (CAMD). This method was used to analyze the impact of molecular properties, identify working fluids with the highest power output at specific conditions,9,23 and assess the uncertainty associated with such predictions.9
The majority of previous studies looked at performance of multiple working fluids at one, specific set of heat source and sink temperatures. In this paper, we explore a wide range of heat source temperatures (100–230 °C), several cycle configurations and heat rejection conditions. Furthermore, this work goes beyond a mere parametric study given its main objective to investigate and possibly correlate the thermodynamic properties of working fluids with their performance in ORCs. With such correlations, it should be possible to predict the efficiency of plants using new working fluids, some of which may not have adequately characterized thermodynamic property data available for full cycle simulation. For example, accurate equations of state (EOS) may not be available to develop precise numerical models of ORC performance. We hope to show that with the knowledge of only two thermodynamic parameters of a working fluid, namely, the reduced ideal gas heat capacity C0p/R and critical temperature Tc, it is possible to estimate several ORC plant performance metrics. Both C0p/R and Tc have been tabulated for many substances and are widely available. Furthermore, they can be estimated for the remaining working fluids using group contribution methods, e.g., by Joback and Reid28,29 and Constantinou and Gani.29,30
This work builds on the existing research by providing a simple method to evaluate performance of optimized ORC plants based on the structural formulas of working fluids. Whereas several earlier papers identified trends between fluid properties and ORC performance, we provided numerical correlations between them. The new correlations can be used to assess ORC performance at, or near, the optimal heat source temperature for the considered types of working fluids.
The paper begins by introducing various ORC plant configurations and performance metrics in Sections 2 and 3. Section 4 describes the numerical models of ORC plants used in this analysis, and Section 5 contains the results of these models. In Section 5.1, detailed results are presented for four ORC plant configurations and heat source temperatures from 100 °C to 230 °C using a single working fluid, R134a. The conclusions are then generalized in Section 5.2 using results for 13 working fluids. Building on these results, various performance metrics of ORC plants are correlated with the thermophysical properties of working fluids in Section 6. Lastly, Section 7 quantifies the sensitivity of ORC plants to the heat rejection conditions. An overview of the main steps of the methodology is provided in Table 1.
2. Types of organic Rankine cycle (ORC) plants
The principle of operation of a basic ORC plant is well-known and is presented in Fig. 1A. Thermal energy carried by a heat source fluid (hs) is transferred in a primary heat exchanger to a low-boiling-point working fluid (wf). The working fluid vapor passes through a turbine where it expands and produces work. It is then cooled and condensed at a low pressure by dissipating heat to the cooling fluid (cf). After that, working fluid is pressurized by a pump, and eventually returned to the primary heat exchanger. This cycle is presented in temperature–entropy (T–s) coordinates in Fig. 2A. The ORC shown in Fig. 1A and 2A is referred to as a subcritical (Sub) ORC, because the maximum pressure of working fluid is below its critical pressure Pc. The isothermal evaporation of working fluid in subcritical ORCs results in a large temperature mismatch between the heat source and the working fluid. This means that the log-mean temperature difference is large, which results in high irreversibility for the heat transfer process and reduces the maximum work potential (exergy).31 To reduce this irreversibility and improve turbine power output, the maximum pressure in ORC can be increased above working fluid critical pressure. Such cycles are referred to as supercritical (Sc) ORC, and an example is of such cycle is presented in Fig. 2B. As a result of a higher maximum cycle pressure, the work consumed by the pump in supercritical ORC is significantly higher compared to a subcritical ORC, partially offsetting the increased turbine output.22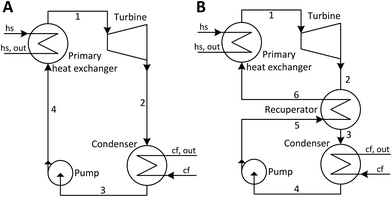 | ||
| Fig. 1 Schematics of organic Rankine cycle (ORC) plants. (A) ORC plant with no recuperator (NR). (B) ORC plant with a heat recuperator (R). | ||
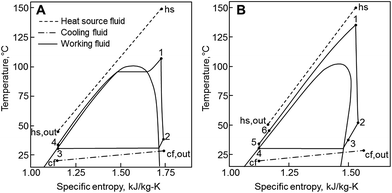 | ||
| Fig. 2 Temperature–entropy (T–s) diagrams of ORC. (A) Subcritical cycle with no recuperator (Sub-NR) using R-134a. (B) Supercritical cycle with a recuperator (Sc-R) using R-227ea. | ||
ORC plants may use an additional heat exchanger called a recuperator, where feasible. This component is an internal heat exchanger, as shown in Fig. 1B, and its effects are presented on a T–s diagram in Fig. 2B. If the vapor at turbine exit (2) is superheated, a recuperator might be used to transfer a fraction of the vapor sensible heat (2 → 3) to the liquid (5 → 6) before it enters the primary heat exchanger. By doing that, the addition of recuperator results in increases of both the temperature of the heat source fluid leaving ORC plant Ths,out and the thermal efficiency of the cycle.13,32 However, a sufficient degree of superheat must be available for the recuperator to be practically feasible. In this work, cycles with recuperators are designated with (R) and cycles with no recuperators are abbreviated as (NR).
3. Performance metrics of ORC
Three types of efficiency are used in this analysis: utilization efficiency ηu, thermal efficiency ηth and, as a reference, thermal efficiency of an ideal triangular cycle ηth,tri. Utilization efficiency, also referred to as exergetic (or Second Law) efficiency, is defined as the ratio of the net power output of the plant to the exergy rate of the incoming heat source fluid:33 | (1) |
Thermal efficiency is the ratio of the net power output to the thermal power input into the cycle:
 | (2) |
Thermal efficiency determines what fraction of the heat withdrawn from the heat source is converted into electricity. It does not, however, quantify how much heat is taken out from the heat source fluid. Because of that, high thermal efficiency does not always correspond to high net power output. Thermal efficiency is a suitable performance metric for combined heat and power (CHP) plants, which utilize the partially cooled fluid leaving the ORC plant for direct use applications.
Lastly, the triangular (or trilateral) cycle is used as a reference ideal cycle, against which the thermal efficiencies of ORC plants can be compared.34 Triangular cycle is an equivalent of a Carnot cycle for heat sources with a finite and constant heat capacity, i.e., non-isothermal heat transfer. The temperature of the heat source in an ideal triangular cycle is brought to the dead state temperature T0 by reversible heat transfer to the working fluid. Thermal efficiency of ideal triangular cycle is expressed as:34
 | (3) |
4. ORC models
4.1. Structure and assumptions of ORC models
The models of ORC plants used in this analysis were created with a goal to provide realistic performance figures and a fair comparison basis for different working fluids. The ORC plants were modeled in Aspen HYSYS v8.4 using thermodynamic properties from REFPROP v8.0 equations of state (EOS).35 Four different configurations of ORC plants were considered:• Subcritical ORC with no heat recuperator (Sub-NR).
• Subcritical ORC including heat recuperator (Sub-R).
• Supercritical ORC with no heat recuperator (Sc-NR).
• Supercritical ORC including heat recuperator (Sc-R).
Simulations for heat source temperatures Ths between 100 °C and 230 °C were run in 10 °C intervals. The base-case simulations were performed for ORC using a wet cooling tower (WCC), with 17 °C wet bulb temperature T0 providing 20 °C cooling water at the condenser inlet. Additionally, Section 7 presents sensitivity of the net power output to the dry bulb temperature and relative humidity, along with results for ORC using an air-cooled condenser (ACC). In ACC, the increase in air temperature was set at half of the temperature difference between the working fluid condensing temperature and the inlet air dry bulb temperature, which was previously found to maximize the net power output.17 The dead state conditions for base-case ORC with wet cooling tower were set at 17 °C and 1 bara.
Pinch-point temperature differences of 3 °C were adopted for all heat exchangers with the exception of the ACC.18 The working fluid pressure drops in heat exchangers were ignored, but should be calculated for each individual plant configuration during more advanced design phases.
The isentropic efficiencies of turbines (dry expansion) and pumps were set at 85% and 75%, respectively. They were assumed to be the same for all working fluids, and the effects of individual fluids properties on the isentropic turbine efficiency were ignored. In addition, the turbine efficiency was decreased if wet expansion occurred. Following the empirical Baumann rule, isentropic efficiency was reduced by 1% for every percentage of average moisture present during expansion.32,36 In addition, the minimum turbine exhaust vapor quality was set at 0.9 to prevent blade erosion.
To enhance the stability of operation and avoid significant fluctuations in thermodynamic properties occurring near the critical point, the maximum evaporation pressure in subcritical cycles was set at 90% of critical pressure Pc.17 In supercritical cycles, the minimum high pressure corresponds to 110% of Pc.17 The summary of the ORC model assumptions is presented in Table 2.
| Design parameter | Value/properties |
|---|---|
| 1. Heat source | |
| Substance | Liquid water |
| Temperature range | 100–230 °C |
| Pressure | 100 bara |
| 2. Heat exchangers | |
| General characteristics | Countercurrent, single pass, split into 50 intervals with equal Δh |
| 2.1. Primary heat exchanger | |
| Pinch point temperature difference | 3 °C |
| Hot end temperature approach | ≥5 °C |
| 2.1.1. Subcritical ORC | |
| Maximum turbine inlet pressure | 0.9*Pc |
| Minimum turbine inlet vapor superheat | 1 °C |
| 2.1.2. Supercritical ORC | |
| Minimum turbine inlet pressure | 1.1*Pc |
| 2.2. Recuperator (in Sub-R and Sc-R configurations) | |
| Pinch point temperature difference | 3 °C |
| 2.3. Condenser and heat rejection system | |
| 2.3.1. Water-cooled condenser with wet cooling tower (WCC) – base case | |
| Condenser | |
| Pinch point temperature difference | 3 °C |
| Cooling water inlet temperature | 20 °C (6–34 °C)* |
| Cooling water temperature rise | 8 °C (ref. 37) |
| Wet cooling tower | |
| Inlet air dry bulb temperature | 24 °C (10–35 °C)* |
| Relative humidity of entering air | 50% (25%, 75%)* |
| Relative humidity of exiting air | 98% |
| Approach to wet bulb temperature | 3 °C (ref. 38) |
| Wet bulb temperature rise | 7 °C |
| Pressure rise of cooling fan | 170 Pa (ref. 18 and 39) |
| Isentropic efficiency of fan | 0.65 (ref. 18) |
| Isentropic efficiency of circulation pump | 0.75 |
| Cooling water pressure drop | 1.5 bar |
| 2.3.2. Air-cooled condenser (ACC)* | |
| Inlet air dry bulb temperature | 10–35 °C* |
| Air temperature rise | 0.5*(Tcond − Tair,in) (ref. 17) |
| Power consumption | 0.25 kW per kg per s of air flow (ref. 16 and 17) |
| 3. Expander | |
| Isentropic efficiency | 85% for vapor-only expansion <85% when liquid present – Baumann rule (ref. 17) |
| Minimum exhaust vapor quality | 0.9 (ref. 17) |
| Generator efficiency | 98% (ref. 17) |
| 4. Working fluid pump | |
| Isentropic efficiency | 75% (ref. 32) |
4.2. Optimization
All ORC plants were optimized with a goal of maximizing their utilization efficiency ηu, which is equivalent to maximizing their specific power output (kWe per kg per s of heat source fluid) for the given heat resource conditions. The BOX method available in Aspen HYSYS was used for this purpose.40 This method is based on the complex method by Box,41 the Downhill Simplex algorithm,42 and the BOX algorithm.43 The BOX algorithm is a slow, but robust method of finding the extrema of functions, which can accommodate inequality constraints. The reliability of the optimization method was confirmed by systematically varying the initial values of the optimized variables and running the algorithm. The models always converged to the same solutions, independent of the initial values of the optimized variables.Different variables were optimized depending on the type of cycle. In subcritical ORC models they included evaporation temperature, condensation pressure, and the turbine inlet superheat, i.e., the difference between turbine inlet temperature and evaporation temperature. In supercritical ORCs, optimized variables were: turbine inlet temperature, turbine inlet pressure and condensing pressure. In all cycles the turbine exhaust vapor quality was constrained by the optimization procedure to values ≥0.9.
4.3. Selection of working fluids
Working fluids were selected based on their availability, cost, and effects on health and environment. They were also chosen to represent a range of critical temperatures (66–174 °C), slopes of vapor saturation line (corresponding to wet, isentropic, and dry expansion), and several families of compounds (HFCs, HCFCs, PFCs, alkanes, and cycloalkanes).Table 3 lists the fluids investigated in this analysis along with selected properties including: critical temperature (Tc) and pressure (Pc); molar mass (M); reduced ideal gas heat capacity (C0p/R) evaluated at the average of working fluid critical temperature and the heat sink temperature; indication of the type of saturated vapor curve (wet/isentropic/dry); normal boiling point (TB), ozone depletion potential (ODP), global warming potential (GWP), and fluid safety group according to the ASHRAE classification. The list includes high-GWP refrigerants such as R-134a or R-125 which, although still in common use, are being phased down in the European Union and other countries.44,45 They are expected to be replaced by the low-GWP compounds listed in Table 3, such as propane, isobutane, and R-152a.
| Name | Formula | T c (°C) | P c (bar) | M (g mol−1) | C 0p/R | Fluid type | T B (°C) | ODP | GWP (100 yr) | Safety group |
|---|---|---|---|---|---|---|---|---|---|---|
| R-125 | CF3CHF2 | 66.0 | 36.2 | 120.0 | 11.8 | Wet | −48.1 | 0 | 3500 | A1 |
| R-218 | CF3CF2CF3 | 71.9 | 26.4 | 188.0 | 18.5 | Dry | −37.8 | 0 | 8830 | A1 |
| R-143a | CF3CH3 | 72.7 | 37.6 | 84.0 | 9.8 | Wet | −47.2 | 0 | 4470 | A2 |
| R-32 | CH2F2 | 78.1 | 57.8 | 52.0 | 5.4 | Wet | −51.7 | 0 | 675 | A2 |
| Propane | CH3CH2CH3 | 96.7 | 42.5 | 44.1 | 9.6 | Wet | −42.1 | 0 | 3 | A3 |
| R-134a | CF3CH2F | 101.1 | 40.6 | 102.0 | 11.0 | Isentropic | −26.1 | 0 | 1430 | A1 |
| R-227ea | CF3CHFCF3 | 102.8 | 29.3 | 170.0 | 17.5 | Dry | −16.4 | 0 | 3220 | A1 |
| R-152a | CHF2CH3 | 113.3 | 45.2 | 66.1 | 8.9 | Wet | −24.0 | 0 | 124 | A2 |
| Cyclopropane | cyclo-C3H6 | 125.2 | 55.8 | 42.1 | 7.9 | Wet | −32.5 | 0 | 20 | — |
| Isobutane | CH(CH3)3 | 134.7 | 36.3 | 58.1 | 13.4 | Dry | −11.8 | 0 | 20 | A3 |
| R-142b | CClF2CH3 | 137.1 | 40.6 | 100.5 | 11.1 | Isentropic | −9.1 | 0.07 | 2310 | A2 |
| R-236ea | CF3CHFCHF2 | 139.3 | 34.2 | 152.0 | 17.0 | Dry | 6.2 | 0 | 1370 | — |
| R-245ca | CHF2CF2CH2F | 174.4 | 39.3 | 134.1 | 16.7 | Dry | 25.1 | 0 | 693 | A1 |
As indicated by the normal boiling point, none of the working fluids would create vacuum in the condenser as long as condensing temperature exceeds 25 °C. This conservative design reduces the risk of air leakage into the system, and thus potential performance issues. In ASHRAE 34 standard, ‘A’ denotes low toxicity and ‘1’, ‘2’, and ‘3’ indicate no flame propagation, lower flammability, and higher flammability, respectively.46 It should be noted that R236ea has not been considered for supercritical configurations due to the limited range of EOS implemented in the REFPROP database.
As shown in Fig. 3, reduced ideal gas heat capacity C0p/R and critical temperature Tc describe the shape of binodal coexistence curve on a T–s diagram. C0p/R is related to the slope of vapor saturation line on a T–s diagram and therefore affects the phase composition at turbine exhaust. Fluids with low C0p/R (<11) have a conventional Gaussian-like saturation curve, and expansion of saturated vapor usually results in a 2-phase mixture. Such working fluids are referred to as ‘wet’ and are represented in Fig. 3 by R-32 and R-152a. ‘Dry’ fluids such as R-227ea have high C0p/R (>11) and retrograde vapor saturation lines resulting in superheated vapor at the turbine exhaust. We found that fluids with C0p/R of approximately 11 have nearly vertical (isentropic) vapor saturation lines.
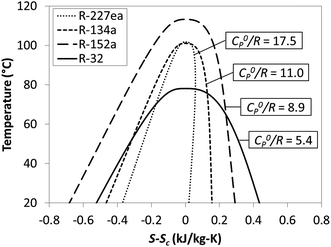 | ||
| Fig. 3 Example of four working fluids representing a range of reduced ideal gas heat capacities C0p/R. | ||
5. Results
5.1. Detailed results for a selected working fluid – R134a
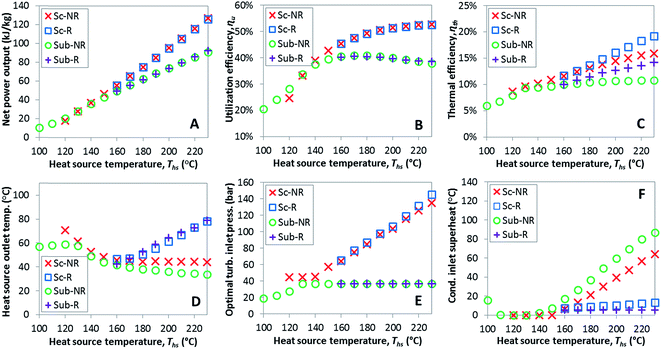
This section provides detailed results of numerical ORC models for a representative working fluid, R-134a. Our conclusions, however, are broader and representative of the range of fluids investigated in this work. The main goals of this section are to provide a context for the more generalized results presented in later sections and show the operating parameters corresponding to the optimized ORC configurations. In addition, this chapter highlights the differences in the characteristics of the four analyzed ORC configurations.The selected parameters of optimized ORCs are presented in Fig. 4A–F using R-134a. Fig. 4A shows, that supercritical cycles provide higher power output than subcritical ORC at medium and high heat source temperatures Ths (e.g., for R134a > 140 °C). This was not true at lower source temperatures less than 20 to 40 °C above the working fluid critical temperature Tc. The increased net power output of supercritical cycles translates into higher utilization efficiency presented in Fig. 4B. For R-134a the utilization efficiencies for subcritical and supercritical ORC achieve their respective maxima at heat source temperatures of 175 °C and 250 °C, respectively. These optimum heat source temperatures maximizing the utilization efficiency are denoted as  .
.
In addition to higher utilization efficiency, supercritical cycles typically provide higher thermal efficiency than subcritical ORC, as shown in Fig. 4C. As a direct consequence of that, supercritical cycles can provide increased heat source outlet temperatures despite higher power outputs. In other words, supercritical ORCs not only produce more power than subcritical cycles, but often do so while withdrawing less thermal energy from the heat source.
In the majority of the optimized cycles the heat source fluid is cooled to low temperatures, which may be troublesome in some applications. For example, in geothermal power plants excessive cooling of brine may induce scaling, especially of silica compounds, and reduce the heat transfer coefficient of the primary heat exchanger. In waste heat recovery applications, cooling gaseous heat sources below their dew points would lead to condensation of corrosive liquids necessitating the use of more expensive materials. These issues can be alleviated by installing a heat recuperator. Fig. 4C and D show that the addition of heat recuperator results in increased thermal efficiency and heat source outlet temperature. The positive effects of using a recuperator increase with heat input temperature and are higher in subcritical cycles compared to supercritical cycles.
The optimal turbine inlet pressures are presented in Fig. 4E. In subcritical cycles, turbine inlet pressure increases with the heat source temperature Ths until it reaches the maximum allowable reduced pressure Pr of 0.9. In supercritical cycles, optimum turbine inlet pressure corresponds to the minimum allowed Pr of 1.1 at low Ths and increases at higher Ths (>140 °C for R-134a). The nearly linear increase in pressure for supercritical ORC from 140 to 200 °C is an extension of the same trend for subcritical cycle from 100 to 130 °C.
The implementation of the Baumann rule generally resulted in avoiding wet turbine expansions. In subcritical ORC, all optimized configurations have either saturated or superheated vapor at turbine exhaust. At low Ths (for R-134a < 130 °C), the optimization procedure selected a sufficient turbine inlet superheat to obtain saturated vapor at turbine exhaust. At higher Ths, the turbine exhaust temperature increases nearly linearly with the Ths, as shown in Fig. 4F. In supercritical ORCs, there can be moisture present in turbine's exhaust if the Ths is very low (e.g., for R-134a < 130 °C). In these cases, however, supercritical cycles provide lower power output than subcritical ORC and therefore would not be selected over the basic subcritical cycle.
5.2. Generalized results for multiple working fluids
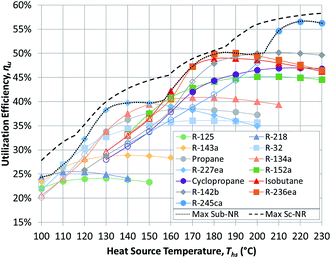
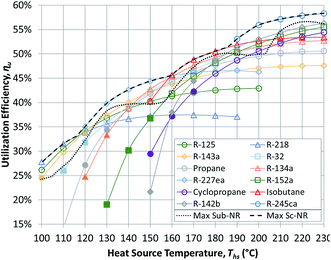
Having reviewed the detailed findings for R-134a, this section presents more general results for all 13 working fluids listed in Table 3. These results are then used in the next section to correlate the performance of ORCs with working fluid properties. The results presented in this section were validated using published values from an earlier study.17Fig. 5 and 6 show the utilization efficiencies ηu of various working fluids as functions of heat source temperature Ths for Sub-NR and Sc-NR cycles, respectively. Dotted and dashed lines mark the composite curves of maximum ηu for Sub-NR and Sc-NR cycles. The most efficient Sc-NR cycles provide between 1% and 17% higher ηu compared to the best Sub-NR cycles. The ηu curves for supercritical ORC are also less convex compared to the subcritical cycle. As a result, a single working fluid may be used near-optimally in a supercritical ORC over a broader range of heat source temperatures without sacrificing much in utilization efficiency. Fluids with high reduced ideal gas heat capacities C0p/R (R-218, R-227ea, R-236ea, R-245ca) yield higher ηu compared to fluids with low C0p/R (R-32, R-152a, cyclopropane), particularly in the subcritical cycle, for any given heat source temperature.
The composite curves of maximum utilization efficiency ‘Max Sub-NR’ and ‘Max Sc-NR’ are composed of results for eight best performing working fluids. However, four fluids (R218, R227ea, isobutane, and R-245ca) are sufficient to provide very high utilization efficiencies across the considered temperature spectrum. Some of the low-GWP fluids (isobutane, R-142b, R-152a) perform well at heat source temperatures between 160 and 200 °C, but they cannot match the performance of R-227ea and R-218 at low heat source temperatures and R-245ca above 200 °C.
Fig. 5 and 6 show that each working fluid achieves its maximum utilization efficiency at a particular heat source temperature. At these conditions, the optimal reduced turbine inlet pressure Pr in subcritical ORC is 0.9 for each working fluid. This high evaporation pressure reduces exergy loss in the primary heat exchanger by providing a better temperature match in preheater and a lower enthalpy of vaporization. Depending on the working fluid used, Pr of 0.9 was achieved at absolute heat source temperatures of at least 1.06*Tc to 1.09*Tc. For supercritical ORCs to reach high efficiency operation, the situation was different than for subcritical cycles. We found that working fluids in supercritical ORCs reached their peak performance at conditions, where optimal Pr was above 1.1.
The utilization efficiencies of the top-performing cycles with recuperators are not shown in Fig. 5 and 6 because they are typically only 0.5% lower than for cycles without a recuperator. This small drop in power output is a combination of two factors: (1) a larger decrease in power due to shifting the location of the pinch point in the condenser leading to an increase in condensing pressure, and (2) a smaller increase in power due to the lower condenser duty and the resulting lower parasitic power consumption of the cooling tower. In actual plants, the power output of cycles with a recuperator would be even lower due to the pressure loss in the recuperator and resulting increased turbine backpressure. Depending on the working used, each 0.1 bar increase in turbine backpressure would cause between 0.2% (for R-32) to 1.6% (for R-245ca) drop in utilization efficiency. The effects of pressure loss in recuperator would be more significant for fluids with high critical temperatures, which typically have low condensing pressures and high turbine exhaust volumetric flow rates.
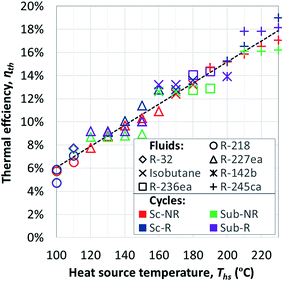
Fig. 7 shows the thermal efficiency of ORC plants with the highest utilization efficiencies. ORC plants using a heat recuperator were included if the equivalent non-recuperated cycles had sufficiently hot turbine exhaust gases to transfer heat to the pressurized liquid working fluid. Thermal efficiency of ORC plants with a recuperator was on average 6.5% higher compared to equivalent cycles without recuperator. The increase in thermal efficiency was particularly high for dry fluids with high C0p/R and for heat source temperatures Ths much above fluid critical temperature Tc. As we will show in the next section, the effects of adding a heat recuperator can be in fact predicted based on these three parameters: C0p/R, Tc, and Ths.
The thermal efficiencies of ORC cycles were approximated in Fig. 7 with the following linear trend:
| ηth = 9.09 × 10⁻⁴ × Ths − 0.03 | (4) |
6. Correlations between ORC performance and working fluid properties
Given the large number of potential ORC working fluids, it is useful to develop guidelines for their selection. Such guidelines could help to pre-screen fluids for applications at various heat source temperatures. This insight would be particularly helpful in analyzing less common fluids, for which the EOS are unavailable or inaccurate, making numerical modeling unreliable and plant design challenging. In this section, we present correlations for evaluating a number of ORC performance metrics based on the heat source temperature Ths, the working fluid critical temperature Tc, and the reduced ideal gas heat capacity C0p/R. This is the main and most novel contribution of this work. C0p/R and Tc were identified as the most relevant fluid properties based on: (1) their ability to describe the shape of the coexistence curve on a T–s diagram; (2) the use of C0p/R in equation of state formulas for changes in reduced enthalpy and entropy between two thermodynamic states;52 and (3) ease and accuracy of evaluating these properties based on molecular structure of fluid.28–30The following analysis is split into two parts. The first discusses predictive methods for assessing utilization efficiency of ORC plants without a recuperator. This analysis includes developed correlations for the following performance metrics: maximum utilization efficiency  , heat source temperature at which utilization efficiency is maximized
  , and sensitivity of utilization efficiency to the changes in heat source temperature. The second section provides correlations for assessing the impacts of heat recuperators on thermodynamic performance of ORCs. The two main objectives of heat recuperators are to increase thermal efficiency and reduce excess cooling of the heat source fluid, as might be important from a chemical scaling perspective. Therefore, we correlated working fluid properties with the changes in thermal efficiency ηth and heat source outlet temperature Ths,out due to installing heat recuperators. The developed correlations are valid for the types of considered working fluids (halogenated and non-halogenated alkanes) with values of Tc from 66 to 174 °C and C0p/R from 5.4 to 18.5, as listed in Table 3. The follow-up work based on this study found, however, that similar correlations could be developed for other types of working fluids including fluorinated alkenes, siloxanes, and ethers.53
6.1. Correlations for assessing utilization efficiency
Fig. 5 and 6 demonstrated, that each working fluid achieves its maximum utilization efficiency at a particular heat source temperature
  . The following analysis shows that it is possible to predict both
  and
and  based on the molecular structure of the working fluid.
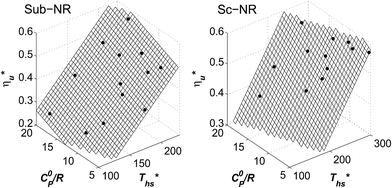
Fig. 8 illustrates that the optimal heat source temperature  is strongly correlated with C0p/R and Tc of the working fluid. Knowing both C0p/R and Tc, one can accurately determine
  for various heat rejection conditions. Supercritical cycles achieve their maximum utilization efficiencies
  at much higher heat source temperatures than subcritical ORC, especially when using wet working fluids such as R-32 or R-152a. The results for subcritical and supercritical cycles were approximated in Fig. 8 with linear trends, providing reasonable R2 values of 0.9 and 0.87 and standard deviations of 6.4 °C and 15.3 °C, respectively. The fitted linear trends are described by eqn (A-1) in the Appendix. The scatter in results presented in Fig. 8 is partially due to the assumption of an equal condenser pinch-point temperature difference for all working fluids. This assumption led to small variations in the condensing temperatures of individual fluids, a result of unequal vapor superheat at condenser inlet. The impact of this scatter is small, because the utilization efficiency curves presented in Fig. 5 and 6 are relatively flat near their maxima. If fact, utilization efficiencies at heat source temperatures predicted by the linear trends in Fig. 8 are on average only 0.4% lower compared to
  obtained at
  .
.
In this work, C0p/R of each working fluid was evaluated at a representative temperature corresponding to the arithmetic average of the heat sink temperature and fluid critical temperature. This temperature was selected to be consistent with the average slope of the vapor saturation line along turbine expansion path. The reduced ideal gas heat capacity proved to be a much better predictor of  than acentric factor or molar mass, for which equivalent correlations yielded R2 values of only 0.18 and 0.55, respectively.
Molecular structure of working fluid determines not only the optimal heat source temperature  , but also the maximum utilization efficiency
  achieved at
  . Fig. 5 showed that dry fluids with C0p/R >11 (e.g., R-218, R-227ea, R-236ea, R-245ca) achieve higher peak utilization efficiencies than wet fluids characterized by low C0p/R <11 (e.g., R-32, cyclopropane, R-152a). The value of
  is, in fact, strongly correlated with
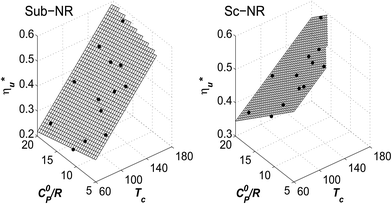
  and C0p/R for both subcritical and supercritical ORCs. This correlation, shown in Fig. 9, indicates that for working fluids with comparable
  , the maximum utilization efficiency
  increases with C0p/R. This is largely a result of a better temperature match in the primary heat exchanger achieved at
  by dry fluids (C0p/R > 11) as compared to wet fluids (C0p/R < 11). In Fig. 9, the results from the ORC models are represented by the markers and are approximated using fitted trends linear in
  and C0p/R. These fitted correlations described by eqn (A-2) in the Appendix provide reasonable regression coefficients R2 of 0.96 and 0.93 for subcritical and supercritical ORCs, respectively. The R2 values indicate that 93% to 96% of the variability in
  can be explained by the
  and C0p/R of the examined fluids. The variations in
  alone could account for only 79% to 84% of the variability in
  , which emphasizes the importance of C0p/R as a predictor of working fluid performance in ORC.
The optimal heat source temperature  used as abscissa in Fig. 9 is an empirical function of Tc and C0p/R, which was illustrated in Fig. 8. Because of that, the
  can also be correlated directly with the working fluid properties: Tc and C0p/R. The correlation between
  , Tc, and C0p/R is presented in Fig. 10 for both subcritical and supercritical ORCs. The results from models are represented by markers. The fitted trends shown in Fig. 9 are described by eqn (A-3) in the Appendix and provide reasonable R2 values of 0.96 and 0.93 for Sub-NR and Sc-NR cycles, respectively.
Fig. 8 and 10 are the key results of this work. They prove that it is possible to predict the maximum utilization efficiency  of ORC plants and the heat source temperature
  at which it is achieved based on the molecular structure of the working fluid. This work identified Tc and C0p/R as key properties used to predict the working fluid performance in ORC. Both of these parameters can be evaluated based on molecular structures of working fluids using group contribution methods.28–30Tc and C0p/R were also experimentally measured and tabulated for many working fluids.29
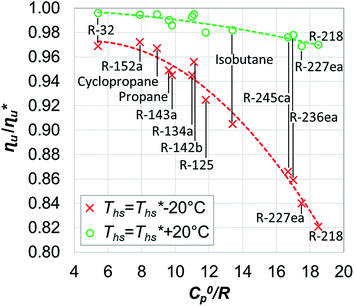
While Fig. 8–10 assess the maximum utilization efficiency and conditions at which it is achieved, they provide no information about the ORC performance at other, non-optimal, heat source temperatures. Fig. 5 showed, that in subcritical ORCs, fluids with high C0p/R (e.g., R-218, R-227ea, R-236ea, R-245ca) achieve high utilization efficiency over a narrow range of heat source temperatures compared to fluids with low C0p/R (e.g., R-32, cyclopropane, R-152a). To provide a measure of ORC performance for near-optimal heat source temperatures, Fig. 11 quantifies the drop in utilization efficiency at heat source temperatures above and below  . In Fig. 11, the utilization efficiency of each working fluid in subcritical ORCs is presented for heat source temperatures Ths 20 °C above and 20 °C below
  . The utilization efficiencies are expressed as a fraction of the maximum utilization efficiency
  achieved at
  , and presented as function of C0p/R. At heat source temperatures 20 °C below
  , fluids with high C0p/R achieve only 88–92% of their
  , while fluids with low C0p/R achieve approximately 99% of
  . For dry fluids, reducing the Ths by 20 °C below
  results in a poorer temperature match in the preheater, and thus less heat recovered from the heat source and a lower utilization efficiency. An equivalent drop in Ths has a much smaller effect on the effectiveness of heat recovery in ORCs using wet working fluids. This discrepancy is due to the difference in optimal configurations of ORC plants using heat input at temperature
  . Wet fluids require significant vapor superheat at turbine inlet and their optimal evaporation temperature is much below the heat source temperature
  , whereas dry fluids require little to no superheat, and their optimal evaporation temperature is closer to
  . Fig. 11 shows, that at heat source temperatures 20 °C above
  , the decrease in utilization efficiency is far less significant than 20 °C below
  , but it is also correlated with C0p/R. Polynomial trends fitted to data in Fig. 11 and described by eqn (A-4) in the Appendix have reasonable correlation coefficients R2 of 0.97 and 0.86 for 20 °C below and 20 °C above
  , respectively.
6.2. Correlations for assessing the effects of heat recuperators
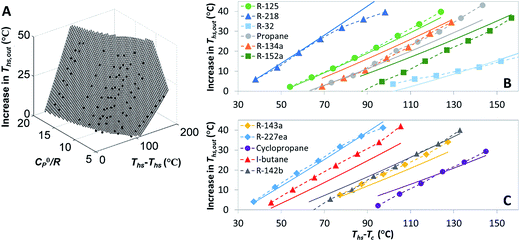
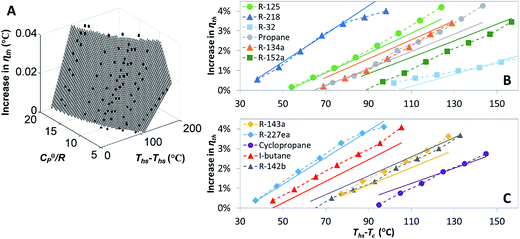
In addition to correlating working fluid properties with their performance in ORCs, rules-of-thumb may be useful for evaluating the effects of adding recuperators to ORC plants. This section illustrates that the increase in both the thermal efficiency ηth and the heat source outlet temperature Ths,out due to the addition of a recuperator to supercritical ORC can be quantified using C0p/R and the difference between the heat source temperature and working fluid critical temperature (Ths − Tc). These variables are correlated because the increases in ηth and Ths,out are proportional to the degree of superheat present in turbine exhaust gases. This quantity is, in turn, determined by the turbine inlet temperature, the isentropic efficiency of the turbine, and the reduced ideal gas heat capacity C0p/R. Our results show that the turbine inlet temperature is a near-linear function of Ths for cycles which can accommodate a recuperator.Fig. 12 shows the increase in the heat source outlet temperature Ths,out caused by the addition of a recuperator. This parameter is presented as a function of C0p/R and (Ths − Tc). In Fig. 12A, results from the models are represented by the markers. They were approximated using a polynomial surface that is first-order in C0p/R and second-order in (Ths − Tc). This correlation is described by eqn (A-5) in the Appendix and provides a reasonable coefficient of determination R2 of 0.91, suggesting that the effects of using heat recuperators can be accurately predicted for other fluids for which the C0p/R and Tc are known and within the ranges covered here. To better illustrate the accuracy of the fitted correlation, Fig. 12B and C show the results from ORC simulation models using markers and dashed lines and from the corresponding predictions of the polynomial correlation using continuous lines. The data was split into two figures (B and C) to enhance the clarity and avoid overlap.
In a similar way, the increase in thermal efficiency provided by addition of recuperators to supercritical ORCs was quantified and presented in Fig. 13. The regression coefficient R2 for polynomial fitted to the data was 0.9. The observed absolute increase in thermal efficiency of up to 4 percentage points is substantial because most of presented configurations have a base-case thermal efficiency between 10% and 20%.
Results presented in Fig. 12 and 13 suggest that dry fluids with reduced ideal gas heat capacities above 11 (e.g. isobutane, R-227ea, R-218) and critical temperatures at least 50–70 °C below the heat source temperature would be particularly good candidates for Sc-R cycles used in combined heat and power (CHP) applications.
7. Heat rejection systems
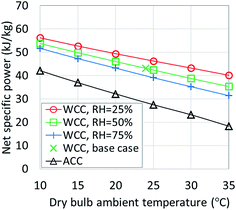
The largest variability in performance of existing ORC plants is caused by the type of heat rejection system used, although the choices of the appropriate working fluid and the cycle operating parameters are also important. All of the ORC simulations discussed so far used a water cooled condenser (WCC) coupled with a wet, mechanical induced draft cooling tower. The inlet air dry bulb temperature was 24 °C, wet bulb temperature T0 was 17 °C and the relative humidity was 50%. Fig. 14 shows the sensitivity of the net specific power output (in kWe per kg per s or kJ per kg of heat source fluid flow) to the changes in dry bulb temperature and relative humidity. In addition, it includes results for an ORC plant using an air cooled condenser (ACC). The selected plant configuration uses a Sub-NR R-134a cycle and 150 °C heat source temperature.In moderate climates representative of the Eastern U.S. (15 °C, 70% RH), a cycle with a WCC provides 25% higher power compared to an ACC plant. In warm, dry weather encountered in the Western U.S. (e.g., during an average summer afternoon in Reno, Nevada at 30 °C and 20% RH), power output with WCC can be nearly double of that with ACC. This difference is due to both the higher parasitic power consumption of ACC fans and the increased condensing pressure caused by the ACC. At heat source temperatures below 150 °C, the power advantage of cycles with WCC is even greater than that presented in Fig. 14.
8. Conclusions
This study analyzed four different ORC power plant configurations using heat sources from 100 °C to 230 °C, 13 different working fluids, and 2 types of heat rejection systems. The models employed were optimized for maximum utilization efficiency and validated using results from previous numerical studies17 and performance data from actual ORC plants.34The key result of this work was correlating the efficiency of ORC plants with the thermodynamic properties of working fluids. Two selected fluid properties – reduced ideal gas heat capacity C0p/R and critical temperature Tc can be evaluated from data or, for less characterized working fluids, using group contribution methods. The latter approach provides a method for evaluating the ORC plant performance based on the characteristics of the heat source and the heat sink, and the molecular structure of the working fluid. Because of that, the correlations developed in the paper can be used to pre-screen potential ORC working fluids which may not have sufficiently accurate equation of state (EOS) models. We showed that in ORC plants optimized for maximum utilization efficiency, C0p/R and Tc can be used to accurately predict: (1) maximum utilization efficiency  for a given working fluid, (2) heat source temperature
  at which
  is achieved, (3) sensitivity of utilization efficiency to the changes in heat source temperature, and (4) increase in thermal efficiency and heat source fluid outlet temperature due to addition of a heat recuperator.
Furthermore, we found that supercritical ORC provide up to 17% higher utilization efficiencies and increased thermal efficiencies compared to subcritical ORC. A single working fluid can be also effectively used in supercritical ORC over a broader range of heat source temperatures. Subcritical cycles, on the other hand, experience higher thermal efficiency increase when equipped with heat recuperators.
Adding a recuperator to the top performing sub- and supercritical configurations resulted, on average, in a 0.5% drop in net power output and a 6.5% increase in thermal efficiency. It also increased the temperature of heat source fluid leaving ORC plant, which may help avoid scaling in geothermal ORC plants and condensation of flue gases in many heat recovery applications.
The type of heat rejection system employed in the power cycle has a large impact on the efficiency of an ORC, especially for cycles utilizing low-temperature heat sources. In moderate climates, the use of an air cooled condenser results in only 20% penalty in net power output compared to a wet cooling tower. In warm and arid conditions, this difference increases to as much as 50%.
Appendix
The correlations listed in this section are limited to the ranges of Tc (66 °C to 174 °C) and C0p/R (5.4 to 18.5) evaluated in this work.The linear trends fitted to data in Fig. 8 are correlated by eqn (A-1):
 | (A-1) |
The linear functions fitted to data in Fig. 9 are described by eqn (A-2):
 | (A-2) |
| Sub-NR | Sc-NR | |
|---|---|---|
| d | −0.199 | −0.1746 |
| e | 2.854 × 10⁻³ | 2.33 × 10⁻³ |
| f | 8.86 × 10⁻³ | 1.06 × 10⁻² |
| σ | 2.3% | 1.9% |
The linear trends fitted to the results in Fig. 10 are described by eqn (A-3):
 | (A-3) |
| Sub-NR | Sc-NR | |
|---|---|---|
| i | 0.121 | 0.464 |
| j | 3.18 × 10⁻³ | 1.71 × 10⁻³ |
| k | −4.7 × 10⁻³ | −1.11 × 10⁻² |
| σ | 2.2% | 1.9% |
The trends fitted to data in Fig. 11 are correlated by eqn (A-4):
 | (A-4) |
 is the fraction of the maximum utilization efficiency, and coefficients l, m, n, and o are listed in Table 6.
The polynomial functions fitted to data in Fig. 12 and 13 are described by eqn (A-5):
 | (A-5) |
| Z= | Increase in Ths,out | Percentage point increase in ηth |
|---|---|---|
| A | −25.09 | −0.03347 |
| B | −0.02852 | 0.0001015 |
| C | 0.3358 | 0.0007033 |
| D | 0.000634 | 1.332 × 10⁻⁷ |
| E | 0.03539 | 3.179 × 10⁻⁵ |
| σ | 3.6 °C | 0.4% |
Nomenclature
| C | Heat capacity |
| E | Exergy |
| GWP | Global warming potential |
| h | Specific enthalpy |
| M | Molar mass or molecular weight |
| ṁ | Mass flow rate |
| NR | No recuperator |
| ODP | Ozone depletion potential |
| ORC | Organic Rankine cycle(s) |
![[Q with combining dot above]](https://www.rsc.org/images/entities/i_char_0051_0307.gif)
| Heat flow rate |
| R | Recuperator |
| R | Specific gas constant |
| RH | Relative humidity [%] |
| s | Specific entropy |
| Sc | Supercritical ORC |
| Sub | Subcritical ORC |
| T | Temperature |
| Ẇ | Power |
| η | Efficiency |
| σ | Standard deviation |
Superscripts
| 0 | Ideal gas state |
| * | Condition corresponding to a maximum utilization efficiency of ORC |
Subscripts
| B | Normal boiling point (at 1 atm) |
| c | Critical point of working fluid |
| cf | Cooling fluid |
| cond | Condensing |
| e | Electric power |
| hs | Heat source fluid |
| in | Input or inlet |
| net | Accounting for the parasitic power consumption |
| out | Outlet |
| P | Pressure |
| r | Reduced, i.e., divided by the respective value at the critical point |
| th | Thermal |
| tri | Triangular cycle |
| u | Utilization |
| wf | Working fluid |
| 0 | Dead state |
Acknowledgements
The authors are grateful to the Cornell Energy Institute and the Atkinson Center for a Sustainable Future for partial financial support of this research. They would like to express their gratitude to Dr Jakub Kupecki and Dr Koenraad Beckers who provided useful comments on this work. They would also like to thank the anonymous reviewer for several valuable comments that resulted in a significantly improved paper.References
- U.S. DOE, Waste Heat Recovery: Technology Opportunities in the US Industry, 2008 Search PubMed.
- J. Tester, B. Anderson, A. Batchelor, D. Blackwell, R. DiPippo, E. Drake, J. Garnish, B. Livesay, M. Moore, K. Nichols, S. Petty, M. Toksoz and R. Veatch, The Future of Geothermal Energy: Impact of Enhanced Geothermal Systems (EGS) on the United States in the 21st Century, 2006 Search PubMed.
- D. Fox, D. Sutter and J. Tester, Energy Environ. Sci., 2011, 4, 3731 Search PubMed.
- Y. Dai, J. Wang and L. Gao, Energy Convers. Manage., 2009, 50, 576–582 CrossRef CAS.
- T. C. Hung, S. K. Wang, C. H. Kuo, B. S. Pei and K. F. Tsai, Energy, 2010, 35, 1403–1411 CrossRef CAS.
- B. Saleh, G. Koglbauer, M. Wendland and J. Fischer, Energy, 2007, 32, 1210–1221 CrossRef CAS.
- D. Walraven, B. Laenen and W. D’haeseleer, Energy Convers. Manage., 2013, 66, 220–233 CrossRef.
- J. Wang, J. Zhang and Z. Chen, Int. J. Thermophys., 2012, 33, 970–985 CrossRef CAS.
- J. Frutiger, J. Andreasen, W. Liu, H. Spliethoff, F. Haglind, J. Abildskov and G. Sin, Energy, 2016, 109, 987–997 CrossRef CAS.
- H. Chen, D. Y. Goswami, M. M. Rahman and E. K. Stefanakos, Energy, 2011, 36, 549–555 CrossRef CAS.
- F. Heberle and D. Brüggemann, Energies, 2015, 8, 2097–2124 CrossRef CAS.
- J. G. Andreasen, U. Larsen, T. Knudsen, L. Pierobon and F. Haglind, Energy, 2014, 73, 204–213 CrossRef CAS.
- C. Invernizzi, P. Iora and P. Silva, Appl. Therm. Eng., 2007, 27, 100–110 CrossRef.
- E. Martelli, F. Capra and S. Consonni, Energy, 2015, 90, 310–328 CrossRef.
- A. Greenhut, J. Tester, R. DiPippo, R. Field, C. Love, K. Nichols, F. Batini, B. Price, G. Gigliucci and I. Fastelli, in Proceedings World Geothermal Congress, 2010 Search PubMed.
- G. Manente, R. Field, R. DiPippo, J. W. Tester, M. Paci and N. Rossi, in ASME 2011 International Mechanical Engineering Congress and Exposition, Denver, CO, 2011, pp. 109–119 Search PubMed.
- C. Augustine, R. Field, R. DiPippo, G. Gigliucci, I. Fastelli and J. Tester, Trans.–Geotherm. Resour. Counc., 2009, 33, 604–608 Search PubMed.
- M. Lukawski, M. S. thesis, RES – The School For Renewable Energy Science, University of Iceland, 2009.
- M. Astolfi, M. C. Romano, P. Bombarda and E. Macchi, Energy, 2014, 66, 435–446 CrossRef CAS.
- D. Walraven, B. Laenen and W. D’haeseleer, Energy, 2015, 80, 104–113 CrossRef.
- D. Maraver, J. Royo, V. Lemort and S. Quoilin, Appl. Energy, 2014, 117, 11–29 CrossRef CAS.
- J. Tester and S. Milora, Geothermal Energy as a Source of Electric Power, Cambridge, MA, 1977 Search PubMed.
- M. Lampe, M. Stavrou, H. M. Bucker, J. Gross and A. Bardow, Ind. Eng. Chem. Res., 2014, 53, 8821–8830 CrossRef CAS.
- M. Z. Stijepovic, P. Linke, A. I. Papadopoulos and A. S. Grujic, Appl. Therm. Eng., 2012, 36, 406–413 CrossRef CAS.
- H. Chen, D. Y. Goswami and E. K. Stefanakos, Renewable Sustainable Energy Rev., 2010, 14, 3059–3067 CrossRef CAS.
- O. Palma-Flores, A. Flores-Tlacuahuac and G. Canseco-Melchor, Energy, 2016, 99, 32–47 CrossRef CAS.
- A. I. Papadopoulos, M. Stijepovic and P. Linke, Appl. Therm. Eng., 2010, 30, 760–769 CrossRef CAS.
- K. Joback and R. Reid, Chem. Eng. Commun., 1987, 57, 233–243 CrossRef CAS.
- B. Poling, J. Prausnitz and J. O'Connell, The Properties of Gases and Liquids, McGraw-Hill, 5th edn, 2000 Search PubMed.
- L. Constantinou and R. Gani, AIChE J., 1994, 40, 1697–1710 CrossRef CAS.
- A. Bejan, G. Tsatsaronis and M. Moran, Thermal Design and Optimization, John Wiley & Sons, New York, 1996 Search PubMed.
- R. DiPippo, Geothermal Power Plants: Principles, Applications, Case Studies and Environmental Impact, Butterworth-Heinemann, 3rd edn, 2012 Search PubMed.
- R. DiPippo, Geothermics, 2004, 33, 565–586 CrossRef CAS.
- R. DiPippo, Geothermics, 2007, 36, 276–285 CrossRef.
- E. W. Lemmon, M. Huber and M. McLinden, NIST Standard Reference Database 23: Reference Fluid Thermodynamic and Transport Properties-REFPROP, Version 9.1, 2013 Search PubMed.
- A. Leyzerovich, Wet steam turbines for nuclear power plants, PennWell Corp., Tulsa, OK, 2005 Search PubMed.
- J. C. Hensley, Cooling Tower Fundamentals, Overland Park, KS, USA, 2009 Search PubMed.
- ASHRAE, ASHRAE GreenGuide – The Design, Construction, and Operation of Sustainable Buildings, 2010 Search PubMed.
- R. C. Monroe, Fans Key to Optimum Cooling-Tower Design, Houston, TX, 1974 Search PubMed.
- Aspen Technology, Aspen HYSYS v. 7.3 Unit Operations Guide, 2011 Search PubMed.
- M. J. Box, Comput. J, 1965, 8, 42–52 CrossRef.
- W. Press, S. Teukolsky, W. Vetterling and B. Flannery, Numerical Recipes in C: The Art of Scientific Computing, Cambridge University Press, 1988, vol. 29 Search PubMed.
- J. L. Kuester and J. H. Mize, Optimization Techniques with Fortran, McGraw-Hill, NY, USA, 1st edn, 1973 Search PubMed.
- European Commision, EU legislation to Control F-gases, http://ec.europa.eu/clima/policies/f-gas/legislation/index_en.htm, accessed August 2016, 2016.
- Ingersoll Rand, Climate Change Regulation and the Next Generation of Refrigerants, http://www.trane.com/commercial/uploads/pdf/cso/138/Refrigerants.pdf, accessed August 2016, 2014.
- ASHRAE, ANSI/ASHRAE Standard 34-2007: Designation and Safety Classification of Refrigerants, 2008 Search PubMed.
- IPCC, in Climate Change 2007: The Physical Science Basis, Cambridge University Press, Cambridge, UK, 2007, pp. 129–234 Search PubMed.
- Linde, Refrigerants Environmental Data: Ozone Depletion and Global Warming Potential, http://www.linde-gas.com/internet.global.lindegas.global/en/images/Refrigerants environmental GWPs17_111483.pdf, accessed March 2016, 2015.
- Z. Shengjun, W. Huaixin and G. Tao, Appl. Energy, 2011, 88, 2740–2754 CrossRef.
- UNEP, Montreal Protocol on Substancs That Deplete The Ozone Layer, 2006 Search PubMed.
- J. M. Calm and G. C. Hourahan, 23rd Int. Congr. Refrig., 2011, p. 22 Search PubMed.
- J. W. Tester and M. Modell, Thermodynamics and Its Applications, Cambridge, MA, USA, 3rd edn, 1997 Search PubMed.
- M. Lukawski, R. DiPippo and J. Tester, Molecular property methods for assessing efficiency of organic Rankine cycles, manuscript in preparation, 2017 Search PubMed.
| This journal is © The Royal Society of Chemistry 2017 |

![[thin space (1/6-em)]](https://www.rsc.org/images/entities/char_2009.gif)


