Stabilization of CO2 foam using by-product fly ash and recyclable iron oxide nanoparticles to improve carbon utilization in EOR processes
Feng
Guo
a,
Jie
He
b,
Patrick A.
Johnson
 a and
Saman A.
Aryana
*a
aDepartment of Chemical Engineering, University of Wyoming, Laramie, USA. E-mail: saryana@uwyo.edu
bCollege of Chemistry and Chemical Engineering, Southwest Petroleum University, Chengdu, China
First published on 10th March 2017
Abstract
Fly ash nanoparticles (NPs), a by-product of coal combustion power plants, and recyclable iron oxide NPs are used to stabilize CO2 foam for use in enhanced oil recovery (EOR) processes as part of carbon capture, utilization and storage. The mean size of fly ash NPs is reduced to the nano-scale (40–80 nm) by a two stage grinding process. Iron oxide (IO) NPs are synthesized through Fe2+ and Fe3+ co-precipitation. The size and uniformity of the dispersion of NPs are characterized via dynamic light scattering and transmission electron microscopy. The stability and formability of NP-stabilized foam are investigated via a modified bulk foam test. The resulting improvement in oil recovery is investigated using flow experiments using a microfluidic device fabricated based on a two-dimensional representation of a Berea sandstone. The effects of the type of NP (fly ash and IO) on CO2 foam stability and the resulting incremental oil recovery are investigated and discussed. The results show that fly ash NPs with an Alpha-Olefin Sulfonate (AOS)–Lauramidopropyl betaine (LAPB) surfactant mixture provide excellent formability and stability (half-life 280 min) and resulted in over 90% recovery of the incremental oil after a waterflood in microfluidic experiments. Moreover, the material cost of fly ash NPs is significantly less than commonly used silica NPs. IO NP stabilized foam has an inferior foam stability and formability compared to fly ash stabilized foam; IO NPs can, however, be recycled using a magnetic field – the average recovery from the outflow of the microfluidic experiments was approximately 76%.
1 Introduction
Anthropogenic emissions of carbon dioxide (CO2) are a major contributing factor to global climate change.1 Currently, more than 8000 large stationary sources contribute to CO2 emissions worldwide.2 As human population and its environmental footprint expand, fossil fuels are likely to continue as a major source of energy, and as a result, the scale of global CO2 emissions is not expected to be reduced significantly in the near future.3 CO2 capture, utilization and storage (CCUS) technologies provide a potential opportunity to reduce CO2 emissions into the atmosphere and help mitigate climate change.4 According to the International Energy Agency (IEA), global emissions of CO2 must be reduced to half their 2007 levels (29 Gt CO2 per annum) to stabilize climate change by 2050.5 It is estimated that deployment of CCUS to power plants could help to achieve 10% of this reduction target.6 CCUS technologies, however, still face significant challenges due to high investment costs and the need for long-term CO2 storage.7 Novel CCUS technologies should primarily focus on minimizing the energy consumption and risks of CO2 leakage associated with long-term CO2 storage.8 The use of CO2 in enhanced oil recovery (EOR) in carefully selected reservoirs with appropriate seals will help improve the economics and long-term containment of the injectant. The use of CO2 in enhanced oil recovery (EOR) has been practiced on a large scale for over 40 years.9,10 CO2 EOR accounts for more than 5% of the total U.S. oil production.11 The relatively low viscosity and density of CO2, however, often lead to poor volumetric sweep efficiencies, severe channeling, gravity override and high mobility through high permeability layers or fractures.12 In order to overcome the drawbacks of CO2-EOR and expand its field application, CO2 foam has been proposed to take advantage of the synergistic combination of chemical- and CO2-EOR methods.13–15 The instability of CO2 foam is one of the primary reasons that it has not been widely used in EOR as foam stability is a strong indication of foam performance in EOR. Accordingly, several methods, including the use of CO2 soluble surfactants, polymers and nanoparticles (NPs), have been investigated to overcome this problem.16 Among those methods, NPs exhibit the advantage of a high stability and a relatively high adsorption energy, which lead to minimal losses of NPs in subsurface porous media during recovery processes.NPs generate stable CO2 foams capable of enduring harsh reservoir conditions, with a reduced in situ mobility compared to CO2 gas.17 Dickson et al.18 generated stable CO2-in-water foams using surface modified silica NPs. Zhang et al.19 studied the phase behavior of NP-stabilized oil/water emulsion and demonstrated the capability of silica NPs in stabilizing oil/water emulsions by modifying their surface coating. Jikich et al.20 demonstrated that NP-stabilized foam tends to flow through porous media without adsorption or trapping of nanoparticles in pore spaces. Worthen et al.21 reported generation of a stable CO2 foam with a fine texture using silica nanoparticles and a caprylamidopropyl betaine mixture. Kalyanaraman et al.22 used polyelectrolytes and polyelectrolyte complex NPs to improve CO2 foam stability in the presence of crude oil.
Fly ash, which is a waste product of coal power generation plants, is a major source of raw material and has been used in several applications such as catalysis, construction and zeolite synthesis.23–25 Recently, it was reported that fly ash NPs are able to assist foam generation as a stabilizer and control gas mobility in EOR. Singh et al.26 achieved a stable CO2 foam using fly ash NPs and found the capability of the components (carbonaceous material) of fly ash to stabilize both emulsions and foams. Thus, fly ash has the potential to displace more expensive materials (NPs), such as silica, that are used to generate a stable foam and control CO2 mobility in EOR.
Iron oxide (IO) NPs, have been used for magnetic resonance imaging (MRI) and are now being explored for EOR applications due to their relatively low cost, low toxicity, and high magnetic susceptibilities.27 IO NPs coated with amphiphilic copolymers have been used to reduce interfacial tension at the oil–water interface and generate stable emulsions.28 A simple versatile approach was introduced by Gonzenbach et al.29 to generate an ultra-stable foam using NPs. The use of this method may be extended to any type of oxide particle, including IO NPs. Moreover, IO NPs are recyclable under a magnetic field due to their magnetic properties. IO NPs with poly (vinylpyrrolidone) sulfobetaines were recycled by Park et al.30 more than three times using a magnetic field. Therefore, recyclable IO NPs have the potential to improve foam stability and assist foam flooding efficiency in EOR.
In this effort, the stability of CO2 foam, generated with industrial waste products (fly ash NPs) and recyclable IO NPs, and the resulting improvement in oil recovery were systematically investigated using modified bulk foam tests and recovery experiments using microfluidic devices.
The motivation for using fly ash is its relatively low material cost – it is a by-product of coal power plants and is often treated as waste. On the other hand, the potential benefits of the use of iron-oxide nanoparticles are twofold: (1) a significant portion of the paramagnetic NPs are recyclable using a magnetic separation scheme, and (2) the NPs that remain in the formation may help make an improved electromagnetic image of the reservoir possible.27
This work compares the stability and incremental oil recovery due to foams generated by NPs and surfactants. The relatively low cost of fly ash NPs and the ability to recover and recycle IO NPs are added potential benefits of their use. The size of fly ash NPs was reduced to the nano-scale (40–80 nm) using a high rotation mill. A magnetic field was applied to recycle IO NPs from the outflow stream in microfluidic experiments.
2 Experiments
2.1 Material
Fly ash was received as a gift from a local coal power plant in powder form. IO NPs were synthesized by co-precipitation of iron(II) chloride tetrahydrate (FeCl2·4H2O, Sigma Aldrich) and iron(III) chloride hexahydrate (FeCl3·6H2O, Sigma Aldrich) in 0.5 mol L−1 ammonium hydroxide (Sigma Aldrich). Sodium citrate (Na3C6H5O7·2H2O, Sigma Aldrich) was used to improve the dispersity of NPs. NP dispersions were diluted to desired concentrations with deionized (DI) water (Nanopure II, Barnstead, Dubuque) and mixed with a lauramidopropyl betaine (LAPB) and alpha-olefin sulfonate surfactant mixture (Table 1) under constant ultra-sonication (QSONIC Q700) for six minutes. Sodium chloride (Sigma Aldrich), CO2 (research grade, United States Welding, USA) and crude oil (Gullfaks Blend, 45.9 cp and 0.9029 g cm−3 at 20 °C) were used. All surfactants were used as received without further treatment. All stock solutions used 10![[thin space (1/6-em)]](https://www.rsc.org/images/entities/char_2009.gif) 000 ppm brine (sodium chloride) with 1000 ppm of surfactants and 1000 ppm NPs.
000 ppm brine (sodium chloride) with 1000 ppm of surfactants and 1000 ppm NPs.
| Type | Family | Name | Source |
|---|---|---|---|
| Anionic surfactant | Alpha-olefin sulfonate | AOS 14–18 (AOS) 39% active | Stepan Co |
| Zwitterionic surfactants | Betaine | Lauramidopropyl betaine (LAPB) 35% active | Rhodia Co |
2.2 Method
![[thin space (1/6-em)]](https://www.rsc.org/images/entities/char_2009.gif) :
:![[thin space (1/6-em)]](https://www.rsc.org/images/entities/char_2009.gif) 2 were dissolved in 50 mL deionized water maintained at 80 °C. A NH4OH solution (0.5 mol L−1) (Sigma Aldrich) was added to the above solution using a syringe pump under constant ultra-sonication for 30 minutes until a final pH of 10 was achieved. Subsequently, 12.65 g of sodium citrate (Sigma Aldrich) were added to the suspensions to modify the obtained Fe3O4 NPs for 30 minutes. The entire process was conducted under a N2 rich environment to prevent unwanted oxidation. The obtained substance was aged and digested at a temperature of 80 °C for 30 minutes and cooled at room temperature (20 °C). The resulting particles were magnetically separated and washed repeatedly with deionized water until a pH of 7 was achieved. The products were then dried at 25 °C in a glovebox for 24 hours for further characterization.
2 were dissolved in 50 mL deionized water maintained at 80 °C. A NH4OH solution (0.5 mol L−1) (Sigma Aldrich) was added to the above solution using a syringe pump under constant ultra-sonication for 30 minutes until a final pH of 10 was achieved. Subsequently, 12.65 g of sodium citrate (Sigma Aldrich) were added to the suspensions to modify the obtained Fe3O4 NPs for 30 minutes. The entire process was conducted under a N2 rich environment to prevent unwanted oxidation. The obtained substance was aged and digested at a temperature of 80 °C for 30 minutes and cooled at room temperature (20 °C). The resulting particles were magnetically separated and washed repeatedly with deionized water until a pH of 7 was achieved. The products were then dried at 25 °C in a glovebox for 24 hours for further characterization.
![[thin space (1/6-em)]](https://www.rsc.org/images/entities/char_2009.gif) :
:![[thin space (1/6-em)]](https://www.rsc.org/images/entities/char_2009.gif) 1 hydrochloric acid (HCl). Afterwards, the sample was heated using a hot plate at 70 °C until the volume was reduced to 15–20 mL. Finally, 5.0 N sodium hydroxide standard solution was used to adjust the digested sample to a pH of 4. The total Fe3+ concentration was measured by using a HACH DR/4000U spectrophotometer. The total amount of IO NPs recovered was calculated from the Fe3+ concentration.
1 hydrochloric acid (HCl). Afterwards, the sample was heated using a hot plate at 70 °C until the volume was reduced to 15–20 mL. Finally, 5.0 N sodium hydroxide standard solution was used to adjust the digested sample to a pH of 4. The total Fe3+ concentration was measured by using a HACH DR/4000U spectrophotometer. The total amount of IO NPs recovered was calculated from the Fe3+ concentration.
2.3 Experimental setup and procedure
3 Results and discussion
3.1 Nanoparticles' morphology and size distribution
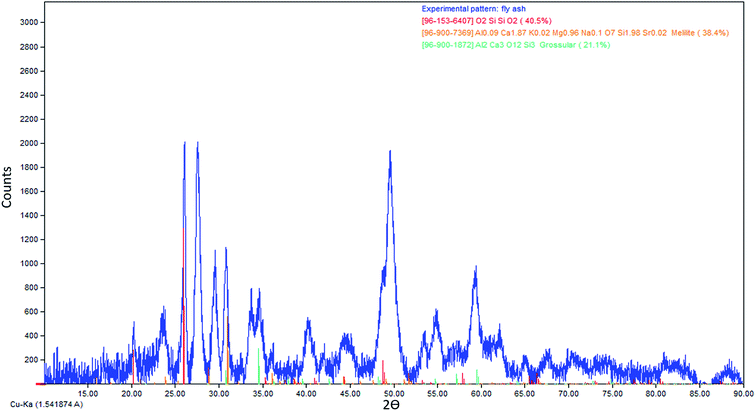
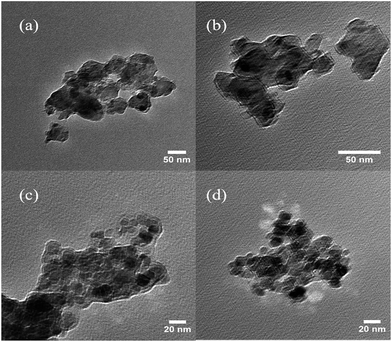
To confirm the composition of IO NPs, XRD spectra were taken and compared with those of Fe3O4 crystalline powder standards. All the major peaks correlated with the dominant diffraction peaks of Fe3O4 (at 30.0°, 35.5°, 43.1°, 57.0°, and 62.6°, data not shown) with no evidence of other structures being present, which indicates particles consistent with the cubic spinel type structure of magnetite.33 Magnetometry results indicate the IO NPs have a magnetization of 72.5 emu g−1, which is comparable to that of previously synthesized IO NPs used for other recyclability studies at 72.8 emu g−1.30The morphologies of both fly ash and IO NPs were obtained using TEM as shown in Fig. 4. The results indicate that the average particle size of fly ash NPs was reduced to approximately 50 nm after a two stage grinding process (Fig. 4(a) and (b)). It became more difficult to grind particles as particle sizes approached the nano-size range. Towards the end of the grinding process, the particle sizes did not seem to change after 90 min of continuous grinding. The average size of the synthesized IO NPs was less than 20 nm, which suggests that IO NPs have a strong paramagnetism. It is reported that IO NPs smaller than 20 nm often display superparamagnetic behavior at room temperature,34 which means that an external magnetic field is able to magnetize the IO nanoparticles. Therefore, synthesized IO NPs were able to be recovered using a magnetic field.
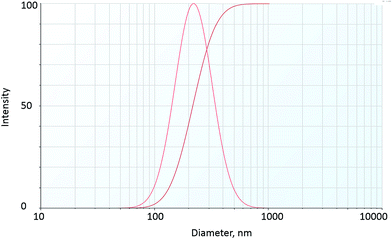
The particle size distribution, hydrodynamic diameter and zeta potential of fly ash NPs at room temperature are shown in Table 2 and Fig. 5. The results show the mean particle hydrodynamic diameter of fly ash–LAPB–AOS dispersion and IO–LAPB–AOS dispersion to be 232 nm and 192 nm, respectively. The particle size distribution indicated a high degree of homogeneity based on the polydispersity index. Thus, LAPB–AOS exhibits compatibility with fly ash and IO NPs; that is, the results suggest that both fly ash and IO NPs may be used in conjunction with AOS + LAPB. In addition, the results show that the zeta potential values of fly ash and iron-oxide NPs are between −60 mV and −40 mV, which indicates good dispersion stability.35,36
| NPs | Individual particle diameter (TEM) ± St. dev. (nm) | Particle hydrodynamic diameter ± St. dev. (nm) in DI water (24 h) | Polydispersity index | Zeta potential (mV) |
|---|---|---|---|---|
| Fly ash | 40 ± 10 | 232 ± 2.1 | 0.151 | −53.64 |
| Iron oxide | 15 ± 6 | 192 ± 27 | 0.136 | −48.01 |
3.2 Foam stability and formability
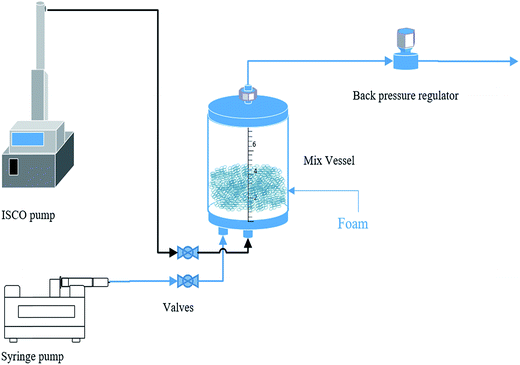
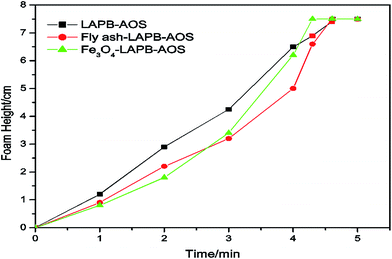
Initially, the liquid level of excess NP solution was maintained at the zero mark inside the mixing cylinder. Thus, the foam height was directly read from the graduated cylinder. The CO2 flow rate was controlled at 100 mL min−1, the pressure was maintained at 20 psi, and the experiments were conducted at room temperature (20 °C). The equilibrium foam height was recorded at one-minute intervals for five minutes. Since the flow rate of CO2 was kept constant, the time it took to reach the maximum height (7.5 cm) had an inverse relationship with the foam formability. For the fly ash–LAPB–AOS mixture, it took 4.5 minutes for the generated foam to reach the 7.5 cm line, and the IO NPs with the LAPB–AOS mixture exhibited similar results taking approximately 4.3 minutes (Fig. 6). Therefore, both NPs with LAPB–AOS were capable in assisting foam generation, indicating that both samples had a relatively high foam formability. Afterwards, the cylinder was vigorously shaken until a large amount of fine foam was formed. The foam then coalesced over time and the time it took for the foam height to drop to half its initial height was recorded as the foam half-life, indicating the foam's absolute stability (Table 3). The results indicate that NPs have the ability to provide a strong foam with an excellent foam formability and stability. The mixture of surfactant and NPs generates a relatively more stable foam compared with samples without NPs. The use of fly ash–LAPB–AOS mixture produced foam with a half-life of 238 min, and the foam resulting from the use of the IO–LAPB–AOS mixture had a lower half-life of 118 min. The use of the LAPB–AOS mixture without NPs resulted in a foam with the lowest stability and a half-life of approximately 83 min. In the presence of NPs, the LAPB–AOS surfactant mixture appears to result in a higher foam stability compared with foams stabilized by either AOS or LAPB alone.37 The stability difference between the two NP assisted foams might be a result of variance in partial particle flocculation, contact angle and network rearrangements at the interface, which is observable through interfacial rheology changes.38 Often in foam systems, the contact angles between water, CO2 and NPs are below 90° (usually 60–70°) for maximum stability.39 The LAPB–AOS mixture is absorbed on the fly ash surface and changes the particle contact angle at the interface, which may result in a contact angle that leads to the maximum foam stability. The arrangement of particles has a strong effect on maximum capillary pressure and is a major factor responsible for foam stability.40–42 In accordance with potential mechanisms responsible for stabilization of foam using NPs, introduced by Denkov et al.,43 since the fly ash–LAPB–AOS mixture exhibited high foam stability, it is likely that the use of the fly ash–LAPB–AOS mixture resulted in a NP network at the gas–water interface with a relatively high maximum capillary pressure.40,44,45 Synergism between NPs and surfactants helps to generate and stabilize foam. Both fly ash and IO NPs are negatively charged, and surfactants that coat NP surfaces act as surface-active agents to make the surfaces of the NPs amphiphilic.41 The surfactant concentration is below CMC (approximately 20![[thin space (1/6-em)]](https://www.rsc.org/images/entities/char_2009.gif) 000 ppm), which results in a stable foam.42
000 ppm), which results in a stable foam.42
| Nanoparticles | Concentration ppm | Surfactant | Concentration ppm | Pressure psi | CO2 flow rate mL min−1 | Stability min |
|---|---|---|---|---|---|---|
| None | n/a | AOS + LAPB | 1000 | 20 | 100 | 83 |
| Iron oxide | 1000 | AOS + LAPB | 1000 | 20 | 100 | 118 |
| Fly ash | 1000 | AOS + LAPB | 1000 | 20 | 100 | 238 |
3.3 Oil recovery in microfluidic devices
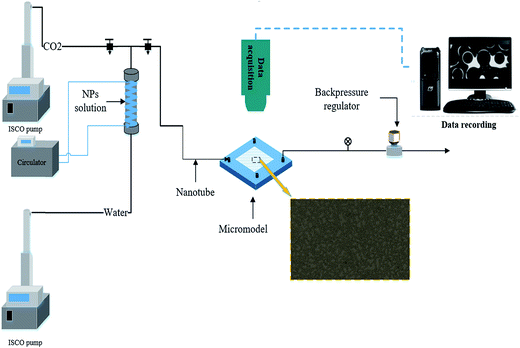
Microfluidic devices have the potential to provide a deeper understanding of foam flooding in EOR processes, i.e. foam propagation, foam stability and oil mobilization.46 CO2 foams with increased formability and stability tend to result in a higher oil recovery during the foam flooding process.12,21,42,47 The NP–LAPB–AOS surfactant mixtures exhibited both high foam stability and formability and provided a relatively high oil recovery in our previous work.37 In this effort, fly ash and recyclable IO NPs were used in conjunction with an LAPB–AOS mixture to produce foam and foam flooding experiments were conducted to evaluate the performance of NP additives on foam stability and oil recovery inside a microfluidic device. Each experiment was repeated three times. The foam injection rate was 4 μL min−1 and the system pressure was set at 20 psi during the course of each experiment. Initially, the microfluidic device was saturated with 30![[thin space (1/6-em)]](https://www.rsc.org/images/entities/char_2009.gif) 000 ppm brine followed by the injection of 40 pore volumes (PV) of crude oil.
000 ppm brine followed by the injection of 40 pore volumes (PV) of crude oil.
Before foam flooding, water flooding (using 30![[thin space (1/6-em)]](https://www.rsc.org/images/entities/char_2009.gif) 000 ppm brine solution) was conducted at a rate of 4 μL min−1 for 8 PV with the system pressure set at 20 psi until the maximum water flooding oil recovery was obtained, which was approximately 40% (Fig. 7(a) and 8(a)). Based on observations from recovery experiments, it is assumed that the maximum oil recovery is achieved once foam breakthrough occurs. For the fly ash–LAPB–AOS, images were taken every 1 minute during the CO2 foam flooding phase. Images taken at 0 and 180 min are shown in Fig. 7. As the injectant entered the microfluidic device, foam started to form and accumulate, and once the foam contacted the oil phase, it tended to collapse. During injection, the foam generation rate was higher than its rupture rate due to the high stability and elasticity of the fly ash–LAPB–AOS foam. The foam phase remained as a continuous phase and accumulated until the injection pressure reached a critical pressure, at which point a continuous foam phase occupied the porous medium and flushed out the oil phase (Fig. 7). After 180 min, most of the resident oil was displaced by the foam phase (Fig. 7(b)). Likewise, for IO–LAP–AOS, images were taken to monitor changes in the foam and oil phases inside the microfluidic device (Fig. 8). IO–LAPB–AOS foam exhibited an inferior stability, and the foam decayed rapidly upon contact with the oil phase, at which point the NP-surfactant mixture released. Initially, the NP-surfactant mixture displaced the oil phase in several small regions, where foam later formed and accumulated. After 50 minutes of injection, foam breakthrough and maximum oil recovery were reached (Fig. 8(b)).
000 ppm brine solution) was conducted at a rate of 4 μL min−1 for 8 PV with the system pressure set at 20 psi until the maximum water flooding oil recovery was obtained, which was approximately 40% (Fig. 7(a) and 8(a)). Based on observations from recovery experiments, it is assumed that the maximum oil recovery is achieved once foam breakthrough occurs. For the fly ash–LAPB–AOS, images were taken every 1 minute during the CO2 foam flooding phase. Images taken at 0 and 180 min are shown in Fig. 7. As the injectant entered the microfluidic device, foam started to form and accumulate, and once the foam contacted the oil phase, it tended to collapse. During injection, the foam generation rate was higher than its rupture rate due to the high stability and elasticity of the fly ash–LAPB–AOS foam. The foam phase remained as a continuous phase and accumulated until the injection pressure reached a critical pressure, at which point a continuous foam phase occupied the porous medium and flushed out the oil phase (Fig. 7). After 180 min, most of the resident oil was displaced by the foam phase (Fig. 7(b)). Likewise, for IO–LAP–AOS, images were taken to monitor changes in the foam and oil phases inside the microfluidic device (Fig. 8). IO–LAPB–AOS foam exhibited an inferior stability, and the foam decayed rapidly upon contact with the oil phase, at which point the NP-surfactant mixture released. Initially, the NP-surfactant mixture displaced the oil phase in several small regions, where foam later formed and accumulated. After 50 minutes of injection, foam breakthrough and maximum oil recovery were reached (Fig. 8(b)).
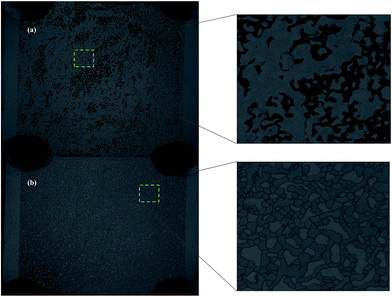 | ||
| Fig. 7 Oil recovery images in a microfluidic chip of fly ash–LAPB–AOS: (a) initial oil saturation after water flooding and (b) after 180 min of foam flooding. | ||
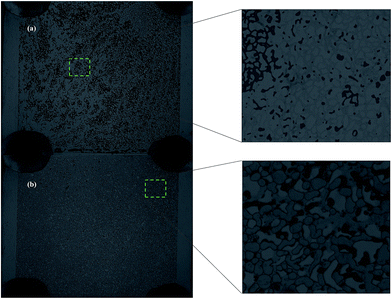 | ||
| Fig. 8 Oil recovery images in a microfluidic chip of IO–LAPB–AOS: (a) initial oil saturation after water flooding and (b) after 50 min of foam flooding. | ||
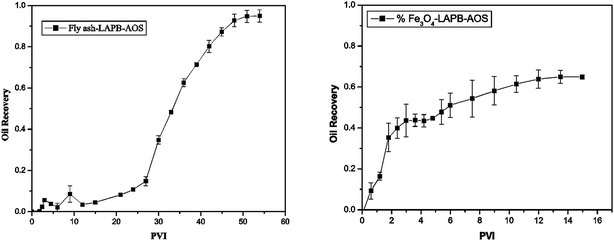
The oil recovery as a function of pore volume-injected (PVI) is shown in Fig. 9. The foam generated using the fly ash–LAPB–AOS mixture recovered approximately 90% of the oil that was remaining at the conclusion of a waterflood. This recovery was achieved after injection of 54 pore volumes (PV) (Fig. 9(a)). The foam generated using the IO–LAPB–AOS mixture was able to recover only approximately 65% of the oil that remained at the conclusion of the waterflood. This recovery was achieved after the injection of 15 PV, which was mainly due to the inferior stability of the IO–LAPB–AOS foam compared to that of the fly ash–LAPB–AOS foam (Fig. 9(b)).
The results demonstrated that foam with a higher stability (fly ash–LAPB–AOS) may lead to a higher maximum oil recovery from porous media. The maximum oil recovery resulting from the use of the fly ash-LAPB–AOS mixture was, however, obtained at a larger cumulative PVI compared with the less stable foams. While both fly ash and IO NPs with LAPB–AOS mixtures were able to assist foam generation and improved oil recovery inside the porous medium, due to difference in their stabilities, the fly ash–LAPB–AOS foam provided approximately 30% higher cumulative oil recovery compared with the IO–LAPB–AOS foam.
3.4 Recycling iron oxide NPs
IO NPs were recovered from the outlet stream of the microfluidic device using a magnet. The outflow stream (mixture of NPs, water and oil) was collected in a beaker from the foam flooding experiment. The container was placed on the magnet for 2 hours to allow IO NPs to settle down. The supernatant was decanted away and the precipitant was washed with DI water. Considering the small volume of fluid injected (NPs), the recycled IO NPs cannot be quantified by direct weighing of the material. Thus, recycled IO NPs were converted to Fe3+ using a USEPA mild digestion process and a spectrophotometer was used to measure the Fe3+ concentration. The total mass of the recovered IO NPs was calculated from the measured Fe3+ concentration and was compared to the mass of the injected IO NPs to evaluate the recycling efficiency. Three experiments were conducted with different injection rates and pore volumes injected (Table 4). The results show that approximately an average of 76% of the IO NPs were recovered and recycled using a magnetic field generated by the magnet. Due to the rather small injection volumes (approximately 200 μL), in the microfluidic experiments, a small loss of material during collection and measurement steps would have a significant impact on the final results. Therefore, it is possible that, in practice, the recovery efficiency of IO NPs would exceed the recoveries measured in the experiments. The recycled NPs may be put through a sonication procedure and reinjected with the surfactant mixture as part of a continuous foam flooding process. Such a recycling operation has the potential to reduce the material cost associated with the flood.| Exp. # | Fe3+ concentration (mg L−1) | Fe3O4 mass (mg) | Injected Fe3O4 mass (mg) | Recovery% |
|---|---|---|---|---|
| 1 | 0.09 | 0.12 | 0.15 | 79 |
| 2 | 0.16 | 0.22 | 0.31 | 71 |
| 3 | 0.06 | 0.15 | 0.21 | 75 |
| Average recovery | 76 ± 2.3 |
4 Conclusion
Stable CO2 foam was successfully generated using two different NPs (fly ash and IO) and a surfactant mixture (LAPB–AOS). Foam formability and stability were evaluated using bulk foam tests. Fly ash, which is a byproduct of coal power plants, with a LAPB–AOS mixture generated a CO2 foam with high formability and a stability of approximately 230 minutes–120 minutes longer than the stability of the CO2 foam generated using the IO–LAPB–AOS mixture. Microfluidic experiments demonstrated incremental oil recovery resulting from the use of NP-stabilized CO2 foam compared with water flooding; fly ash–LAPB–AOS foam recovered over 90% percent of the oil that was remaining at the conclusion of a waterflood in microfluidic experiments. This recovery was approximately 30% higher than the recovery obtained from the use of a CO2 foam generated via an IO–LAPB–AOS mixture. The use of fly ash, a major industrial waste product, in EOR has the potential to improve the economics of CO2 storage and also serves as an underground waste disposal. Even though, IO NPs are not as effective as fly ash in generating stable foams, they may be recycled using a magnetic field. An average recycling efficiency of 76% was achieved in the experiments. A higher positive value of maximum capillary pressure ensures that a thin liquid film between the foam can withstand a higher pressing force.45 The NPs (fly ash and iron oxide) and surfactant mixtures (LAPB–AOS) act synergistically to produce foams with improved stability that delays coalescence compared with foams stabilized by either NPs or surfactants alone. The mixture of LAPB–AOS surfactants helps NP adsorption at the CO2–water interface, so the NPs provide a greater steric barrier to coalescence and result in a higher maximum capillary pressure.Acknowledgements
SAA gratefully acknowledges the Donors of the American Chemical Society Petroleum Research Fund (55795-DNI9), for partial support of this research. The base image of the sandstone was created by Dr Cynthia Ross for Professor Roland Horne, who graciously shared it with the corresponding author.Reference
- R. S. Middleton, G. N. Keating, P. H. Stauffer, A. B. Jordan, H. S. Viswanathan, Q. J. Kang, J. W. Carey, M. L. Mulkey, E. J. Sullivan, S. P. Chu, R. Esposito and T. A. Meckel, Energy Environ. Sci., 2012, 5, 7328–7676 CAS
.
- P. Friedlingstein, R. M. Andrew, J. Rogelj, G. P. Peters, J. G. Canadell, R. Knutti, G. Luderer, M. R. Raupach, M. Schaeffer, D. P. van Vuuren and C. Le Quere, Nat. Geosci., 2014, 7, 709–715 CrossRef CAS
.
- N. MacDowell, N. Florin, A. Buchard, J. Hallett, A. Galindo, G. Jackson, C. S. Adjiman, C. K. Williams, N. Shah and P. Fennell, Energy Environ. Sci., 2010, 3, 1645–1669 CAS
.
- M. E. Boot-Handford, J. C. Abanades, E. J. Anthony, M. J. Blunt, S. Brandani, N. Mac Dowell, J. R. Fernández, M.-C. Ferrari, R. Gross, J. P. Hallett, R. S. Haszeldine, P. Heptonstall, A. Lyngfelt, Z. Makuch, E. Mangano, R. T. J. Porter, M. Pourkashanian, G. T. Rochelle, N. Shah, J. G. Yao and P. S. Fennell, Energy Environ. Sci., 2014, 7, 130–189 CAS
.
- IEA, OECD/IEA, Paris, France, 2010.
- M. Zhao, A. I. Minett and A. T. Harris, Energy Environ. Sci., 2013, 6, 25–40 CAS
.
- T. A. Buscheck, J. A. White, S. A. Carroll, J. M. Bielicki and R. D. Aines, Energy Environ. Sci., 2016, 9, 1504–1512 CAS
.
- I. Dimitriou, P. García-Gutiérrez, R. H. Elder, R. M. Cuéllar-Franca, A. Azapagic and R. W. K. Allen, Energy Environ. Sci., 2015, 8, 1775–1789 CAS
.
- A. J. Worthen, H. G. Bagaria, Y. Chen, S. L. Bryant, C. Huh and K. P. Johnston, J. Colloid Interface Sci., 2013, 391, 142–151 CrossRef CAS PubMed
.
-
S. Aryana, C. Barclay and S. Liu, SPE-170653-MS, Amsterdam, The Netherlands, 2014, pp. 27–29 Search PubMed
.
- M. Sagir, I. M. Tan, M. Mushtaq, M. Pervaiz, M. S. Tahir and K. Shahzad, J. Pet. Explor. Prod. Technol., 2016, 6, 401–407 CrossRef CAS
.
- I. Kim, A. J. Worthen, K. P. Johnston, D. A. DiCarlo and C. Huh, J. Nanopart. Res., 2016, 18(4), 82 CrossRef
.
-
Q. P. Nguyen, A. V. Alexandrov, P. L. Zitha and P. K. Currie, SPE 58799, Lafayette, Louisiana, 2000, pp. 23–24 Search PubMed
.
-
S. Liu, R. F. Li, C. A. Miller and G. J. Hirasaki, Paper SPE-113936, Tulsa, USA, 2010, pp. 20–23 Search PubMed
.
- H. Guo, P. L. J. Zitha, R. Faber and M. Buijse, SPE J., 2012, 17, 1186–1195 CrossRef CAS
.
-
A. S. Emrani and H. A. Nasr-El-Din, Presented in Part at the Paper SPE 174254 MS, 2015 Search PubMed
.
- A. J. Worthen, S. L. Bryant, C. Huh and K. P. Johnston, AIChE J., 2013, 59, 3490–3501 CrossRef CAS
.
- J. L. Dickson, B. P. Binks and K. P. Johnston, Langmuir, 2004, 20, 7976–7983 CrossRef CAS PubMed
.
-
T. Zhang, D. Espinosa, K. Y. Yoon, A. R. Rahmani, H. Yu, F. M. Caldelas, S. Ryoo, M. Roberts, M. Prodanovic, K. P. Johnston, T. E. Milner, S. L. Bryant and C. Huh, Offshore Technology Conference, Houston, Texas, USA, 2011 Search PubMed
.
- S. J. Jikich, J. Pet. Technol., 2012, 64, 28–31 CrossRef CAS
.
- A. J. Worthen, P. S. Parikh, Y. Chen, S. L. Bryant, C. Huh and K. P. Johnston, Energy Procedia, 2014, 63, 7929–7938 CrossRef CAS
.
- N. Kalyanaraman, C. Arnold, A. Gupta, J. S. Tsau and R. B. Ghahfarokhi, J. Appl. Polym. Sci., 2017, 134(6), 44491 CrossRef
.
- D. Jain, C. Khatri and A. Rani, Fuel Process. Technol., 2010, 91, 1015–1021 CrossRef CAS
.
- N. Shigemoto, H. Hayashi and K. Miyaura, J. Mater. Sci., 1993, 28, 4781–4786 CrossRef CAS
.
- A. González, R. Navia and N. Moreno, Waste Manage. Res., 2009, 27, 976–987 CrossRef PubMed
.
-
R. Singh, A. Gupta, K. K. Mohanty, C. Huh, D. Lee and H. Cho, Presented in Part at the Paper SPE-175057-MS, Huston, Texas, USA, 2015 Search PubMed
.
- C. Fu and N. M. Ravindra, Bioinspired, Biomimetic Nanobiomater., 2012, 1, 229–244 CrossRef CAS
.
- K. Y. Yoon, Z. Li, B. M. Neilson, W. Lee, C. Huh, S. L. Bryant, C. W. Bielawski and K. P. Johnston, Macromolecules, 2012, 45, 5157–5166 CrossRef CAS
.
- U. T. Gonzenbach, A. R. Studart, E. Tervoort and L. J. Gauckler, Angew. Chem., 2006, 45, 3526–3530 CrossRef CAS PubMed
.
- H. J. Park, J. T. McConnell, S. Boddohi, M. J. Kipper and P. A. Johnson, Colloids Surf., B, 2011, 83, 198–203 CrossRef CAS PubMed
.
-
M. Alaskar, In Situ Multifunctional Nanosensors for Fractured Reservoir Characterization, PhD thesis, Stanford University, 2013
.
- M. Alaskar, K. Li and R. Horne, presented in part at the Thirty-Eighth Workshop on Geothermal Reservoir Engineering, Stanford, 2013 Search PubMed.
- B. A. Wechsler, D. H. Lindsley and C. T. Prewitt, Am. Mineral., 1984, 69, 754–770 CAS
.
- Y. Lu, Y. Yin, B. T. Mayers and Y. Xia, Nano Lett., 2002, 183–186 CrossRef
.
- R. Greenwood and K. Kendall, J. Eur. Ceram. Soc., 1999, 19, 479–488 CrossRef CAS
.
- R. Greenwood, Adv. Colloid Interface Sci., 2003, 106, 55–81 CrossRef CAS PubMed
.
- F. Guo and S. Aryana, Fuel, 2016, 186, 430–442 CrossRef CAS
.
- T. N. Hunter, R. J. Pugh, G. V. Franks and G. J. Jameson, Adv. Colloid Interface Sci., 2008, 137, 57–81 CrossRef CAS PubMed
.
-
D. J. Shaw, Introduction to Colloid & Surface Chemistry, Butterworth-Heinemann, 4th edn, 1992 Search PubMed
.
- G. Kaptay, Colloids Surf., A, 2004, 230, 67–80 CrossRef
.
- R. Singh and K. K. Mohanty, Energy Fuels, 2015, 29, 467–479 CAS
.
- A. J. Worthen, L. M. Foster, J. Dong, J. A. Bollinger, A. H. Peterman, L. E. Pastora, S. L. Bryant, T. M. Truskett, C. W. Bielawski and K. P. Johnston, Langmuir, 2014, 30, 984–994 CrossRef CAS PubMed
.
- N. D. Denkov, I. B. Ivanov, P. A. Kralchevsky and D. T. Wasan, J. Colloid Interface Sci., 1992, 150, 589–593 CrossRef CAS
.
-
G. S. Penny, Y. Bian and J. T. Pursley, US Pat., 13/863,205, 2013
.
- G. Kaptay, Colloids Surf., A, 2006, 282–283, 387–401 CrossRef
.
- V. A. Lifton, Lab Chip, 2016, 16, 1777–1796 RSC
.
- S. S. Adkins, D. Gohil, J. L. Dickson, S. E. Webber and K. P. Johnston, Phys. Chem. Chem. Phys., 2007, 9, 6333–6343 RSC
.
| This journal is © The Royal Society of Chemistry 2017 |

