Facile synthesis of water soluble reduced graphene oxide with a high concentration and its application in printable micro-supercapacitors†
Haibo
Su
ab,
Pengli
Zhu
 *a,
Leicong
Zhang
a,
Fengrui
Zhou
a,
Xianwen
liang
a,
Tingxi
Li
*b,
Qing
Wang
b,
Rong
Sun
*a and
Chingping
Wong
cd
aShenzhen Institutes of Advanced Technology, Chinese Academy of Sciences, Shenzhen 518055, P. R. China. E-mail: pl.zhu@siat.ac.cn
bSchool of Materials Science and Engineering, Shandong University of Science and Technology, Qingdao 266590, P. R. China
cSchool of Materials Science and Engineering, Georgia Institute of Technology, Atlanta, USA
dDepartment of Electronics Engineering, The Chinese University of Hong Kong, Hong Kong
First published on 18th July 2017
Abstract
Direct printing techniques have generated significant research interest in fabricating flexible and scalable micro-supercapacitors (MSCs). In this study, we report a facile and cost-effective way to synthesize water soluble reduced graphene oxide (WSG) with a high concentration by decoration with aminobenzenesulfonic acid (ABS) and reduction with ascorbic acid. The WSG possesses excellent electrical conductivity (360 S m−1), good water dispersion stability as well as a high zeta potential value (−62 mV at pH 11), and the concentration of the as-prepared WSG could reach 5 mg mL−1, nearly as great as the highest value from previous reports. Then, using this high-concentration WSG dispersion directly as an electrochemically active ink material, micro-supercapacitor electrodes could be facilely fabricated via a direct printing technique on common printing paper, and the all-solid-state flexible MSCs could be further assembled. The results show that these flexible MSCs exhibit high area and volume specific capacitances of 2.67 mF cm−2 and 6.75 F cm−3, maintaining 94.8% of their initial specific capacitance after 5000 cycles at a scan rate of 50 mV s−1. More importantly, the capacitance and potential can be expanded by connecting a WSG-MSC device in parallel and in series, and the assembled devices are further demonstrated to be capable of lighting a liquid crystal display with three WSG-MSCs in series. These findings not only provide a simple way to synthesize WSG with a high concentration, but also facilitate its applications in printable and flexible MSCs with high performance.
1. Introduction
Supercapacitors (SCs) have shown great potential in a wide range of applications, especially in wearable and portable electronic products.1–3 Specifically, with the rapid development of integrated and miniaturized micro-electronic devices, such as biomedical implants and micro-sensors, there is a growing need for developing novel micro-scale power sources.4–7 Thus, further research on micro-supercapacitors (MSCs) with high performance has become an important direction in exploring next-generation energy storage devices and meeting the ever-increasing requirements.In the last several years, a large amount of effort has been devoted to exploring facile and highly efficient ways to fabricate flexible, small, and ultra-thin solid-state MSCs.8–10 At present, without considering the active materials, the methods to successfully fabricate MSCs mainly concentrate on the following aspects: (a) electrochemical techniques and photolithography, also named optical or ultraviolet lithography, which is a process used in micro-fabrication to pattern parts of a thin film or other substrate. For example, Niu et al. developed ultra-thin and all-solid-state MSCs through a photolithography technique to form the desired interdigitated structures on a flexible substrate, and then conductive rGO interdigitated microelectrodes were achieved via an electrophoretic deposition and reduction process.11 (b) Laser writing methods, similar to the standard photolithography techniques, in which micro-structuring is accomplished by illuminating a negative-tone or positive-tone polymer substrate with light of a well-defined wavelength. For instance, El-Kady et al. developed a scalable and highly efficient way to fabricate graphene-based in-plane MSCs via direct laser writing on graphene oxide papers using a Light-Scribe DVD burner, and the micro-electrodes could be precisely patterned with a high resolution of ∼20 μm (ref. 12). (c) Direct printing techniques, including screen-printing, inkjet printing and spray deposition methods. Ujjain et al. reported a simple and scalable way to prepare completely printed supercapacitors based on functionalized multiwalled carbon nanotubes (f-MWCNTs), which exhibit high power and energy performance and great cycle stability,13 and Liu et al. designed ultra-flexible MSCs on printing paper with electrochemically exfoliated graphene ink (0.8 mg mL−1) by a direct printing method.14 Although micro-electrodes with high resolution can be obtained by the conventional fabrication techniques of photolithography and laser writing, the complicated processes and high cost of the as-fabricated devices have limited their practical applications. Direct printing techniques are inexpensive methods to manufacture MSCs and are therefore the most likely to be used on an industrial scale. Besides, as a key point for printing techniques, the ink should be inexpensive, easily prepared and highly stable. Thus, exploring the ideal electrochemically active materials for ink formulation is still challenging work.
Graphene-based materials have been regarded as one of the most ideal promising candidates for batteries and SCs due to the large specific surface area (∼2630 m2 g−1) and high mechanical strength, as well as high electrical conductivity (∼106 S m−1).15,16 Moreover, various methodologies, including epitaxial growth, liquid-phase exfoliation, chemical vapor deposition and reduced graphene oxide, have offered very mature processes to prepare high quality graphene sheets in a facile and inexpensive way. However, the poor wettability and high restacking tendency between graphene nanosheets because of the strong π–π interactions have greatly limited their application in the large-scale production of graphene with good water dispersibility.17 In a recent work by Mukherjee and co-workers, exploring the reliance on the phenyl radicals and subsequent sulfonation of the phenyl groups, the obtained graphene exhibited good water solubility and its concentration could reach about 2.1 mg mL−1.18 With the help of cellulose nanocrystals (CNCs), Ye and co-workers obtained aqueous dispersions of graphene/cellulose nanocrystals at a high concentration (>10 mg mL−1). The introduced CNCs act as a stabilizer, which could effectively prevent graphene nanosheet aggregation and decrease the physical and mechanical performances of graphene.19 The above results provide several ways to improve the water dispersibility of graphene. However, the concentration is still very low or other impurities can be introduced, which could interfere with the other properties of graphene in the meantime. So, it is still a big challenge to develop a facile and inexpensive method to obtain an aqueous dispersion of graphene with a high concentration for further applications.
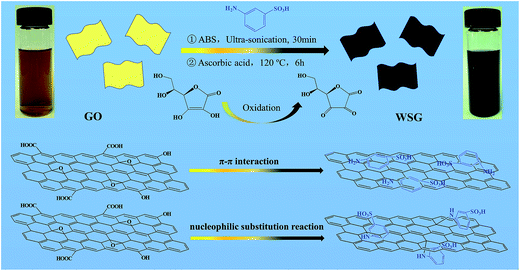
In this work, stable water soluble reduced graphene oxide (WSG) dispersions with high concentrations up to 5 mg mL−1 were successfully prepared by introducing aminobenzenesulfonic acid and using ascorbic acid as a reducing agent. Moreover, the surface of WSG is negatively charged, with a zeta potential over −60 mV in the pH range of 1–13, and the WSG dispersion can remain stable in water for at least 4 weeks without any obvious sedimentation. The excellent dispersion of the as-prepared WSG solution may be primarily due to the following reasons: (a) π–π interactions, and (b) nucleophilic substitution reactions between the graphene sheets and aminobenzenesulfonic acid. Besides, the oxidized products of ascorbic acid would serve as capping reagents to improve the stability of the WSG sheets. Furthermore, we also fabricated MSCs on printing paper using the as-prepared WSG dispersions by a direct printing method, and the as-prepared WSG-based MSCs exhibited high area and volume specific capacitances as high as 2.67 mF cm−2 and 6.75 F cm−3, respectively. Additionally, the MSCs demonstrated here show great flexibility and cycle stability under different bending conditions, which make them suitable for next-generation flexible micro-electrical devices.
2. Experimental section
2.1 Materials
Graphite powder (99.8% metals basis, natural, 325 mesh), aminobenzenesulfonic acid (ABS), ascorbic acid and polyvinyl alcohol (PVA) were purchased from Aladin Ltd. KMnO4, HCl (36%), H2O2 (30%) and H2SO4 (98%) were received from Sinopharm Company. All the chemicals were analytical reagents, and deionized water with a resistivity of about 18.2 MΩ cm was used for the preparation of all aqueous solutions.2.2 Synthesis of water soluble reduced graphene oxide
Graphene oxide (GO) sheets were prepared from graphite powders via a modified Hummers method.20 To prepare the water soluble reduced graphene oxide, 0.56 g of ABS was dissolved in 70 mL (2 mg mL−1) of aqueous GO suspension with ultra-sonication for 60 min. Subsequently, ascorbic acid (1.4 g) was added and stirred for another 30 min. Then the mixtures were transferred into a stainless steel autoclave with a Teflon liner of 100 mL capacity, and heated in an oven at 120 °C for 3, 6 or 9 h, and the corresponding resulting samples were named WSG-3, WSG-6, and WSG-9, respectively. After the reaction, the resulting solid mixture was washed with an abundance of deionized water several times, followed by another 30 min of ultra-sonication. Finally, the high-concentration and stable WSG dispersions were easily obtained.2.3 Direct printing of WSG inks for MSC device fabrication
A simple and scalable method was proposed to fabricate the MSC devices by a direct printing method. Briefly, a custom-made shadow mask with 11 digital fingers was assembled with a flexible substrate (such as printing paper or textile cloth), and then 1 mL of as-prepared WSG inks with different concentrations (1, 2, 3 or 4 mg mL−1) was directly printed on the substrate. The diameter of the airbrush nozzle was 0.2 mm, and the spray coating pressure was fixed at 5 bar nitrogen gas. The distance between the substrate and the airbrush nozzle was 15 cm. To achieve a homogeneous film, each spray process was conducted in a gentle manner. After a drying process and removing the mask, the hybrid film was heated at 90 °C in the oven overnight to remove residual solvent before use. After that, the WSG-based micro-patterned electrodes were successfully fabricated. For fabricating the MSC devices, a layer of polyvinyl alcohol (PVA)–H2SO4 gel electrolyte (as previously reported21) was coated onto the WSG-based micro-patterned electrodes and then the devices were dried at room temperature for 6 hours to vaporize the excess water. Afterwards, the ultra-thin flexible WSG film MSCs were prepared.2.4 Characterization and measurement
The phase analysis and microstructure identification of the samples were performed by field-emission scanning electron microscopy (FEI Nova Nano SEM 450) and X-ray diffraction (Rigaku D/Max 2500). The surface chemical element composition of the sample was determined by attenuated total reflectance-Fourier transform infrared spectroscopy (ATR-FTIR, PerkinElmer, Miracle-Dou) and X-ray photoelectron spectroscopy (MICROLAB 350). UV-visible spectral measurements were recorded on a Perkin Elmer Lambda 25 spectrophotometer, Raman spectra were taken on a laser Raman spectrometer (Finder Vista) and zeta potential measurements were investigated using a Zetasizer NANO ZS (Malvern Instruments). The electrical conductivities of the GO and WSG papers were measured by a Semiconductor Parameter Analyzer (4200-SCS) and a sheet resistance tester (NAPSON EC-80P).As for the electrochemical measurements of the MSCs, cyclic voltammetry (CV) was performed via an electrochemical work station (Zennium, Zahner, Germany) with a two-electrode system. Before the tests, two copper strips were pasted at the end of the microelectrodes using silver paste and then the CV tests were carried out in the potential window from 0 to 1.0 V at scan rates between 1 mV s−1 and 100 mV s−1. Besides, the area specific capacitance (CA) and volume specific capacitance (CV) were calculated from the CV data by eqn (a) and (b):
 | (a) |
| CV = CA/d | (b) |
 is the integral area, ν is the scan rate of the CV curves, A is the area of the electrode, ΔV is the voltage window of the CV curves, and d is the thickness of the electrode.
3. Results and discussions
3.1 Synthesis and characterization of WSG
Scheme 1 shows a schematic illustration of the synthesis process of the WSG sheets, mainly including the following three steps. First, ABS was dispersed into the GO aqueous suspension by ultra-sonication for 60 min. ABS molecules could be decorated on the GO sheets through π–π interactions. Nucleophilic substitution reactions occurred between the amine group (ABS) and the epoxide group (GO) and formed –C–NH–C– bonds.22 Then, the modified GO sheets were reduced by ascorbic acid at 120 °C for 6 h to remove most of the oxygen groups on the GO sheets and transformed to RGO. Finally, the resulting WSG dispersions were obtained after sonication for another 30 min and the concentration of the as-prepared WSG could reach as high as 5 mg mL−1. The high solubility of WSG is not only ascribed to the attachment of –SO3H groups on the WSG skeleton after the interactions between –NH2 of ABS and the oxygen functional groups on the surface of the GO sheets, but is also attributed to the π–π interactions of the aromatic groups between the ABS and RGO sheets.The formation process of WSG and its structural integrity were characterized by UV-visible absorption spectroscopy, Fourier transform infrared spectroscopy, and Raman spectroscopy. Fig. 1a shows the UV-visible spectra of the as-prepared GO and WSG dispersions at a concentration of about 20 μg mL−1. The UV-visible spectrum of GO shows two obvious absorption peaks at 230 nm and 300 nm, corresponding to the π–π* transition of the aromatic C–C rings and the n–π* transition of the C![[double bond, length as m-dash]](https://www.rsc.org/images/entities/char_e001.gif) O bonds, respectively.23 For WSG-3, in which GO was hydrothermally reduced for 3 h with ascorbic acid, a new absorption peak at 268 nm appears and the intensities of the two original peaks belonging to GO decrease, which can be explained by the increase of aromatic rings and the decrease of oxygen-containing groups (due to the reduction of graphene oxide to graphene).24 Increasing the reduction time to 6 h, the new absorption peak is further red-shifted to 270 nm, and the two original peaks completely disappear. For WSG-9, the UV-visible spectrum is almost the same as for the sample of WSG-6, which could imply that GO is completely reduced to WSG after 6 hours. In addition, this reduction process is also monitored by FT-IR spectroscopy, as shown in Fig. 1b. The spectrum of GO displays a series of strong peaks belonging to the oxygen functional groups in the GO sheets, such as 3406 cm−1 (O–H stretching vibrations), 1728 cm−1 (C
O bonds, respectively.23 For WSG-3, in which GO was hydrothermally reduced for 3 h with ascorbic acid, a new absorption peak at 268 nm appears and the intensities of the two original peaks belonging to GO decrease, which can be explained by the increase of aromatic rings and the decrease of oxygen-containing groups (due to the reduction of graphene oxide to graphene).24 Increasing the reduction time to 6 h, the new absorption peak is further red-shifted to 270 nm, and the two original peaks completely disappear. For WSG-9, the UV-visible spectrum is almost the same as for the sample of WSG-6, which could imply that GO is completely reduced to WSG after 6 hours. In addition, this reduction process is also monitored by FT-IR spectroscopy, as shown in Fig. 1b. The spectrum of GO displays a series of strong peaks belonging to the oxygen functional groups in the GO sheets, such as 3406 cm−1 (O–H stretching vibrations), 1728 cm−1 (C![[double bond, length as m-dash]](https://www.rsc.org/images/entities/char_e001.gif) O stretching vibrations from carboxylic and carbonyl groups), 1619 cm−1 (C
O stretching vibrations from carboxylic and carbonyl groups), 1619 cm−1 (C![[double bond, length as m-dash]](https://www.rsc.org/images/entities/char_e001.gif) C in aromatic rings), 1394 cm−1 (C–OH deformation vibrations), 1221 cm−1 (epoxy C–O stretching vibrations), 1082 cm−1 (C–O stretching vibrations) and 1032 cm−1 (C–O–C in epoxide).25 In the FT-IR spectrum of WSG-3, the deformation and stretching vibration peaks of the O–H groups at 1394 cm−1 and 3406 cm−1 are significantly decreased after the reduction process. Further, the O–H group at 1394 cm−1 is absent in the FT-IR spectra of WSG-6 and WSG-9. Instead, three new peaks appear at 1040 cm−1, 1106 cm−1 and 1576 cm−1, corresponding to the S–O, S-phenyl and N–H bending vibration modes, which further confirm the presence of a –SO3 group in the WSG samples. The –C–NH–C– bonds are formed during the nucleophilic substitution reaction between the amine from ABS and an epoxide group from graphene oxide.26
C in aromatic rings), 1394 cm−1 (C–OH deformation vibrations), 1221 cm−1 (epoxy C–O stretching vibrations), 1082 cm−1 (C–O stretching vibrations) and 1032 cm−1 (C–O–C in epoxide).25 In the FT-IR spectrum of WSG-3, the deformation and stretching vibration peaks of the O–H groups at 1394 cm−1 and 3406 cm−1 are significantly decreased after the reduction process. Further, the O–H group at 1394 cm−1 is absent in the FT-IR spectra of WSG-6 and WSG-9. Instead, three new peaks appear at 1040 cm−1, 1106 cm−1 and 1576 cm−1, corresponding to the S–O, S-phenyl and N–H bending vibration modes, which further confirm the presence of a –SO3 group in the WSG samples. The –C–NH–C– bonds are formed during the nucleophilic substitution reaction between the amine from ABS and an epoxide group from graphene oxide.26
To further investigate the reduction progress of WSG, the Raman spectra of GO and WSG are also explored and are presented in Fig. 1c. As reported in the literature, two characteristic peaks appear at 1346 cm−1 and 1586 cm−1, which are the typical D band and G band of GO.27 After reduction and increasing the reduction time, as compared with GO, the ratios of D/G intensity for WSG-3, WSG-6 and WSG-9 are gradually increased from 0.98 to 1.14, 1.23, and 1.24, respectively. This result indicates that most of the sp2 domains are restored during the reduction process. Combined with the results of the UV-visible and FT-IR spectra, it is considered that GO could be reduced completely in 6 hours. Therefore, the performance of WSG-6 sample will be further investigated in the following discussion.
The surface chemistry of the GO sheets and the as-prepared WSG-6 samples was evaluated by X-ray photoelectron spectroscopy (XPS). As shown in Fig. 2a and b, compared with the survey spectra of GO, the O 1s peak intensity of WSG-6 significantly decreases and the ratio of carbon and oxygen (C/O) increases from 2.3 to 5.6, suggesting that most of the oxygen functional groups are removed after the reduction process.28 The new fundamental peaks corresponding to N 1s, S 2p, and S 2s centered at around 399.8, 231.9 and 168.1 eV are ascribed to the nucleophilic substitution reactions during which the –C–NH2, –C–NH–C and –SO3H groups are generated between GO and ABS.29 Additionally, the high resolution of C 1s in GO and WSG is displayed in Fig. 2c. For C 1s in GO, as expected, the four feature peaks centered at 289.7, 288.1, 286.6, and 284.5 eV are related to C![[double bond, length as m-dash]](https://www.rsc.org/images/entities/char_e001.gif) O (carboxylic and carbonyl), C–O (epoxy and alkoxy) and C–C/C
O (carboxylic and carbonyl), C–O (epoxy and alkoxy) and C–C/C![[double bond, length as m-dash]](https://www.rsc.org/images/entities/char_e001.gif) C in the aromatic rings. After introducing ABS and reduction by ascorbic acid, for WSG, the peak intensities of the C–C and C
C in the aromatic rings. After introducing ABS and reduction by ascorbic acid, for WSG, the peak intensities of the C–C and C![[double bond, length as m-dash]](https://www.rsc.org/images/entities/char_e001.gif) C bands apparently increase, while the proportion of the C–O and C
C bands apparently increase, while the proportion of the C–O and C![[double bond, length as m-dash]](https://www.rsc.org/images/entities/char_e001.gif) O bands is relatively decreased due to the reduction of GO to graphene.30 Furthermore, the two new peaks located at 283.7 eV and 287.4 eV are assigned to C–S and C–N. The high-resolution XPS spectra for N and S have been supplemented to the manuscript in Fig. S2.† The chemical states of the sulfur dopants are illustrated in Fig. S2a.† The peaks at the binding energies of around 167.6 and 169.3 eV are attributable to C–SOx–M (x = 2, 3, 4). Besides, the high-resolution N 1s spectrum can be disassembled into three peaks located at 398.7, 400.2 and 401.8 eV, which can be assigned to pyridine-like, pyrrole-like, and graphitic-N (also known as quaternary-N), indicating that ABS has been successfully introduced onto the surface of the WSG sheets.
O bands is relatively decreased due to the reduction of GO to graphene.30 Furthermore, the two new peaks located at 283.7 eV and 287.4 eV are assigned to C–S and C–N. The high-resolution XPS spectra for N and S have been supplemented to the manuscript in Fig. S2.† The chemical states of the sulfur dopants are illustrated in Fig. S2a.† The peaks at the binding energies of around 167.6 and 169.3 eV are attributable to C–SOx–M (x = 2, 3, 4). Besides, the high-resolution N 1s spectrum can be disassembled into three peaks located at 398.7, 400.2 and 401.8 eV, which can be assigned to pyridine-like, pyrrole-like, and graphitic-N (also known as quaternary-N), indicating that ABS has been successfully introduced onto the surface of the WSG sheets.
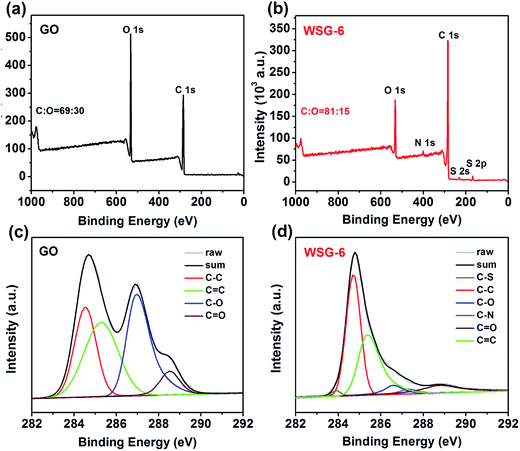 | ||
| Fig. 2 XPS survey spectra of GO (a) and WSG-6 (b), high-resolution C 1s spectra of GO (c) and WSG-6 (d). | ||
Further, SEM measurements were employed to identify the morphology of WSG-6. As revealed in Fig. 3, it is clearly seen that the surface of WSG-6 is fairly rough with lots of micron-sized wrinkles, which might be attributed to the presence of rigid phenyl groups from ABS that serve as a spacer to effectively prevent the face-to-face stacking of graphene sheets via π–π interactions.31 From the elemental mappings, it is clear that C, O, S, and N are uniformly distributed on the whole surface of WSG, further verifying the presence of elemental N and S. Moreover, the water solubility performance of the as-prepared WSG dispersion (0.5 mg mL−1) is characterized in detail by zeta-potential measurements. It is well known that zeta potential is an effective way to investigate the stability of colloidal dispersions and the surface electrical potential of particles. Usually particles in solution with a zeta potential of more than ±40 mV could be considered as a stable dispersion, owing to interparticle electrostatic repulsion.32
3.2 Morphology, dispersion stability, and electrical conductivity of WSG
As displayed in Fig. 4, the zeta potentials of the GO and WSG dispersions are measured at pH 1–13, and both of them are negatively charged. For GO, the values of the zeta potential decrease with the increase of pH values and reach a minimum value of −58.8 mV at pH 11. These negative charges are mainly derived from the ionization of the phenolic hydroxyl and carboxylic acid groups on the surface of the GO sheets. Similar to GO, the zeta potential values of WSG also decrease with the increase of pH from 1 to 11, and the lowest value is −62.6 mV, which may be attributed to the attachment of the negatively charged –SO3− groups on the surface of the WSG nanosheets. The observed phenomenon of the weak increase of zeta potential as the pH value is increased beyond 11 may be ascribed to the compression of the double layer at high ionic strengths.33 Besides, the WSG dispersion (2 mg mL−1) is displayed in the inset of Fig. 4 and there is almost no obvious change and sedimentation before and after storing for 4 weeks, which further demonstrates the great water dispersion stability of the WSG dispersions. Therefore, owing to the synergistic effect of π–π interactions and the nucleophilic substitution reaction introduced by ABS and the reductant ascorbic acid, the as-prepared WSG possesses excellent water soluble stability, which is comparable to that of the graphene oxide solution. Moreover, the N2-adsorption isotherm of WSG in Fig. S1† demonstrates a type IV isotherm with an obvious hysteresis loop in the P/P0 range of 0.45–1.0, indicating the presence of mesopores in WSG. From the pore size distribution (inset in Fig. S1†), mesopores with a narrow range centered at 7.8 nm can be clearly observed, and the WSG exhibits a specific surface area of 223.5 m2 g−1 and a total pore volume of 0.231 cm3 g−1.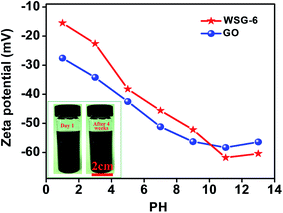 | ||
| Fig. 4 Zeta potential of GO and WSG-6 dispersions at different pH values. The inset shows the photographic images of the WSG-6 dispersion before and after storing for 4 weeks. | ||
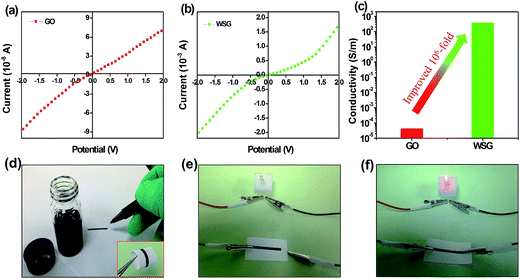
In general, the electrical conductivity of the chemically reduced graphene oxide depends on the restoration of the electronic conjugation state and the degree of reduction. In order to measure the electrical conductivity, the GO and WSG-6 films were fabricated via vacuum filtration through a polyvinylidene fluoride (PVDF) anodic membrane (0.22 μm pore size). The I–V tests were performed on a Semiconductor Parameter Analyzer, as shown in Fig. 5a and b. It is seen that both the GO and WSG films show nonlinear and almost symmetric properties, and the electrical conductivity increases from <10−4 S m−1 for the GO paper to about 360 S m−1 for the WSG film, about a 106-fold improvement, as shown in Fig. 5c. This is consistent with the result of the sheet resistance test for the WSG paper (300 Ω sq−1, 10 μm). As a result, it is demonstrated that the electrical conductivity of the as-prepared WSG using ascorbic acid as the reducer here is comparable to the GO reduced via a laser or other reducing agents.34 Thus, the excellent electrical conductivity of WSG will be beneficial to improve the electrochemical performance of electrodes. As a demonstration, an electric line of WSG was written on paper, as shown in Fig. 5d, and was used as a conductor to form a circuit with a commercial light-emitting diode. As shown in Fig. 5e and f, the LED was lit after being connected to a power source, which further indicates the good electrical conductivity of WSG and its potential applications in electronic products.
3.3 Fabrication and electrochemical performance of the WSG-MSCs
Fig. 6a illustrates the fabrication process of the WSG-MSC devices with a shadow mask-assisted direct printing method. Before deposition, a custom-made shadow mask with 11 inter-digital fingers (widths of both the channels and fingers are 500 μm, and lengths are 1 cm) was assembled with flexible printing paper, and then 1 mL of the as-prepared WSG ink (2 mg mL−1) was directly printed on the substrate. After drying at room temperature for 6 hours and removing the mask, the WSG micro-patterned electrodes were successfully fabricated (as shown in Fig. 6b). Besides, for comparison, different concentrations (1, 2, 3, and 4 mg mL−1) of WSG dispersions were used to fabricate MSC electrodes, and the obtained devices were named WSG1-MSC, WSG2-MSC, WSG3-MSC, and WSG4-MSC, respectively. To assemble the solid-state WSG-MSC devices, a layer of PVA–H2SO4 gel electrolyte was coated onto the WSG micro-patterned electrodes and then the gel electrolytes were solidified at 60 °C for 6 hours to vaporize the excess water. Afterwards, all-solid-state ultra-thin flexible WSG-MSCs were obtained.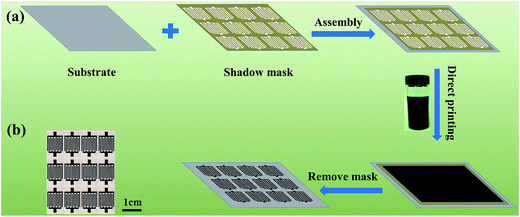 | ||
| Fig. 6 (a) Fabrication process of the WSG-MSC devices. (b) Photographic image of the as-prepared WSG-MSC array. | ||
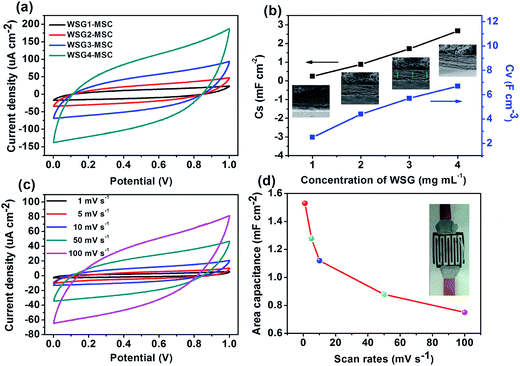
The effect of the concentration of WSG ink for fabricating the WSG-MSCs is evaluated from 1 mg mL−1 to 4 mg mL−1 and the CV curves of the WSG-MSCs are displayed at a scan rate of 50 mV s−1, as shown in Fig. 7a. It is noteworthy that the surrounded areas of the CV curves increase with the increase of concentration of the WSG inks and all the curves show almost rectangular-like shapes, which exhibit the typical EDLC behavior of carbon-based materials and an excellent potential application of the as-prepared WSG inks.35 Additionally, based on eqn (a) and (b), the area specific capacitance (CA) and volume specific capacitance (CV) are calculated from the CV curves, as shown in Fig. 7b. With the concentration of WSG inks increasing from 1 to 4 mg mL−1, the thickness of the obtained WSG-MSCs grows linearly to 1.03 μm, 2.12 μm, 3.15 μm and 4.09 μm, respectively. Besides, the corresponding CA and CV increase from 0.25 mF cm−2 and 2.5 F cm−3 to 2.67 mF cm−2 and 6.75 F cm−3. Compared with other graphene-based MSCs, the CA and CV of the WSG-MSCs are superior to those of most of the devices summarized in Table 1, for instance, onion-like carbon-based MSCs (1.7 mF cm−2 and 1.3 F cm−3, thickness about 7 μm) and reduced graphene oxide MSCs via laser reduction (0.51 mF cm−2 and 3.1 F cm−3, thickness about 20 μm). To further investigate the electrochemical performance of the all-solid-state WSG2-MSC device made of the electrode with an ink concentration of 2 mg mL−1, cyclic voltammetry measurements are carried out and shown in Fig. 7c. All the CV curves show nearly symmetric and rectangular shapes at different scan rates of 1–100 mV s−1 under the voltage window in the range of 0–1 V, indicating the remarkable rate capability and fast diffusion of ions in the WSG-based micro-electrodes. Moreover, there is no deformation in the CV shape, even at a high scan rate of 100 mV s−1, which may be attributed to the high efficiency charge transfer mechanism of the electronic double layer capacitor. According to eqn (a), CA of the WSG2-MSC device is calculated from the CV curve and is displayed in Fig. 7d.
| C A | C V | Active material | Film thickness | Measuring conditions (electrolyte, potential window, scan rate) | Ref. |
|---|---|---|---|---|---|
| 1.7 mF cm−2 | 1.3 F cm−3 | Onion-like carbon film | 7 μm | Organic electrolyte, 0–3 V, 1 V s−1 | 36 |
| 0.51 mF cm−2 | 3.1 F cm−3 | Laser reduced GO | 20 μm | Aqueous electrolyte, 0–1 V, 20 mV s−1 | 37 |
| 2.32 mF cm−2 | 3.05 F cm−3 | Laser reduced GO | 8 μm | PVA–H2SO4, 0–1 V, 16.8 mA cm−3 | 9 |
| 80.7 μF cm−2 | 17.9 F cm−3 | GO film by methane plasma treatment | 15 nm | PVA–H2SO4, 0–1 V, 10 mV s−1 | 38 |
| 2.67 mF cm−2 | 6.75 F cm−3 | WSG (water soluble reduced GO film) | 4 μm | PVA–H2SO4, 0–1 V, 50 mV s−1 | Our work |
The CA value of the device is up to 1.53 mF cm−2 at a scan rate of 1 mV s−1 and about 49.1% of CA (0.75 mF cm−2) is retained as the scan rate is increased to 100 mV s−1. The decrease of the specific capacitance could be due to the limited electrochemical reactions of the device at a high scan rate.
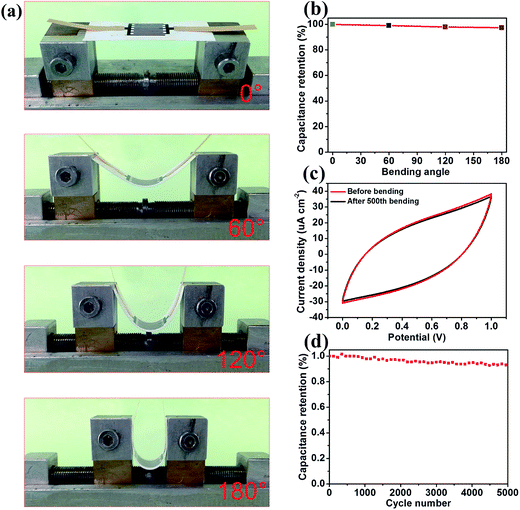
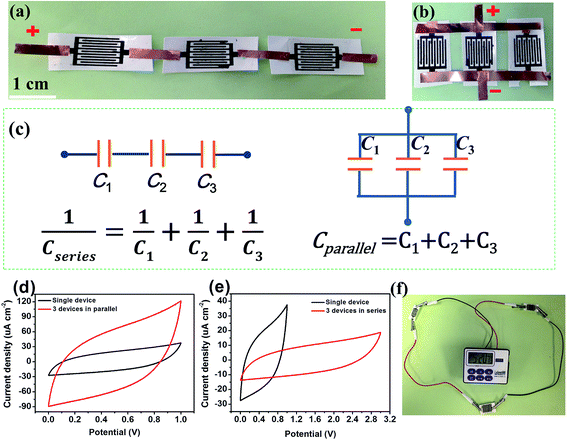
In order to investigate the mechanical and cycle stability of the WSG2-MSCs for flexible energy storage devices, the devices were bent at different angles, as shown in Fig. 8a. The CA retention of the as-fabricated devices was evaluated with different bending angles from 0° to 180°, as shown in Fig. 8b, and the results exhibit only a small capacitance decrease of 2.3% as compared with the normal state. Moreover, CA of the as-fabricated MSCs is further examined under the 500th bending cycle test (bending radius = 5 mm), as shown in Fig. 8c. Compared with the original CV curve (red line), there is nearly no obvious shrinkage for the curve (black line) after the 500th bending cycle. The WSG2-MSC device still maintains 94.8% of its initial CA even after 5000 cycles, as displayed in Fig. 8d, suggesting great mechanical durability and good cycle stability. Therefore, the excellent stability could be attributed to the strong adhesion between the printing paper and the flexible graphene sheets, and the gel electrolyte of PVA–H2SO4 also provided a stable interface for the microelectrodes and substrate. Owing to the low energy density and potential window of the single micro-supercapacitor device, MSCs are often designed to connect several devices in parallel or in series for practical applications. The photographs presented in Fig. 9a and b show three WSG2-MSCs connected in series and in parallel. The electrochemical performances of a set of parallel and series connected devices are investigated using CV. As displayed in Fig. 9d, the CV curve (red line) of three WSG2-MSCs connected in parallel exhibits much larger surrounded areas and a higher average current density as compared with the CV curve (black line) of a single WSG2-MSC at the same scan rate of 50 mV s−1, and the area specific capacitance is almost threefold that of the single device. Moreover, in the series connection (Fig. 9e), the voltage range of the CV curve increases from 1 V to 3 V, providing a 3 times higher potential window for assembling the devices. Additionally, to further demonstrate the adaptability of the WSG-MSCs for parallel and series combinations, a liquid crystal display (1.5 V) is successfully powered by three WSG2-MSCs in series, as displayed in Fig. 9f. Therefore, the excellent electrochemical performances of the flexible WSG2-MSCs show that WSG inks are valuable candidates for fabricating printed MSCs in an inexpensive and scalable way.
4. Conclusions
In summary, printable WSG inks with a high concentration, good electrical conductivity and excellent water dispersion stability have been successfully synthesized and a scalable and cost-effective screen-printing method has been used to fabricate all-solid-state flexible MSCs. The prepared WSG-MSCs show high area and volume specific capacitances of 2.67 mF cm−2 and 6.75 F cm−3, maintaining 94.8% of their initial specific capacitance after 5000 cycles at a scan rate of 50 mV s−1. Moreover, the devices exhibit excellent mechanical stability with no obvious degradation over the 500th bending cycle. In a word, the main achievement of this research is the development of a facile and efficient way to obtain cheap and abundant graphene-based inks for the scalable fabrication of MSCs via a direct printing technique, which exhibit great potential applications in the next generation of “printing electronics”.Acknowledgements
This work was financially supported by the National Key R&D project from the Ministry of Science and Technology of China (2016YFA0202702), National Natural Science Foundation of China (21571186), Guangdong Innovative Research Team Program (No. 2011D052 and KYPT20121228160843692), “Guangdong TeZhi plan” Youth Talent of Science and Technology (2014TQ01C102), and Shenzhen Basic Research Plan (JSGG20150512145714246 and JCYJ20140610152828685). Also, H. B. Su, Q. Wang and T. X. Li would like to acknowledge the Taishan Scholarship Project of Shandong Province (tshw20130956).References
- T. Ouyang, K. Cheng, Y. Y. Gao, S. Y. Kong, K. Ye, G. L. Wang and D. X. Cao, J. Mater. Chem. A, 2016, 4, 9832–9843 CAS.
- X. F. Wang, X. H. Lu, B. Liu, D. Chen, Y. X. Tong and G. Z. Shen, Adv. Mater., 2014, 26, 4763–4782 CrossRef CAS PubMed.
- P. Huang, C. Lethien, S. Pinaud, K. Brousse, R. Laloo, V. Turq, M. Respaud, A. Demortiere, B. Daffos, P. L. Taberna, B. Chaudret, Y. Gogotsi and P. Simon, Science, 2016, 351, 691–695 CrossRef CAS PubMed.
- D. Kim, G. Shin, Y. J. Kang, W. Kim and J. S. Ha, ACS Nano, 2013, 7, 7975–7982 CrossRef CAS PubMed.
- Z. L. Liu, F. Teng, C. Chang, Y. R. Teng, S. R. Wang, W. H. Gu, Y. Z. Fan, W. Q. Yao and Y. F. Zhu, Nano Energy, 2016, 27, 58–67 CrossRef CAS.
- C. W. Shen, X. H. Wang, W. F. Zhang and F. Y. Kang, J. Power. Sources, 2011, 196, 10465–10471 CrossRef CAS.
- C. W. Shen, X. H. Wang, S. W. Li, J. G. Wang, W. F. Zhang and F. Y. Kang, J. Power. Sources, 2013, 234, 302–309 CrossRef CAS.
- T. Zhai, L. M. Wan, S. Sun, Q. Chen, J. Sun, Q. Y. Xia and H. Xia, Adv. Mater., 2017, 29, 1604167 CrossRef PubMed.
- N. Jabeen, Q. Y. Xia, S. V. Savilov, S. M. Aldoshin, Y. Yu and H. Xia, ACS Appl. Mater. Interfaces, 2016, 8, 33732–33740 CAS.
- J. Q. Liu, M. B. Zheng, X. Q. Shi, H. B. Zeng and H. Xia, Adv. Funct. Mater., 2016, 26, 919–930 CrossRef CAS.
- Z. Q. Niu, L. Zhang, L. L. Liu, B. W. Zhu, H. B. Dong and X. D. Chen, Adv. Mater., 2013, 25, 4035–4042 CrossRef CAS PubMed.
- M. F. EI-Kady and R. B. Kaner, Nat. Commun., 2013, 4, 1475–1480 CrossRef PubMed.
- S. K. Ujjain, P. Ahuja, R. Bhatia and P. Attri, Mater. Res. Bull., 2016, 83, 167–171 CrossRef CAS.
- Z. Y. Liu, Z. S. Wu, S. Yang, R. H. Dong, X. L. Feng and K. Müllen, Adv. Mater., 2016, 28, 2217–2222 CrossRef CAS PubMed.
- L. L. Zhang, X. Zhao, M. D. Stoller, Y. W. Zhu, H. X. Ji, S. Mueali, Y. P. Wu, S. Perales, B. Clevenger and R. S. Ruoff, Nano Lett., 2012, 12, 1806–1812 CrossRef CAS PubMed.
- X. L. Zhao, B. N. Zheng, T. Q. Huang and C. Gao, Nanoscale, 2015, 7, 9399–9404 RSC.
- Y. L. Shao, M. F. EI-kady, C. W. Lin, G. Z. Zhu, K. L. Marsh, J. Y. Hwang, Q. H. Zhang, Y. G. Li, H. Z. Wang and R. B. Kaner, Adv. Mater., 2016, 28, 6719–6726 CrossRef CAS PubMed.
- A. Mukherjee, J. Kang, O. Kuzneysov, Y. Q. Sun, R. Thaner, A. S. Bratt, J. R. Lomeda, K. F. Kelly and W. E. Billups, Chem. Mater., 2011, 23, 9–13 CrossRef CAS.
- Y. S. Ye, H. X. Zeng, J. Wu, L. Y. Dong, J. T. Zhu, Z. G. Xue, X. P. Zhou, X. L. Xie and Y. W. Mai, Green Chem., 2016, 18, 1674–1683 RSC.
- W. S. Hummers and R. E. Offeman, J. Am. Chem. Soc., 1958, 80, 1339 CrossRef CAS.
- H. B. Su, P. L. Zhu, L. C. Zhang, F. R. Zhou, G. Li, T. X. Li, Q. Wang, R. Sun and C. P. Wong, J. Electroanal. Chem., 2017, 786, 28–34 CrossRef CAS.
- G. Q. Tang, Z. G. Jiang, X. F. Li, H. B. Zhang, A. Dasari and Z. Z. Yu, Carron, 2014, 77, 592–599 CAS.
- U. K. Sur, A. Saha, A. Datta, B. Ankamwar, F. Surti, S. D. Roy and D. Roy, Bull. Mater. Sci., 2016, 39, 159–165 CrossRef CAS.
- D. Li, M. B. Müller, S. Gilje, R. B. Kaner and G. G. Wallace, Nat. Nanotechnol., 2008, 3, 101–105 CrossRef CAS PubMed.
- T. F. Huang, L. Zhang, H. L. Chen and C. J. Gao, J. Mater. Chem. B, 2015, 3, 1605–1611 RSC.
- W. S. Hung, C. H. Tsou, M. D. Guzman, Q. F. An, Y. L. Liu, Y. M. Zhang, C. C. Hu, K. R. Lee and J. Y. Lai, Chem. Mater., 2014, 26, 2983–2990 CrossRef CAS.
- Y. J. Wan, L. C. Tang, L. X. Gong, D. Yan, Y. B. Li, L. B. Wu, J. X. Jiang and G. Q. Lai, Carbon, 2014, 69, 467–480 CrossRef CAS.
- H. L. Ma, H. B. Zhang, Q. H. Hu, W. J. Li, Z. G. Jiang, Z. Z. Yu and A. Dasari, ACS Appl. Mater. Interfaces, 2012, 4, 1948–1953 CAS.
- T. Akhter, M. M. Islam, S. N. Fasial, E. Haque, A. I. Minett, H. K. Liu, K. Konstantionv and S. X. Dou, ACS Appl. Mater. Interfaces, 2016, 8, 2078–2087 CAS.
- U. Saha, R. Jaiswal and T. H. Goswami, Electrochim. Acta, 2016, 196, 384–404 CrossRef.
- S. Yang, M. R. Lohe, K. Müllen and X. L. Fang, Adv. Mater., 2016, 28, 6213–6221 CrossRef CAS PubMed.
- C. Wu, X. Y. Huang, G. L. Wangm, L. B. Lv, G. Chen, G. Li and P. K. Jiang, Adv. Funct. Mater., 2013, 23, 506–513 CrossRef CAS.
- B. Konkena and S. Vasudevan, J. Phys. Chem. Lett., 2012, 3, 867–872 CrossRef CAS PubMed.
- J. Gao, F. Liu, Y. L. Liu, N. Ma, Z. Q. Wang and X. Zhang, Chem. Mater., 2010, 22, 2213–2218 CrossRef CAS.
- T. Q. Huang, B. N. Zheng, Z. Liu, L. Kou and C. Gao, J. Mater. Chem. A, 2015, 3, 1890–1895 CAS.
- D. Pech, M. Brunet, H. Durou, P. Huang, V. Mochalin, Y. Gogotsi, P. L. Taberna and P. Simon, Nat. Nanotechnol., 2010, 5, 651–654 CrossRef CAS PubMed.
- W. Gao, N. Singh, L. Song, Z. Liu, A. L. M. Reddy, L. Ci, R. Vajtai, Q. Zhang, B. Wei and P. M. Ajayan, Nat. Nanotechnol., 2011, 6, 496–500 CrossRef CAS PubMed.
- Z. S. Wu, K. Parvez, X. Feng and K. Müllen, Nat. Commun., 2013, 4, 2487–2492 Search PubMed.
Footnote |
| † Electronic supplementary information (ESI) available. See DOI: 10.1039/c7se00214a |
| This journal is © The Royal Society of Chemistry 2017 |

