 Open Access Article
Creative Commons Attribution 3.0 Unported Licence
Controlling the network type in self-assembled dipeptide hydrogels†
Catherine
Colquhoun
a,
Emily R.
Draper
b,
Ralf
Schweins
c,
Marco
Marcello
d,
Devkee
Vadukul
e,
Louise C.
Serpell
e and
Dave J.
Adams
 *b
*b
aInstitute of Medical and Biological Engineering – School of Biomedical Sciences, University of Leeds, Leeds, LS2 9JT, UK
bSchool of Chemistry, Joseph Black Building, University of Glasgow, Glasgow G12 8QQ, UK. E-mail: dave.adams@glasgow.ac.uk
cInstitut Laue-Langevin, Large Scale Structures Group, 71 Avenue des Martyrs, CS 20156, F-38042 Grenoble CEDEX 9, France
dInstitute of Integrative Biology, University of Liverpool, Liverpool, L69 7ZB, UK
eSchool of Life Sciences, University of Sussex, Falmer, BN1 9QG, UK
First published on 31st January 2017
Abstract
We show that the same low molecular weight gelator can form gels using three different methods. Gels were formed from a high pH solution either by adding a salt or by adding an acid; gels were also formed by adding water to a solution of the gelator in an organic solvent. The mechanical properties for the gels formed by the different methods are different from one another. We link this to the network type that is formed, as well as the fibrous structures that are formed. The salt-triggered gels show a significant number of fibres that tend to align. The acid-triggered gels contain many thin fibres, which form an entangled network. The solvent-triggered gels show the presence of spherulitic domains. We show that it is tractable to vary the trigger mechanism for an established, robust gelator to prepare gels with targeted properties as opposed to synthesising new gelators.
Introduction
Gels formed using low molecular weight gelators (LMWGs) differ from those formed using polymer matrices. For example, since the molecules in LMWGs are held together by non-covalent interactions, rapid and easy gel-to-sol transitions are common, allowing triggered systems. Also, commonly only very low concentrations of the gelator are required (typically less than 1 wt%).1–3 The number of applications for low molecular weight gels is increasing all the time. There are many examples of industrial use, for example in lubricants and glues.4 More recently, there has been growing interest in these materials, for example as scaffolds for regenerative medicine,5,6 drug delivery,7 or for optoelectronic applications.8,9 For all these areas, a key need is to be able to control the mechanical properties of the gels. In general, a LMWG is described as being able to form a gel in a specific solvent, or solvents. If rheological data are provided, this tends to be for a specific set of conditions. However, it is becoming increasingly clear that how one prepares the gel is critical in determining the mechanical properties.10,11 We recently reviewed a small number of examples where it is clear that gels with a range of properties can be prepared from a single LMWG, as long as one is able or willing to adjust the process by which the gelation is carried out.11Designing LMWGs from first principles is often difficult. Computational design or prediction approaches are becoming more common,12–14 but generally new LMWGs are found by iterating around a known chemical structure, or by chance.2 Hence, if a particular set of properties is required, there are two options. First, one could synthesise a wide range of potential chemical structures, hoping to find one that gives a gel with the desired properties, or one could take a known LMWG and vary the gelling conditions. The latter approach seems perhaps more effective, especially considering the paucity of design rules. However, it is clear that gels with different properties can be formed from a single LMWG by varying the process of gelation,11 but little has been reported showing clearly how this can be done. One rare example is for peptide amphiphiles, where it has been shown that different types of network can be formed from a single peptide amphiphile if it is gelled by the addition of a salt or by the addition of acid.15
The gel properties arise from the formation of a three-dimensional network by the self-assembly of the LMWG.1,3 It is clear that the LMWG assembles into fibres or other one dimensional structures, that then entangle or branch to provide cross-links. It is not known how to control the assembly in general. There are further complications from lateral assembly for example, which make the network difficult to describe simply.
Here, we take a single LMWG that can be used to form hydrogels in three different ways. For this gelator, gels cannot be formed by a simple heating and cooling cycle. However, the LMWG, a functionalised dipeptide16 2NapFF (Scheme 1), can be used to form gels at a concentration of 1.0 wt% and lower by (i) dissolution at high pH followed by addition of a divalent salt such as calcium; (ii) dissolution at high pH, followed by a reduction in pH; or (iii) dissolution in a water-miscible solvent such as DMSO, followed by the addition of water. The latter method relies on the solubility of 2NapFF in DMSO, and a lack of solubility in water. Hence, this LMWG is a perfect tool to probe how the process of gel formation affects the final mechanical properties. We have previously described gels formed by methods (i)17 and (ii),18 but not focused on the variation in mechanical properties that are possible.
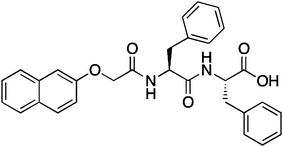 | ||
| Scheme 1 Structure of the LMWG 2NapFF. For method (i), the carboxylic acid will be deprotonated, whereas the gels will contain the protonated form of 2NapFF in methods (ii) and (iii). | ||
Results and discussion
For the gels formed using methods (i) and (ii), a solution of 2NapFF was prepared at high pH by adding 1 molar equivalent of sodium hydroxide. The solution was prepared at 1.0 wt% and then diluted as required. Gels were formed by method (i) by adding aliquots of a concentrated solution of calcium nitrate to the solution of 2NapFF at high pH.17,19,20 Gelation was rapid, but the gels were allowed to equilibrate for 18 hours before measurement. We have previously provided significant details about method (i) for the gelation of 2NapFF.17 Gels formed by this method will be referred to as Ca-triggered gels throughout.Gels were formed using method (ii) by adding aliquots of the solutions of 2NapFF at high pH to glucono-δ-lactone (GdL), which hydrolyses slowly to gluconic acid over time.21 This method allows a slow, uniform pH change.22,23 Gels formed by this method will be referred to as acid-triggered gels throughout.
For the gels formed by first dissolving in an organic solvent, we chose DMSO. There is much precedent for use of this solvent with related LMWG.24–26 We have previously shown for Fmoc-dipeptides that the ratio of DMSO to water (ϕDMSO) in the final gel can affect the gel properties.26,27 We highlight that there are differences in behavior for 2NapFF gels at different ratios of solvent (Fig. S1, ESI†), but pragmatically for the current study, we focused on a ϕDMSO of 0.10 (note that to ensure no differences with slight changes in solvent, we used D2O throughout, instead of H2O; however, there appear to be no discernable differences in behavior when H2O is used). This is the sample with the lowest amount of DMSO that was found to be stable long term; samples at a ϕDMSO of 0.05 initially formed self-supporting gels, but these became a fluid over approximately 30 hours. For the gels prepared using this method at this ϕDMSO, the 2NapFF was dissolved in DMSO at a number of concentrations and then water added. As for related LMWGs, the solution becomes extremely turbid on first addition of water, clarifying over a matter of minutes.26–29 Gelation is hence fast; this results in bubbles forming at low concentrations of 2NapFF, which may also be an effect of the slight exotherm on mixing DMSO and water.27 Microscope images showing a close-up of the gels at 1, 5, and 10 mg mL−1 are shown in Fig. S2 (ESI†), showing the absence of any crystalline material.
The turbid to clear transition can be linked to a phase separation process.26,30 The pH of the gels at this point is typically 3.9 ± 0.1. Gels formed by this method will be referred to as solvent-triggered gels throughout. We note here that the absolute pH will be a factor in determining the properties; in related work, we have shown how for this type of gelator the pH below which gels are formed for the acid-triggered method is essentially the pH below which gels are formed for the solvent-triggered approach.27
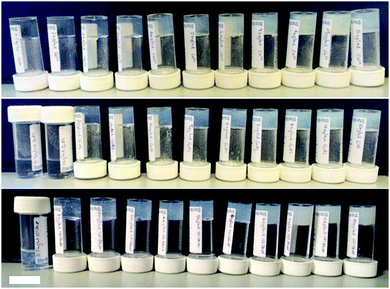
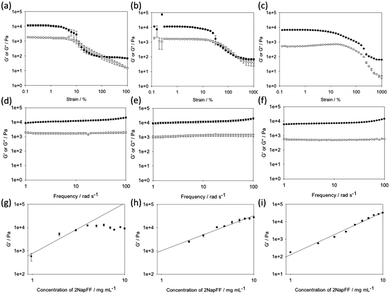
In all cases, the final gels are generally translucent, although there is a slight increase in turbidity with concentration (Fig. 1). Gels were formed at concentrations of 2NapFF between 1 mg mL−1 and 10 mg mL−1 (0.1 and 1.0 wt%), as determined by the vial inversion test. However, the acid-triggered gel resulted in a very weak material at 1 mg mL−1, which was barely stable to vial inversion. For all the gels, we measured the rheological properties. In all cases, we carried out three repeat measurements as a minimum. We also collected frequency and strain sweeps to examine different behaviour (Fig. 2).
First, from the strain sweeps, it is clear that the gels formed by the three methods behave differently. For the Ca- and acid-triggered gels, there is a region at low strain where the gels are insensitive to the applied strain. However, for both these types of gels, the gels break sharply once a certain strain is applied, with G′ dropping below G′′. The acid-triggered gels break more sharply than the Ca-triggered gels. The solvent-triggered gels show a region where the storage and loss moduli (G′ and G′′ respectively) are relatively independent of the applied strain. The gels begin to break down gradually, with both G′ and G′′ decreasing. However, G′ never drops below G′′, even at very high strain. This can be explained by the gel containing a microstructure that is able to recover at a higher frequency than that used by the rheometer for these strain measurements. These differences in behaviour are immediately indicative of there being different types of network present in the gels.
The frequency sweeps show less variation between the gels formed by the three methods. In all cases, the data are relatively independent of frequency. The tan![[thin space (1/6-em)]](https://www.rsc.org/images/entities/char_2009.gif) δ for the gels is 0.14 for the Ca-triggered gels, 0.11 for the acid-triggered gels, and 0.12 for the solvent-triggered gels, showing that these are true gels in each case.31 For all of the gels, the absolute magnitude of G′ and G′′ is similar, so the differences in behavior observed in the strain sweeps cannot be ascribed to simply different gel strengths. The strain and frequency sweeps for the gels formed by the different methods at different concentrations are shown in the ESI† (Fig. S3–S15). Previous work on peptide amphiphiles has found similar strain sweeps, but for different triggers;15 the gels formed by addition of acid have similar strain behaviour to that shown here, but the gels formed by addition of a calcium salt look similar to the networks formed here using the solvent trigger. As such, it is clear that there will be differences between gelators and their behaviour.
δ for the gels is 0.14 for the Ca-triggered gels, 0.11 for the acid-triggered gels, and 0.12 for the solvent-triggered gels, showing that these are true gels in each case.31 For all of the gels, the absolute magnitude of G′ and G′′ is similar, so the differences in behavior observed in the strain sweeps cannot be ascribed to simply different gel strengths. The strain and frequency sweeps for the gels formed by the different methods at different concentrations are shown in the ESI† (Fig. S3–S15). Previous work on peptide amphiphiles has found similar strain sweeps, but for different triggers;15 the gels formed by addition of acid have similar strain behaviour to that shown here, but the gels formed by addition of a calcium salt look similar to the networks formed here using the solvent trigger. As such, it is clear that there will be differences between gelators and their behaviour.
In order to determine changes in the networks formed, the power law scaling of G′ with 2NapFF concentration was assessed. A scaling behaviour such that G′ ∝ Cα has been reported for a number of different gels. For entangled semi-flexible networks, α has been shown to be 1.4.32 For cross-linked networks (including examples of peptide-based hydrogels), α has been shown to be around 2.2.33–38 There are however some examples of peptide hydrogels where α can be as high as 3.7.39,40 For colloidal gels, α is between 3 and 6.41,42
Here, slightly different scaling behaviour was found for the three methods (Fig. 2g–i). The scaling exponent for the Ca-triggered gels was found to be 2.17 for concentrations between 1 and 4 mg mL−1. Above this concentration, the exponent was very different, with essentially little change in the magnitude of G′ as the concentration increased. We previously found an exponent of 2.2 for gels formed by this method that held from 1 mg mL−1 to 10 mg mL−1.17 We explain these differences in terms of the starting pH. Here, we started from a solution at pH 12.6, whilst previously we used solutions at a pH of 10.5. The absolute pH seems to affect the tendency of the worm-like micelles formed at high pH20 to laterally associate. Indeed, it is possible to form liquid crystalline phases with 2NapFF at high pH.17 We have found elsewhere43 that the modulus of the gels formed at a concentration of 11 mg mL−1 was lower than that at 5 mg mL−1 in agreement with the data here; again, in that case we were also at a pH of above 12. For these gels, it is clear therefore that the absolute pH is another variable to control the mechanical properties. For the acid-triggered gels, the exponent was 1.98. Finally, for the gels formed using solvent-triggered gels, the exponent was 2.43.
Finally, we also examined the recovery of the mechanical properties after a shear deformation. This was probed by applying a high shear rate to disrupt the gels. G′ and G′′ were then monitored upon cessation of this steady flow shear (Fig. 3).26,27,33 The Ca-triggered gels recover 32% of their original value of G′ after the first high shear deformation, and an average of 50% over five cycles. Little loss in recoverability is seen over further cycles, and indeed in some cases the value of G′ is higher than after the first deformation cycle (Fig. 3a). The acid-triggered gels recover 100% of their original value of G′ after the first high shear deformation, and an average of 58% over five cycles. It is however clear that after three deformations the gels start to break down significantly (Fig. 3b). Surprisingly considering how other gels formed by this method have been shown to recover well,26,33 the solvent-triggered gels only recover 10% of their original G′ after the first deformation, with this value being maintained over the five cycles. In all cases, the recovery depended on the strain used for this measurement (Fig. S16, ESI†). At deformations of 300% strain, the acid-triggered gels recover 100% of their original G′ over five successive cycles.
 | ||
| Fig. 3 Recovery tests for (a) Ca-triggered gels; (b) acid-triggered gels; and (c) solvent-triggered gels. In all cases, the gels were subjected to a constant frequency of 10 rad s−1 and a strain of 0.5% for 200 seconds, followed by a higher strain of 500% for 60 seconds. Restoration of the gel was monitored in the subsequent time sweep (again at a frequency of 10 rad s−1 and a strain of 0.5%). These cycles were repeated five times. The data at 300% and 1000% strain are shown in the ESI.† | ||
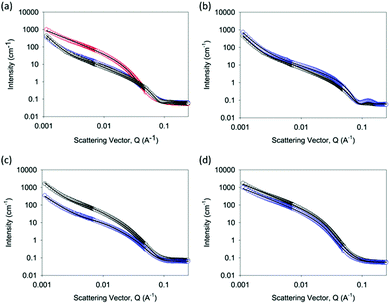
To explain these differences, we probed the gels at a number of length-scales. First, we used small angle neutron scattering (SANS), which can probe structures formed over length scales up to hundreds of nanometres.44 Hence, it is possible to determine the primary structure dimensions and obtain some information regarding the network structure. SANS data were obtained for gels formed by each method at 5 mg mL−1 and 10 mg mL−1, and then fitted (Fig. 4).
The data for the Ca-triggered gels can be best fit to a combination of an absolute power law and a flexible cylinder model as described previously (Fig. 4b);17 the low Q region is sensitive to the fractal scattering from the network structure. In close agreement with our previous report, at 5 mg mL−1, the radius fits to a radius of 4.01 ± 0.03 nm.45 The Kuhn length was found to be 29.93 ± 2.36 nm, and the overall length was around 119.7 ± 2.34 nm. At 10 mg mL−1, the radius was unchanged at 4.01 ± 0.05 nm, but the Kuhn length and the overall length increased dramatically to 267.9 ± 20.5 nm and >1 μm respectively. This implies that the primary structures are similar, but the formation of salt bridges between the fibres17 results in a significantly increased Kuhn length. This explains the rheological data above, where the absolute modulus at 10 mg mL−1 was lower than that at 5 mg mL−1.
The data for acid-triggered gels can be best fit to a combination of an elliptical cylinder and an absolute power law to fit the low Q region (Fig. 4c). Fits to the cylinder or flexible cylinder models were less good than the elliptical model. To fit the data, the Kuhn length was fixed to a number of values and the fit was optimised based on the residuals. The best fit at 5 mg mL−1 was found with a radius of 3.13 ± 0.05 nm, an axis ratio of 2.15 ± 0.01, a Kuhn length of 17.20 ± 0.13 nm, and a length of 172.0 ± 2.16 nm. At 10 mg mL−1, the best fit was found with a radius of 3.51 ± 0.05 nm, an axis ratio of 2.64 ± 0.01, a Kuhn length of 17.29 ± 0.21 nm, and a length of 69.17 ± 0.47 nm. Hence, on increasing the concentration, it appears that the length increases, and there is a slight increase in the axis ratio, but the other characteristics are similar.
The data for the solvent-triggered gels fitted best to a Guinier–Porod model (Fig. 4d). Fits were attempted to a range of other models, including the cylinder, flexible cylinder, elliptical flexible cylinder, and hollow cylinder, all alone or in combination with a power law to fit the low Q data. However, none of these fits were found to be suitable. At 5 mg mL−1, the data fitted well to a model with a radius of gyration of 5.25 ± 0.06 nm, a Porod exponent of 4.33 ± 0.05, and a dimension variable of 1.36 ± 0.01. The dimension variable for a rod is 1, implying therefore that the scattering is from a relatively smooth surface formed by rods. At 10 mg mL−1, the data were very similar, with a radius of gyration of 5.14 ± 0.05 nm, a Porod exponent of 4.33 ± 0.04, and a dimension variable of 1.39 ± 0.01.
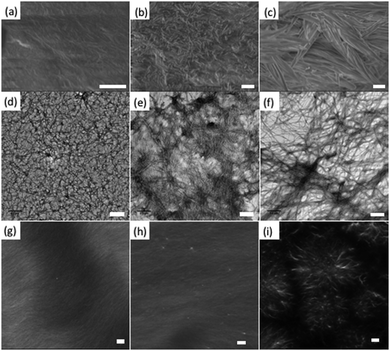
The differences in scattering data and best fit to these data correlate with microscopy. Scanning electron microscopy on dried gels implies that there are differences between the samples. The Ca-triggered gels, Fig. 5a, show a mat of fibres. The acid-triggered gels show a similar morphology, Fig. 5b. However, the solvent-triggered gels show a more crystalline morphology, and the structures are larger than those formed by the other methods, Fig. 5c. TEM data for all samples show a network of fibres as expected (Fig. 5d–f). The fibres in the Ca-triggered gels appear thinner, although it is difficult to deconvolute the effect of drying and the stain needed to image the structures. Drying artefacts are always a concern for such samples, especially where the gels contain two solvents with different volatility, as is the case for the solvent-triggered gels. As such, we also used confocal microscopy. We stained the structures with Nile Blue,46,47 as we have described elsewhere.48 Using this technique, the gels can be imaged wet, with no need for drying. Distinct differences in microstructure can now be seen. The Ca-triggered gels show a significant number of fibres (Fig. 5g), with an apparent tendency to align, which would agree with the data described above. The acid-triggered gels again show many thin fibres (Fig. 5h), but there now appears a more entangled network (it is not expected that the elliptical nature would be observable by this imaging method). Finally, the solvent-triggered gels show the presence of spherulitic domains (Fig. 5i). This correlates well with our previous data on gels formed by this method,26,27 where we showed that this morphology is the result of a phase separation event. The differences in microstructure also explain the differences in SANS scattering. Hence, as we have suggested previously,11,26 differences in gel properties are heavily affected by the gel microstructure as opposed to only differences in the fibres themselves.
Conclusions
Overall, it is clear that the rheological properties of the gels can be controlled by changing the method used to form the gels. The method of gelation affects the types of gel formed and the range of concentration over which gelation can occur. There are of course many other possible parameters including the temperature of gelation, as well as the absolute pH. Many low molecular weight hydrogelators have been described; generally a single method of gelation or a set of gelation conditions are described. We show here that significant variation is possible. Considering the difficulty in predicting which molecules will be gelators, if a particular set of mechanical properties is required, it is possibly easier to vary the gelation process for a known effective gelator than it would be to attempt to search for a gelator that gives gels with these properties from first principles.Experimental section
Experimental details on synthetic procedures for the preparation of the gels, and the various characterisation techniques can be found as ESI.†Acknowledgements
The Zeiss 880 microscope was purchased through the grant MR/M009114/1 and the Airyscan detector through the support of the University of Liverpool Technology Directorate. We thank the EPSRC for funding (DA holds an EPSRC Fellowship (EP/L021978/1), which also funds ED; CC was funded via EP/L014823/1). The experiment at the Institut Laue Langevin was allocated beam time under experiment number 9-11-1802 (DOI: 10.5291/ILL-DATA.9-11-1802). This work benefitted from the SasView software, originally developed by the DANSE project under NSF award DMR-0520547.Notes and references
- P. Terech and R. G. Weiss, Chem. Rev., 1997, 97, 3133–3160 CrossRef CAS PubMed.
- R. G. Weiss, J. Am. Chem. Soc., 2014, 136, 7519–7530 CrossRef CAS PubMed.
- L. A. Estroff and A. D. Hamilton, Chem. Rev., 2004, 104, 1201–1218 CrossRef CAS PubMed.
- B. O. Okesola, V. M. P. Vieira, D. J. Cornwell, N. K. Whitelaw and D. K. Smith, Soft Matter, 2015, 11, 4768–4787 RSC.
- X. Du, J. Zhou, J. Shi and B. Xu, Chem. Rev., 2015, 115, 13165–13307 CrossRef CAS PubMed.
- C. M. Rubert Pérez, N. Stephanopoulos, S. Sur, S. S. Lee, C. Newcomb and S. I. Stupp, Ann. Biomed. Eng., 2015, 43, 501–514 CrossRef PubMed.
- K. J. Skilling, F. Citossi, T. D. Bradshaw, M. Ashford, B. Kellam and M. Marlow, Soft Matter, 2014, 10, 237–256 RSC.
- S. S. Babu, V. K. Praveen and A. Ajayaghosh, Chem. Rev., 2014, 114, 1973–2129 CrossRef CAS PubMed.
- A. Ajayaghosh, V. K. Praveen and C. Vijayakumar, Chem. Soc. Rev., 2008, 37, 109–122 RSC.
- F. Tantakitti, J. Boekhoven, X. Wang, R. V. Kazantsev, T. Yu, J. Li, E. Zhuang, R. Zandi, J. H. Ortony, C. J. Newcomb, L. C. Palmer, G. S. Shekhawat, M. O. de la Cruz, G. C. Schatz and S. I. Stupp, Nat. Mater., 2016, 15, 469–476 CrossRef CAS PubMed.
- J. Raeburn, A. Zamith Cardoso and D. J. Adams, Chem. Soc. Rev., 2013, 42, 5143–5156 RSC.
- J. K. Gupta, D. J. Adams and N. G. Berry, Chem. Sci., 2016, 7, 4713–4719 RSC.
- P. W. J. M. Frederix, G. G. Scott, Y. M. Abul-Haija, D. Kalafatovic, C. G. Pappas, N. Javid, N. T. Hunt, R. V. Ulijn and T. Tuttle, Nat. Chem., 2015, 7, 30–37 CrossRef CAS PubMed.
- G. K. Veits, K. K. Carter, S. J. Cox and A. J. McNeil, J. Am. Chem. Soc., 2016, 138, 12228–12233 CrossRef CAS PubMed.
- M. A. Greenfield, J. R. Hoffman, M. Olvera de la Cruz and S. I. Stupp, Langmuir, 2010, 26, 3641–3647 CrossRef CAS PubMed.
- S. Fleming and R. V. Ulijn, Chem. Soc. Rev., 2014, 43, 8150–8177 RSC.
- A. Z. Cardoso, L. L. E. Mears, B. N. Cattoz, P. C. Griffiths, R. Schweins and D. J. Adams, Soft Matter, 2016, 12, 3612–3621 RSC.
- L. Chen, S. Revel, K. Morris, L. C. Serpell and D. J. Adams, Langmuir, 2010, 26, 13466–13471 CrossRef CAS PubMed.
- L. Chen, T. O. McDonald and D. J. Adams, RSC Adv., 2013, 3, 8714–8720 RSC.
- L. Chen, G. Pont, K. Morris, G. Lotze, A. Squires, L. C. Serpell and D. J. Adams, Chem. Commun., 2011, 47, 12071–12073 RSC.
- Y. Pocker and E. Green, J. Am. Chem. Soc., 1973, 95, 113–119 CrossRef CAS PubMed.
- L. Chen, K. Morris, A. Laybourn, D. Elias, M. R. Hicks, A. Rodger, L. Serpell and D. J. Adams, Langmuir, 2010, 26, 5232–5242 CrossRef CAS PubMed.
- D. J. Adams, M. F. Butler, W. J. Frith, M. Kirkland, L. Mullen and P. Sanderson, Soft Matter, 2009, 5, 1856–1862 RSC.
- A. Mahler, M. Reches, M. Rechter, S. Cohen and E. Gazit, Adv. Mater., 2006, 18, 1365–1370 CrossRef CAS.
- R. Orbach, L. Adler-Abramovich, S. Zigerson, I. Mironi-Harpaz, D. Seliktar and E. Gazit, Biomacromolecules, 2009, 10, 2646–2651 CrossRef CAS PubMed.
- L. Chen, J. Raeburn, S. Sutton, D. G. Spiller, J. Williams, J. S. Sharp, P. C. Griffiths, R. K. Heenan, S. M. King, A. Paul, S. Furzeland, D. Atkins and D. J. Adams, Soft Matter, 2011, 7, 9721–9727 RSC.
- J. Raeburn, G. Pont, L. Chen, Y. Cesbron, R. Levy and D. J. Adams, Soft Matter, 2012, 8, 1168–1174 RSC.
- R. Orbach, I. Mironi-Harpaz, L. Adler-Abramovich, E. Mossou, E. P. Mitchell, V. T. Forsyth, E. Gazit and D. Seliktar, Langmuir, 2012, 28, 2015–2022 CrossRef CAS PubMed.
- G. Fichman, T. Guterman, L. Adler-Abramovich and E. Gazit, CrystEngComm, 2015, 17, 8105–8112 RSC.
- N. A. Dudukovic and C. F. Zukoski, Soft Matter, 2015, 11, 7663–7673 RSC.
- C. Yan and D. J. Pochan, Chem. Soc. Rev., 2010, 39, 3528–3540 RSC.
- D. C. Morse, Macromolecules, 1998, 31, 7044–7067 CrossRef CAS.
- N. A. Dudukovic and C. F. Zukoski, Langmuir, 2014, 30, 4493–4500 CrossRef CAS PubMed.
- F. C. MacKintosh, J. Käs and P. A. Janmey, Phys. Rev. Lett., 1995, 75, 4425–4428 CrossRef CAS PubMed.
- P. A. Janmey, S. Hvidt, J. Lamb and T. P. Stossel, Nature, 1990, 345, 89–92 CrossRef CAS PubMed.
- B. Ozbas, K. Rajagopal, J. P. Schneider and D. J. Pochan, Phys. Rev. Lett., 2004, 93, 268106 CrossRef PubMed.
- C. Veerman, K. Rajagopal, C. S. Palla, D. J. Pochan, J. P. Schneider and E. M. Furst, Macromolecules, 2006, 39, 6608–6614 CrossRef CAS.
- P. Terech, N. M. Sangeetha and U. Maitra, J. Phys. Chem. B, 2006, 110, 15224–15233 CrossRef CAS PubMed.
- S. Boothroyd, A. Saiani and A. F. Miller, Biopolymers, 2014, 101, 669–680 CrossRef CAS PubMed.
- S. Boothroyd, A. F. Miller and A. Saiani, Faraday Discuss., 2013, 166, 195–207 RSC.
- M. C. Grant and W. B. Russel, Phys. Rev. E: Stat. Phys., Plasmas, Fluids, Relat. Interdiscip. Top., 1993, 47, 2606–2614 CrossRef CAS.
- W.-H. Shih, W. Y. Shih, S.-I. Kim, J. Liu and I. A. Aksay, Phys. Rev. A: At., Mol., Opt. Phys., 1990, 42, 4772–4779 CrossRef CAS.
- M. Wallace, D. J. Adams and J. A. Iggo, Soft Matter, 2013, 9, 5483–5491 RSC.
- J.-B. Guilbaud and A. Saiani, Chem. Soc. Rev., 2011, 40, 1200–1210 RSC.
- http://www.sasview.org/ .
- N. A. Dudukovic and C. F. Zukoski, J. Chem. Phys., 2014, 141, 164905 Search PubMed.
- C. Yang, L. Chu, Y. Zhang, Y. Shi, J. Liu, Q. Liu, S. Fan, Z. Yang, D. Ding, D. Kong and J. Liu, ACS Appl. Mater. Interfaces, 2015, 7, 2735–2744 CAS.
- J. Raeburn, L. Chen, S. Awhida, R. C. Deller, M. Vatish, M. I. Gibson and D. J. Adams, Soft Matter, 2015, 11, 3706–3713 RSC.
Footnote |
| † Electronic supplementary information (ESI) available. See DOI: 10.1039/c6sm02666d |
| This journal is © The Royal Society of Chemistry 2017 |

