Mixing effects of Cr2O3–PrBaMn2O5 for increased redox cycling properties of Fe powder for a solid-oxide Fe–air rechargeable battery
Hackho
Kim
a,
Shintaro
Ida
ab,
Young-Wan
Ju
c,
Junko
Matsuda
b,
Guntae
Kim
d and
Tatsumi
Ishihara
*ab
aDepartment of Applied Chemistry, Faculty of Engineering, Kyushu University, 744 Motooka, Nishi-ku, Fukuoka, 819-0395, Japan. E-mail: ishihara@cstf.kyushu-u.ac.jp
bInternational Institute for Carbon Neutral Energy Research (WPI-I2CNER), Kyushu University, 744 Motooka, Nishi-ku, Fukuoka 819-0395, Japan
cDepartment of Chemical Engineering, College of Engineering, Wonkwang University, 460 Iksandae-ro, Iksan, Jeonbuk 54538, Korea
dDepartment of Energy Engineering, Ulsan National Institute of Science and Technology (UNIST), Ulsan, 689-798, Korea
First published on 21st November 2016
Abstract
Large capacity rechargeable batteries are now strongly required for generating electric power from renewable energy, like solar cells or wind power generators. For this purpose, solid oxide Fe–air rechargeable batteries have been studied. In this study, for increasing the stability of the redox cycling properties of Fe powder at 623 K, mixing effects of Cr2O3 and PrBaMn2O5 catalysts were investigated and it was found that Fe powder mixed with 3 wt% Cr2O3–3 wt% PrBaMn2O5 showed excellent stability against redox cycling at 623 K. When Fe powder mixed with Cr2O3–PrBaMn2O5 was used, stable charge and discharge capacity could be achieved over 50 cycles by using the cell consisting of Ni–Fe/La0.9Sr0.1Ga0.8Mg0.2O3/Ba0.6La0.4CoO3. The discharge capacity of the cell achieved was larger than 770 mA h gFe−1 at 623 K. Increased capacity and cycle performance could be assigned to the deep redox degree of Fe powder.
Introduction
Electrical energy storage systems with large capacity and high safety are now strongly required for common renewable energy, for example, solar cells and wind power generators1,2 and also for smart grids. Therefore, development of new concepts for rechargeable batteries is now highly important. For this purpose, sodium–sulfur (Na–S) or redox flow batteries are considered as promising batteries because of their large capacity and high efficiency.3,4 However, the Na–S battery still has a disadvantage in terms of safety and the redox flow battery has a small energy density. Therefore, Huang et al. and our group reported an Fe–air rechargeable battery using reversible Solid Oxide Fuel Cell (SOFC),5–17 and then, various researchers also reported Fe–air rechargeable batteries using reversible SOFC.18–26 This new battery concept has many advantages compared to the conventional metal–air battery using a liquid electrolyte, although the operating temperature became higher. The advantages include, high cycling stability by using a redox mediator, low cost, use of non-toxic Fe, high safety, and large theoretical capacity density (1279.8 mA h gFe−1). The discharge of this Fe–air battery proceeds according to the following reactions:Air electrode:
| ½O2 + 2e− = O2− |
Fuel electrode:
| H2 + O2− = H2O + 2e− |
On Fe powder:
| 3Fe + 4H2O = Fe3O4 + 4H2 |
During discharge, oxygen is reduced to an oxide ion at the air electrode, and conducted through the oxide ion conductor. Then, the oxide ion reacts with H2 to form H2O. After the reaction, H2O reacts with Fe powder in the anode chamber, and then Fe oxide and hydrogen are formed during discharge. On the other hand, the charge process is the opposite, i.e., the following electrode reaction:
Air electrode:
| O2− = ½O2 + 2e− |
Fuel electrode:
| H2O + 2e− = H2 + O2− |
| Fe3O4 + 4H2 = 3Fe + 4H2O |
Total:
| Fe3O4 = 3Fe + 2O2 |
During the charge step, H2O is electrolyzed at the fuel electrode to generate hydrogen. The formed hydrogen is used to reduce Fe3O4 to metallic Fe. Therefore, for this battery, H2/H2O works as a redox mediator and so high cycling stability is expected from this metal–air battery because there is no shape change in the metallic electrode.
In the previous study, we investigated the catalyst used for Fe oxidation and reduction, and it was found that Fe oxidation can proceed at much lower temperatures by mixing Ce0.6Mn0.3Fe0.1O2 (CMF) and we demonstrated that a capacity of 600 mA h gFe−1 as well as reasonable cycling stability can be achieved at 673 K by using Fe powder mixed with CMF.13 However, an operating temperature of 673 K is still high considering this is for energy storage and at least, operation around 623 K like the NaS battery is required. However, with decreasing operating temperature, the oxidation degree of Fe powder also decreases and the discharge capacity decreases to be only 47% of the theoretical one. In this study, we investigated various catalysts for preventing particle growth and increasing the oxidation and reduction rate of Fe powder and it was found that modifying Fe powder with an oxygen activated catalyst is useful for increasing the oxidation degree and cycling performance of Fe powder resulting in an increased capacity of a solid state Fe–air rechargeable battery.
Experimental
Preparation of Fe2O3 powders
Iron oxide was prepared by the decomposition of Fe(NO3)3·9H2O (Kishida Chemical Co., Ltd., Japan) at 523 K in air. For the modification, Cr2O3, Fe(NO3)3·9H2O (Kishida Chemical Co., Ltd., Japan) and Cr(NO3)3·9H2O (Kishida Chemical Co., Ltd., Japan) were dissolved in deionized water and then dried under stirring on a heating plate. The obtained precursor powder was dried at 673 K for 2 h and calcined in air at 873 K for 6 h. Ce0.6Mn0.3Fe0.1O2 (CMF) powder was also prepared by a solid state reaction method using an aqueous solution of Ce(NO3)3·6H2O (Kishida Chemical Co., Ltd., Japan), Mn(NO3)3·6H2O (Kishida Chemical Co., Ltd., Japan), and Fe(NO3)3·9H2O (Kishida Chemical Co., Ltd., Japan). The obtained precursor powder was calcined in air at 1473 K. PrBaMn2O5 (PBMO) was prepared by the Pechini method using a mixed aqueous solution of Pr(NO3)3·6H2O (Kishida Chemical Co., Ltd., Japan), Ba(NO3)3 (Kishida Chemical Co., Ltd., Japan), and Mn(NO3)3·9H2O (Kishida Chemical Co., Ltd., Japan). The obtained precursor powder was calcined at 1473 K in air, and the obtained powder was reduced in humidified H2 at 1073 K. Ce0.8Sm0.2O2 (SDC) powder was used as a commercial powder (SDC20, Daiichi Kigenso Kagaku Kogyo Co. Ltd., Japan) without further purification. Fe2O3 powder or Fe2O3 + Cr2O3 powder was mixed with each of the prepared oxide powders separately, with a planetary ball-milling mixer (400 rpm for 2 h) in ethanol followed by drying at ca. 373 K.Redox measurements of modified Fe2O3 powders
The reduction/oxidation properties of the prepared Fe2O3 powders, by 100% H2/3 vol% H2O–N2 (100 ml min−1), were measured with TG-DTA (Setaran Setsys Evolution). 20 mg of the Fe2O3 based powders was used for the TG-DTA measurement. The temperature was increased from room temperature to 623 K at 20 K min−1 under Ar flow (100 ml min−1). Then, the redox properties of the powders were measured at 623 K and Fe2O3 was reduced with a H2 flow at 100 ml min−1 for 5 h to Fe in the first cycle. Subsequently, Fe powder was oxidized to Fe3O4 in the first oxidation with 3 vol% H2O–N2 at 100 ml min−1 for 5 h. After the first redox cycle, the weight change of Fe powder was in good agreement with that between Fe and Fe3O4. In this study, the degree of oxidation was defined as follows: degree of oxidation = (actual weight change)/(theoretical weight change between Fe and Fe2O3).Charge–discharge measurement of an Fe–air battery
A tubular type electrolyte supported cell was prepared for a solid state Fe–air rechargeable battery. Fig. 1 shows the solid state Fe–air rechargeable cell used in this study. An La0.9Sr0.1Ga0.8Mg0.2O3 (LSGM) tube (1 mm thickness, 13 mm diameter, 9.7 mm length, and 12.9 ml volume prepared by NGK SPARK PLUG Co., Ltd.) was used for the preparation of a tubular Fe–air cell and coated with NiO–Fe2O3 (Ni![[thin space (1/6-em)]](https://www.rsc.org/images/entities/char_2009.gif) :
:![[thin space (1/6-em)]](https://www.rsc.org/images/entities/char_2009.gif) Fe = 9
Fe = 9![[thin space (1/6-em)]](https://www.rsc.org/images/entities/char_2009.gif) :
:![[thin space (1/6-em)]](https://www.rsc.org/images/entities/char_2009.gif) 1) powder and Ba0.6La0.4CoO3 powder on the inside and outside of the LSGM tube as the anode and cathode, respectively, by a slurry coating method. The effective electrode area was ca. 10 cm2. NiO–Fe2O3 powder was synthesized by the impregnation of Fe(NO3)3·9H2O (Kishida Chemical Co., Ltd., Japan) onto NiO powder (Wako Pure Chemical Industries, Ltd., Japan) in aqueous solution. The obtained powder was calcined in air at 1073 K to decompose the nitrate acid. Ba0.6La0.4CoO3 (BLC) was prepared by a solid state reaction method using BaCO3 (Rare Metallic Co., Ltd., Japan), La2O3 (Kishida Chemical Co., Ltd., Japan), and Co3O4 (Kojundo Chemical Laboratory Co., Ltd., Japan). The tube coated with electrode precursors was calcined at 1373 K for 30 min.
1) powder and Ba0.6La0.4CoO3 powder on the inside and outside of the LSGM tube as the anode and cathode, respectively, by a slurry coating method. The effective electrode area was ca. 10 cm2. NiO–Fe2O3 powder was synthesized by the impregnation of Fe(NO3)3·9H2O (Kishida Chemical Co., Ltd., Japan) onto NiO powder (Wako Pure Chemical Industries, Ltd., Japan) in aqueous solution. The obtained powder was calcined in air at 1073 K to decompose the nitrate acid. Ba0.6La0.4CoO3 (BLC) was prepared by a solid state reaction method using BaCO3 (Rare Metallic Co., Ltd., Japan), La2O3 (Kishida Chemical Co., Ltd., Japan), and Co3O4 (Kojundo Chemical Laboratory Co., Ltd., Japan). The tube coated with electrode precursors was calcined at 1373 K for 30 min.
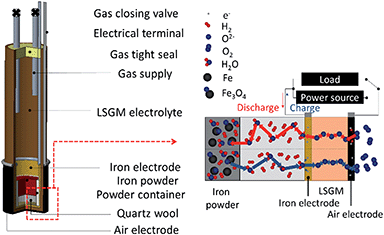 | ||
| Fig. 1 Schematic illustration of a tubular type electrolyte supported cell, prepared for a solid state Fe–air rechargeable battery. | ||
A Pt mesh and Pt wire were applied as a current corrector and lead wire, respectively. Fe oxide powder (15 mg) was set into a small alumina tube and then set into the anode chamber of the LSGM tube, and the LSGM tube was then closed by epoxy resin with stainless steel gas inlet and outlet lines for reducing both the anode and Fe2O3 powder. After the cell temperature became stable at 623 K, 100 ml min−1 of H2 was first fed into the anode side at 100 ml min−1 for 5 h and then changed to a gaseous mixture of 87.3% N2, 9.7% H2, and 3% H2O for 0.5 h followed by closing with 2 way stop valves set at inlet and outlet gas lines. After the open circuit potential became stable, charge and discharge properties were measured by applying a constant current of 0.4 mA (40 μA cm−2) using a two-probe method. Impedance analysis was performed by using a Solartron 1260/1287 impedance analyser under open-circuit conditions and the measurements were performed in the frequency range of 0.01–100 kHz with an AC amplitude of 30 mV. The shape of Fe powder particles was observed by scanning electron microscopy (SEM, Keyence VE-7800) without any coating. Efficiency in this study is defined as energy efficiency: {(capacity) × (potential) at charge}/{(capacity) × (potential) at discharge}.
Results and discussion
Effects of catalyst for redox stability of Fe2O3
In our previous study, redox properties of Fe powder were investigated and it was found that the oxidation degree of Fe powder with 5 wt% Ce0.6Mn0.3Fe0.1O2 (CMF) was 60% of the theoretical weight change from Fe to Fe3O4 at 673 K.13 This shows the oxidation degree of this Fe is 3 times larger than that of pure Fe. However, the oxidation degree of Fe powder with 5 wt% CMF catalyst decreased with the cycle number and after 10 redox cycles at 673 K, the change in weight by oxidation decreased to 40% of the theoretical one. This decrease in degree of oxidation can be assigned to sintering of the Fe powder and also the formation of a dense surface layer on the Fe particles. Therefore, for an increased cycling stability of the Fe–air battery, increase in the redox stability of the Fe powder is an essential requirement in addition to the improved stability of the reversible solid oxide cell.Fig. 2 shows the weight change of the Fe2O3 powder with and without addition of 3 wt% Cr2O3 in the redox cycling measurements at 623 K. The measurement started from the reduction of Fe2O3, namely the charge step. Therefore, 100% in the Y axis of Fig. 2 corresponds to the weight change from Fe2O3 to Fe. As shown in Fig. 2, in the case of pure Fe2O3, the degree of oxidation was quickly decreased to 40.0% in the first oxidation step, but the degree of oxidation was sustained at 40% over 10 cycles, although a slight decrease in redox performance was observed after 8 cycles. In contrast, as already reported by Otsuka et al.,27 the degree of oxidation was increased to 87.5% in the initial cycle by addition of Cr2O3. However, the oxidation rate decreased in the 2nd oxidation step and the degree of oxidation also decreased in the 5th oxidation step to be 73% after 10 cycles. Therefore, stability as well as degree of oxidation were increased considerably by the addition of Cr2O3, further increase in the redox stability is required.
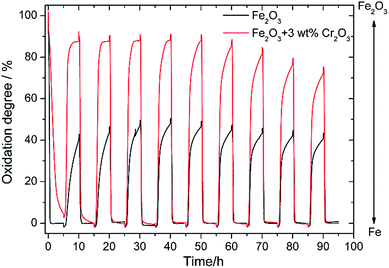 | ||
| Fig. 2 Redox cycling properties of pure Fe2O3 powder and the Fe2O3 powder with 3 wt% Cr2O3 catalyst at 623 K. | ||
SEM images of Fe2O3 powders before and after 10 redox cycles at 623 K are shown in Fig. 3. The particle size of the Fe2O3 powders was a few tens of nanometers before the redox cycle measurements. However, during the redox cycles, the Fe powder easily aggregated, and the particle size grew to be a few hundreds of micrometers. Therefore, it seems that the aggregation of Fe powder easily occurred, resulting in the decreased degree of oxidation of Fe. This aggregation of Fe/Fe3O4 powder seemed to have occurred during the reduction step. On the other hand, the particle size of the Fe2O3 powder added with 3 wt% Cr2O3 is smaller than that of pure Fe2O3 powder. However, it was observed that the particle size of Fe2O3 powder also increased in spite of the 3 wt% Cr2O3 addition.
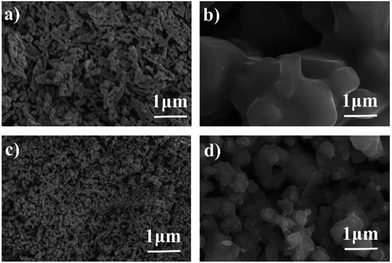 | ||
| Fig. 3 SEM images of the Fe2O3 powder (a) before and (b) after 10 redox cycles and the Fe2O3 powder with 3 wt% Cr2O3 (c) before and (d) after 10 redox cycles. | ||
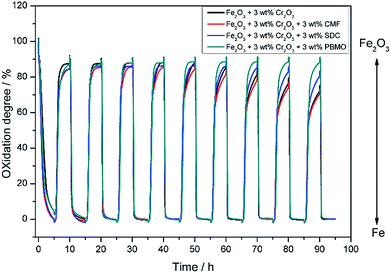
The effects of co-addition of oxide with Cr2O3 for Fe2O3 were studied for further increasing the redox stability and degree of oxidation of Fe. Mixed ionic–electronic conductors (MIECs) Sm0.2Ce0.8O2 (SDC), PrBaMn2O5 (PBMO) and Ce0.6Mn0.3Fe0.1O2 (CMF) were examined in this study.13,28,29Fig. 4 shows the weight change of Fe2O3 powder with 3 wt% Cr2O3 simultaneously mixed with various mixed conducting oxides, under redox cycling conditions at 623 K. The stability as well as the degree of oxidation of the Fe powder were significantly changed by mixing with the MIEC. Fe2O3 powder added with 3 wt% Cr2O3 and 3 wt% CMF shows almost the same degree of oxidation as Fe2O3 added with 3 wt% Cr2O3, however, obviously, the oxidation rate became much faster. This may suggest that CMF could accelerate steam dissociation and provide an activated oxygen for Fe resulting in the increased oxidation rate of Fe at 673 K.13 On the other hand, the degree of oxidation of Fe was increased by mixing with SDC or PBMO. Among the examined MIECs, obviously, Fe2O3 powder loaded with Cr2O3 and mixed with PBMO shows the largest weight change, 88%, which almost corresponded to the weight change from Fe to Fe2O3, and almost no decline in the weight change was observed over 10 redox cycles. It is reported that a layered double perovskite oxide of PBMO exhibits excellent electronic conductivity and fast oxygen reduction kinetics.28 Therefore it is considered that PBMO catalyses the reduction and/or oxidation of Fe/Fe3O4 resulting in the superior redox rate. In addition, PBMO seems to be stable against aggregation because of the oxide phase and this is also effective for preventing Fe aggregation. Therefore, reduced Fe2O3 powder added with 3 wt% Cr2O3 mixed with 3 wt% PBMO has a large degree of oxidation as well as stable redox cycles.
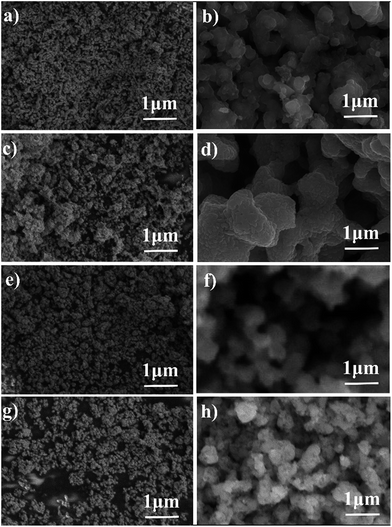
Fig. 5 shows SEM images of the Fe2O3 powder added with Cr2O3 and MIEC before and after 10 redox cycles at 623 K. As discussed, the particle size of the Fe oxides added with Cr2O3 was a few tens of nanometers before the redox cycling, however, after 10 cycles, the particle size was increased to be a few hundreds of nanometers. However, obviously, the small particle size of Fe was sustained by adding Cr2O3 and PBMO. Therefore, the stable redox properties of Fe achieved by mixing with PBMO are associated with the prevention of particle growth. The oxidation rate constant of the Fe powder was estimated by assuming the first reaction order at different temperatures and Fig. 6 shows Arrhenius plots of the estimated rate constant of reduced Fe2O3 powder with and without a catalyst. Obviously, a linear relationship was observed in the Arrhenius plots shown in Fig. 6 for all samples and the activation energy for the re-oxidation of the Fe powder with steam can be estimated. As shown in Fig. 6, the activation energy of pure Fe was 62.0 kJ mol−1. A similar activation energy (77.9 kJ mol−1) for pure Fe was also reported by Kim et al.30 The estimated activation energy decreased to 21.5 kJ mol−1 by mixing with Cr2O3 and further decreased to 9.5 kJ mol−1 with Cr2O3 + PBMO. Therefore, it is reasonable to consider that the mixture of Cr2O3 and PBMO catalysed the oxidation of the Fe powder, resulting in the increased oxidation rate. In particular, a small activation energy was achieved by mixing with PBMO because it is reported that PBMO is an active catalyst for electrochemical oxidation reactions.28 Because of the small activation energy, a high re-oxidation rate with H2O can be sustained at a decreased temperature by modifying with Cr2O3 + PBMO. At present, a detailed mechanism of the PBMO catalyst on Fe redox is still not clear, however, it seems that PBMO is active for the dissociation of H2O into H2 and O2−, which reacts with Fe to form Fe3O4 in the discharge step, and the dissociation of Fe3O4 into Fe and O2−, which reacts with H2 to form H2O in the charge step. A detailed mechanism of PBMO catalysis in Fe/Fe3O4 redox is now under investigation. Fig. 7 shows the redox cycling stability of the Fe2O3 powder modified with 3 wt% Cr2O3 and 3 wt% PBMO at 673 K. In this experiment, the reduction period was changed from 5 to 1 h. Under these conditions, it is obvious that a stable oxidation degree of 88% was sustained over 30 cycles.
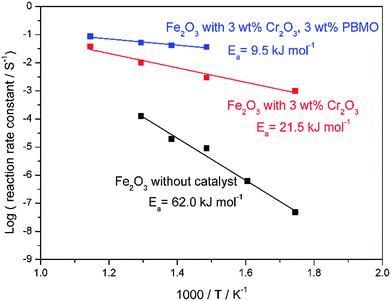 | ||
| Fig. 6 Arrhenius plots showing the reaction rate constant for oxidation of reduced pure Fe2O3,Fe2O3 + 3 wt% Cr2O3, and Fe2O3 + 3 wt% Cr2O3 + 3 wt% PrBaMn2O5. | ||
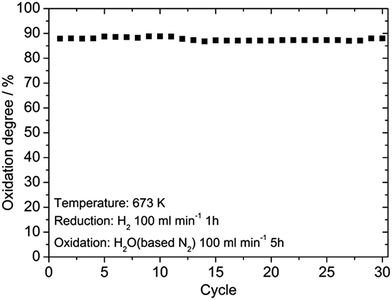 | ||
| Fig. 7 Oxidation degree of the Fe2O3 powder with 3 wt% Cr2O3 + 3 wt% PrBaMn2O5 catalyst for 30 cycles at 673 K estimated with TG. | ||
The particle size of Fe2O3 with 3 wt% Cr2O3 and 3 wt% PBMO was a few tens of nanometers before the measurement (Fig. 8(a)). And the Fe powder was aggregated, and the particle size grew to be a few hundreds of nanometers (Fig. 8(b)). The size of the Fe powder tends to remain small when compared to that of pure Fe3O4 powder. Therefore, mixing Cr2O3 and PBMO with Fe3O4 not only provides a fast redox rate but also cycling stability, and seems to be highly useful for increasing the degree of oxidation, namely, the discharge capacity and cycling stability of solid state Fe–air batteries.
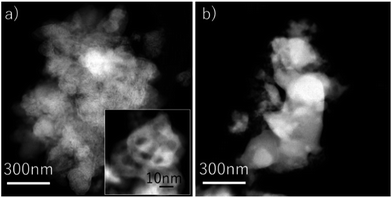 | ||
| Fig. 8 TEM images of the Fe2O3 powder with 3 wt% Cr2O3 + 3 wt% PrBaMn2O5 (a) before the redox test; (b) after the 30th reduction at 623 K. | ||
Fe–air battery performance using PBMO modified Fe
Fig. 9 shows the charge and discharge properties of the solid state Fe–air battery using pure Fe2O3 and Fe2O3 powder modified with 3 wt% Cr2O3 and 3 wt% PBMO. Since reversible redox cycling was only achieved at 773 K, the operating temperature of the cell using pure Fe is set to 773 K. As shown in Fig. 9(a), when pure Fe was used, the discharge capacity is only 700 mA h gFe−1 at 0.6 V in the second cycle, however, the discharge capacity significantly decreased with the cycle number. This low cycle performance was explained by the poor redox cycling properties of Fe2O3 powder. Fig. 9(b) shows the discharge and charge properties of the cell using Fe2O3 powder mixed with 3 wt% Cr2O3 and 3 wt% PrBaMn2O5 at 623 K. In contrast to the cell using pure Fe2O3, the cell shows large discharge capacity (800 mA h gFe−1) and high discharge potential (ca. 0.8 V) even at 673 K. In addition, the discharge capacity of 800 mA h gFe−1 was sustained for up to 20 cycles. Since the theoretical discharge capacity was 1279.8 mA h gFe−1, assuming redox between Fe3O4 and Fe, this cut-off capacity of 800 mA h gFe−1 corresponded to 62.5% of the degree of oxidation. After 20 cycles, the discharge capacity slightly decreased. However, up to 40 cycles, a discharge capacity of 770 mA h gFe−1 was sustained. This superior cycling stability can be explained by the increased cycling stability and degree of oxidation of the reduced Fe2O3 powder by addition of Cr2O3 and PBMO.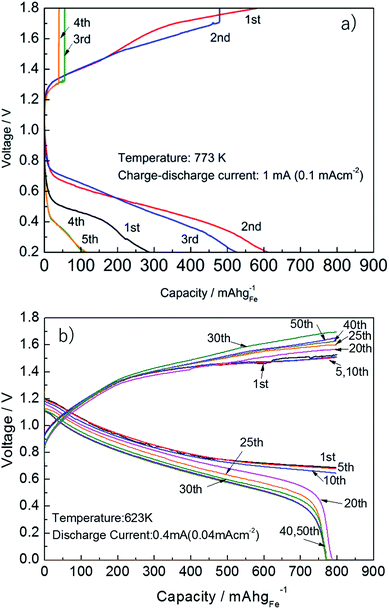 | ||
| Fig. 9 Charge–discharge curves of an Fe–air rechargeable battery using (a) pure Fe at 773 K and (b) Fe + 3 wt% Cr2O3 and 3 wt% PrBaMn2O5 at 623 K. | ||
Fig. 10 shows the energy density of the cell for charge and discharge, and the round trip energy efficiency (charge/discharge efficiency) of the solid state Fe–air rechargeable battery using Cr2O3 and PBMO modified Fe2O3 powder. Obviously, the discharge capacity as well as the round trip efficiency slightly decreased with an increase in the cycle number and at 17 cycles, the discharge energy density was 650 W h kgFe−1 and this was caused by a decreased discharge potential as shown in Fig. 9(b). It is seen that the discharge energy density significantly decreased from the 17th to the 22nd cycle in spite of a small decrease in the discharge capacity. However, an energy density of 500 W h kgFe was sustained for up to 50 cycles. Therefore, by increasing the redox cycling stability of the Fe2O3 powder used for the solid state Fe–air rechargeable battery, a larger capacity and also more stable discharge cycles were achieved at a decreased temperature.
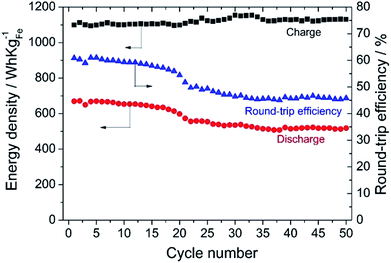 | ||
| Fig. 10 Energy density and round-trip efficiency of the solid state Fe–air battery using Fe2O3 + 3 wt% Cr2O3 and 3 wt% PrBaMn2O5. | ||
Fig. 11 shows the impedance plots of the Fe–air rechargeable battery using modified powder operated at 623 K at different cycles. It is roughly said that impedance plots consist of two semicircles, one is a semicircle in a higher frequency region and the second is a lower frequency one. Considering the frequency, the first semicircle was assigned to the activation overpotential and the second one is the diffusion resistance. As the cycle number increased, the open Warburg resistance was slightly increased. However, the IR resistance, which can be estimated by the X-axis intercept of the impedance arc at high frequency, did not increase suggesting that the increase in IR loss was not the main reason for the decreased discharge capacity and so the decreased capacity with cycle number can be explained by increased diffusion resistance. This increased diffusion resistance may suggest that the hydrogen formation rate may be decreased with cycle number and so the decrease in the energy density of the Fe–air battery could be assigned to the decreased oxidation rate and the degree of oxidation of Fe powder inside of the fuel chamber of the Fe–air battery. Therefore, the change in the discharge curves was explained by the decline of the oxidation rate of Fe powder but not cell performance. On the other hand, the charge step involved the reduction of Fe3O4 by H2 formed by electrolysis of steam and did not significantly decrease in rate. This was also observed in the redox cycling curves as shown in Fig. 4. Namely, oxidation became slower (change from 0 to 100%) with increasing cycle number but reduction (from 100 to 0%) always quickly occurred for all cycles. Therefore, the discharge properties of the cell degraded more significantly with the cycle number because of the limiting current.
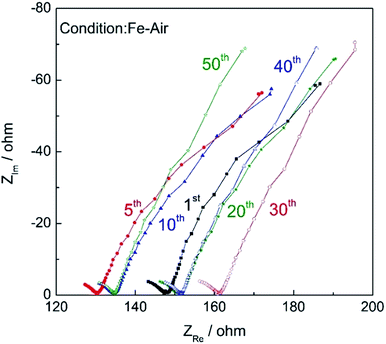 | ||
| Fig. 11 Impedance plots of the Fe–air rechargeable battery after charge (amplitude: 30 mV, 0.01 Hz to 100 kHz). | ||
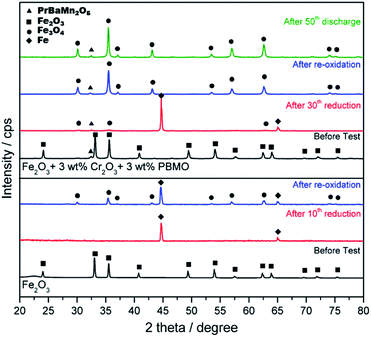
Fig. 12 shows XRD patterns of pure Fe2O3 and Fe2O3 powder added with Cr2O3 and PBMO before and after redox measurements and also after charge/discharge measurements. In the case of re-oxidised pure Fe, some Fe still remained after oxidation suggesting that not all Fe contributed to the formation of H2O. The Fe2O3 powder with Cr2O3 and PBMO was Fe2O3 before measurement. However, after the 30th charge cycle, the main phase of the powder was a metallic one. However, from the XRD measurements, the sample still contained a small amount of Fe3O4 after charge. Therefore, the decrease in discharge capacity may be caused by the decreased reducibility of the Fe powder and this could be explained by the centre part of enlarged Fe particles not being able to reduce because of a slow diffusion of oxygen. In the case of added Cr2O3, after cycle measurements, X-ray diffraction peaks from the Fe2−XCrXO4 spinal phase were recognized. However, as shown in Fig. 12, when Cr2O3 was mixed with PBMO, the diffraction patterns were assigned to Cr2O3 and PBMO. Therefore, it is interesting that by mixing Fe2O3 with PBMO and Cr2O3, the reaction between Fe2O3 and Cr2O3 is prevented. It is also noted that the stability of PBMO is high and the decomposition of PBMO is hardly observed.
In order to estimate the change in particle size, TEM analysis was performed after cycle measurements. Fig. 13(a) shows TEM images of the Fe2O3 powder modified with Cr2O3 and PBMO after the 50th redox cycle. It was found that the small particle size of Fe2O3 was sustained and Cr2O3 was distributed over the Fe2O3 powder. Fig. 13(b) shows TEM images of the Fe2O3 powder with Cr2O3 and PBMO after charge–discharge cycles. The Fe2O3 powder after charge–discharge cycling had almost the same size and also the uniform distribution of Cr2O3 was confirmed. Therefore, the TEM observation also suggests that the stable redox properties of Fe powder can be ascribed to the small particle size sustained by the Cr2O3–PBMO mixture during the redox process.
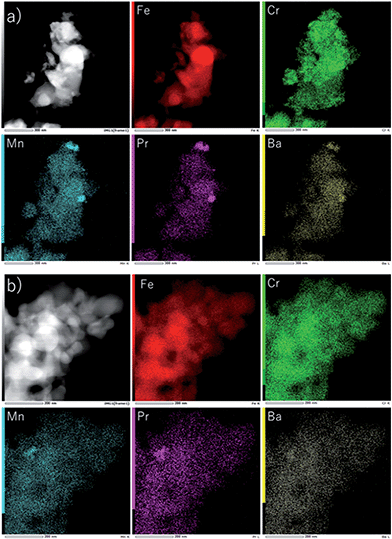 | ||
| Fig. 13 TEM and X-ray images of Fe2O3 with 3 wt% Cr2O3 and 3 wt% PrBaMn2O5 (a) after 30 redox cycles and (b) after the 50th charge–discharge cycle. | ||
Conclusion
The influence of a catalyst mixed with Fe2O3 powder on the degree of oxidation and redox cycling stability at 623 K was studied for low temperature operation of an Fe–air battery. When pure Fe2O3 powder was used, the smallest degree of oxidation (just 40%) was observed. However, mixing 3 wt% Cr2O3 with Fe3O4 showed an increased redox cycling stability at 623 K and this could be explained by preventing the particle growth of Fe powder by the formation of Fe–Cr oxide. In addition, this study revealed that simultaneous addition of 3 wt% Cr2O3 and 3 wt% PBMO to Fe oxide powder resulted in high catalytic activity for redox cycles at 623 K. Since the apparent activation energy of Fe powder against re-oxidation was significantly decreased, mixing PBMO and Cr2O3 seems to work as a catalyst for Fe redox. When Fe2O3 powder mixed with 3 wt% Cr2O3 and 3 wt% PBMO was combined with a highly reversible solid oxide cell, a large discharge capacity as well as cycling stability was achieved at 673 K over 50 cycles. A discharge capacity higher than 770 mA h gFe−1 was achieved after 50 cycles and the round-trip efficiency was higher than 45% at 623 K. Impedance measurements suggest that the decrease in discharge potential and capacity was attributed to the increased diffusion resistance and so by increasing the cycling stability of Fe2O3 powder, the discharge capacity as well as cycling stability and rate properties of the solid state Fe–air rechargeable battery could be significantly improved. In this study, the current density is not high because an electrolyte support cell with 1 mm thickness was used. However, since we can confirm the increased redox properties of Fe powder at 623 K, it is expected that the current density could be increased by using an anode supported LSGM film cell. This is now under investigation and the results will be reported in the future.Acknowledgements
The tubular LSGM electrolytes were supplied by NGK SPARK PLUG CO., LTD and part of this work was financially supported by the “Next Generation SOFC development” from the New Industrial Energy Development Organization (NEDO), Japan.Notes and references
- Z. Yang, J. Zhang, M. C. Kintner-Meyer, X. Lu, D. Choi, J. P. Lemmon and J. Liu, Chem. Rev., 2011, 111, 3577–3613 CrossRef CAS PubMed.
- B. Dunn, H. Kamath and J.-M. Tarascon, Science, 2011, 334, 928–935 CrossRef CAS PubMed.
- K. B. Hueso, M. Armand and T. Rojo, Energy Environ. Sci., 2013, 6, 734–749 CAS.
- R. D. McKerracher, C. Ponce de Leon, R. G. A. Wills, A. A. Shah and F. C. Walsh, ChemPlusChem, 2015, 80, 323–335 CrossRef CAS.
- A. Inoishi, S. Ida, S. Uratani, T. Okano and T. Ishihara, Phys. Chem. Chem. Phys., 2012, 14, 12818–12822 RSC.
- A. Inoishi, S. Ida, S. Uratani, T. Okano and T. Ishihara, RSC Adv., 2013, 3, 3024–3030 RSC.
- A. Inoishi, Y. W. Ju, S. Ida and T. Ishihara, J. Power Sources, 2013, 229, 12–15 CrossRef CAS.
- A. Inoishi, Y. Okamoto, Y. W. Ju, S. Ida and T. Ishihara, RSC Adv., 2013, 3, 8820–8825 RSC.
- A. Inoishi, Y. W. Ju, S. Ida and T. Ishihara, Chem. Commun., 2013, 49, 4691–4693 RSC.
- A. Inoishi, T. Sakai, Y. W. Ju, S. Ida and T. Ishihara, J. Mater. Chem. A, 2013, 1, 15212–15215 CAS.
- A. Inoishi, T. Sakai, Y. W. Ju, S. Ida and T. Ishihara, J. Power Sources, 2014, 262, 310–315 CrossRef CAS.
- A. Inoishi, J. Hyodo, H. Kim, T. Sakai, S. Ida and T. Ishihara, J. Mater. Chem. A, 2015, 3, 8260–8264 CAS.
- H. Kim, A. Inoishi, S. Ida and T. Ishihara, J. Mater. Chem. A, 2016, 4, 5482–5488 CAS.
- X. Zhao, N. Xu, X. Li, T. Gong and K. Huang, RSC Adv., 2012, 2, 10163–10166 RSC.
- X. Zhao, X. Li, Y. Gong, N. Xu, K. Romito and K. Huang, Chem. Commun., 2013, 49, 5357–5359 RSC.
- X. Zhao, Y. Gong, X. Li, N. Xu and K. Huang, J. Mater. Chem. A, 2013, 1, 14858–14861 CAS.
- X. Zhao, X. Li, Y. Gong and K. Huang, Chem. Commun., 2014, 50, 623–625 RSC.
- H. Landes and A. Zampieri, World Patent, WO 2011/070006 A1, 2011.
- W. Drenckhahn, H. Landes, S. D. Vora, W. Menapace and N. Vortmeyer, World Patent, WO 2012/069455 A1, 2012.
- H. Landes and R. Reichenbacher, ECS Trans., 2013, 50(25), 47 CrossRef.
- W. Drenckhahn, M. Kuhne, T. Soller, K. Litzinger, J. Shull, A. Iyengar, H. Greiner, H. Landes, A. Leonide and C. Schuh, ECS Trans., 2013, 50(45), 125 CrossRef.
- A. Leonide, W. Drenckhahn, H. Greiner and H. Landes, J. Electrochem. Soc., 2014, 161(9), A1297–A1301 CrossRef CAS.
- N. H. Menzler, A. Hospach, L. Niewolak, M. Bram, O. Tokariev, C. Berger, P. Orzessek, W. J. Quadakkers, Q. Fang and H. P. Buchkremer, ECS Trans., 2013, 57(1), 255 CrossRef.
- L. Niewolak, J. Zurek, N. H. Menzler, D. Grüner and W. J. Quadakkers, Mater. High Temp., 2015, 32(1–2), 81–91 CrossRef CAS.
- C. M. Berger, O. Tokariev, P. Orzessek, A. Hospach, Q. Fang, M. Bram, W. J. Quadakkers, N. H. Menzler and H. P. Buchkremer, Journal of Energy Storage, 2015, 1, 54–64 CrossRef.
- H. Ohmori, H. Iwai, K. Itakura, M. Saito and H. Yoshida, J. Power Sources, 2016, 309, 160–168 CrossRef CAS.
- K. Otsuka, T. Kaburagi, C. Yamada and S. Takenaka, J. Power Sources, 2003, 122, 111–121 CrossRef CAS.
- S. Sengodan, S. Choi, A. Jun, T. Shin, Y. W. Ju, H. Y. Jeong, J. Shin, J. T. S. Irvine and G. Kim, Nat. Mater., 2015, 14, 205–209 CrossRef CAS PubMed.
- T. Hibino, A. Hashimoto, T. Inoue, J. I. Tokuno, S. I. Yoshida and M. Sano, Science, 2000, 288, 2031–2033 CrossRef CAS PubMed.
- K. S. Go, S. R. Son and S. D. Kim, Int. J. Hydrogen Energy, 2008, 33, 5986–5995 CrossRef CAS.
| This journal is © The Royal Society of Chemistry 2017 |

