Combinatorial screening of Pd-based quaternary electrocatalysts for oxygen reduction reaction in alkaline media†
Jinyang
Li
ab,
Helge S.
Stein
 c,
Kirill
Sliozberg
d,
Jingbei
Liu
be,
Yanhui
Liu
be,
Genevieve
Sertic
a,
Ellen
Scanley
fg,
Alfred
Ludwig
ch,
Jan
Schroers
be,
Wolfgang
Schuhmann
 dh and
André D.
Taylor
*ab
aDepartment of Chemical and Environmental Engineering, Yale University, 9 Hillhouse Avenue, New Haven, CT, USA. E-mail: andre.taylor@yale.edu
bCenter for Research on Interface Structures and Phenomena, Yale University, New Haven, Connecticut, USA 06520
cInstitute for Materials, Ruhr-Universität Bochum, Universitätsstraße 150, D-44780 Bochum, Germany
dAnalytical Chemistry – Center for Electrochemical Sciences (CES), Ruhr-Universität Bochum, Universitätsstraße 150, D-44780 Bochum, Germany
eDepartment of Mechanical Engineering and Materials Science, Yale University, New Haven, Connecticut, USA 06520
fDepartment of Physics, Southern Connecticut State University (SCSU), 501 Crescent St., New Haven, CT 06515, USA
gConnecticut State Colleges and Universities Center for Nanotechnology (ConnSCU-CNT), SCSU, New Haven, CT 06515, USA
hMaterials Research Department, Ruhr-Universität Bochum, Universitätsstraße 150, D-44780 Bochum, Germany
First published on 17th November 2016
Abstract
The implementation of electrochemical systems such as fuel cells has been hindered by the slow development of low cost high activity catalysts. Here we examine the oxygen reduction reaction performance of a combinatorial Pd–Au–Ag–Ti thin film library using high-throughput screening and correlate the electrochemical behavior to the crystallographic properties. We find compositions of ca. 40–60 at% Pd and 30–35 at% Au exhibit both a low overpotential of close to the value of pure Pt as well as high current density. We also observe a volcano-like relationship between the overpotential and the solid formation strain. This study provides compositional guidance towards the future synthesis of nanostructured quaternary Pd–Au–Ag–Ti alloys and suggests the potential for broader application of high-throughput electrochemical characterization by means of an automatic scanning droplet cell.
Introduction
Fuel cells, highly efficient low/zero emission energy conversion devices, have been extensively investigated in recent decades due to high-energy demands, fossil fuel depletions, and environmental challenges throughout the world.1,2 In particular, alkaline fuel cells (AFCs) have received significant attention due to their advantages over traditional proton exchange membrane fuel cells (PEMFCs) by providing faster oxygen reduction reaction (ORR) kinetics in a less corrosive catalyst environment (vs. acidic media).3–13 Given the fact that the ORR is the key reaction at the cathode of a fuel cell, there have been considerable efforts to develop newer alkaline ORR electrocatalysts. In general, volcano-like plots are used to assist the design of newer materials for many electrochemical systems, among which the catalytic activity for mono- or bimetallic systems are correlated to the binding energies, the d-band center position, or the atomic coordination.14,15Previously, Nørskov et al. showed a volcano plot of the ORR activity of several binary metal surfaces versus the oxygen or OH binding energies and suggested that a combination of non-Pt metals might be close to and even surpass Pt with respect to ORR activity.16 Based on this observation, a rational choice for designing a new ORR material composition could thus start from selecting materials to match from each side of the volcano peak and study the ensemble effects in more complex multinary alloys. This approach, however, often turns into a serendipitous expedition, which neither accelerates the rapid development of new electrocatalyst materials nor provides guidance (i.e. generic design rules) for future discoveries. In addition, due to the modeling challenges associated with multinary systems there are no theoretical predictions available in literature for ORR activity of such systems. Without the guidance provided from simulation, it is neither easy to find an optimal composition nor practical to define a narrow chemical search space within multinary systems. Therefore, new approaches are needed so that multinary systems for specific chemical reactions can be examined in a more comprehensive way.
To this end, combinatorial materials science coupled with high-throughput characterization could be a viable approach to address these challenges. Since the first use in the 1960s for drug discovery,17 the combinatorial approach has expanded into materials synthesis and screening for a wide array of applications. Particularly in electrocatalysis, several researchers have recently developed high throughput electrocatalyst screening techniques, such as a scanning droplet cell (SDC),18–20 multi-electrode based half-cells21 and full cells.22 Previous groups, including ours, have shown that these approaches can be used to study many facets of multinary systems, including variations of composition, crystal structure, and processing conditions.18,23–26 Due to the advantage of scanning in a large compositional range,20,27 SDC can be widely applied for the elucidation of specific properties of binary, ternary and quaternary material libraries.18,25,26,28 However, SDC-based screening was seldom applied in ORR studies. Recently, we demonstrated, using SDC, that the ORR activity of thin Pt films sputtered on oxidized Ti/Nb surfaces is not significantly influenced by the substrate as long as the Pt film has a nominal thickness of >1 nm.23 This time we will explore a non-Pt multinary system in alkaline ORR studies using a SDC as a primary screening tool.
From the perspective of experimental effort, cost savings, and reduced time for commercialization, it could be more beneficial to start from theory, narrow down the materials composition rapidly and then explore different methods of material fabrication. We illustrate this pathway including structural and electrochemical characterization in a “Gedankenexperiment” like materials funnel, where the SDC coupled with high throughput characterization is more efficient than a general electrocatalyst screening process (Scheme 1). Once an ideal material composition is determined, one can then tailor the catalytic structure for a target reaction and pursue a more in-depth structure and property characterization.29 Through the years, various catalytic nanostructures have been demonstrated such as nanoprism,3 nanoporous sponge,4 bimetallic nanoparticle,8 nanothorn,10 core–shell nanostructures,8–10,30 nanobrush11 and nanoplate.12 Previously, many Pd-based binary alloys were examined as ORR catalysts in alkaline solution such as Pd–Ti,31 Pd–Au32 and Pd–Ag.5,30 Recently our group has shown that Ag–Pd core–shell structures30 as well as metallic glass alloy structures33–36 are active in the alkaline regime. Although these structural demonstrations show promise, the underlying development of new material compositions has been slow. For example, Lee et al. reported a ternary Pd/Au/Ag nanosponge,7 however compositional guidance from the literature was very limited.
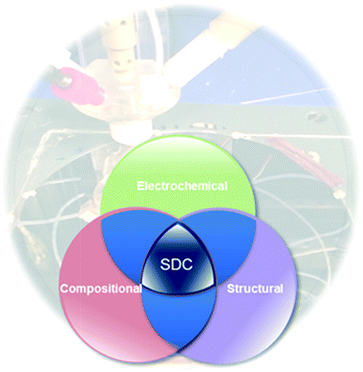 | ||
| Scheme 1 SDC coupled with compositional, structural and electrochemical characterization is more efficient than general electrocatalyst screening in narrowing down the materials composition. | ||
In this paper, with the specific interest in applying SDC in the ORR studies with Pd-based multinary systems in alkaline media, we selected Au, Ag and Ti because: (1) they have previously been considered as good candidates for binary Pd-based alloy ORR catalyst;30–32 (2) the structural similarity of Au and Ag could lower the complexity of the study of the multinary system;37 and (3) Ti shows a much lower d-band center location than Au and Ag in the Pd binary alloy. In respect to solid solution alloying, Ti is also a good candidate material for Pd substitution as they have about the same ionic radius.38 Here we show how high-throughput electrochemical characterization by means of SDC can contribute to the in-depth evaluation of a Pd-based quaternary system with analysis on the ORR on-set potential and current in correlation to composition and crystallographic properties.
Results and discussion
Compositional and structural properties
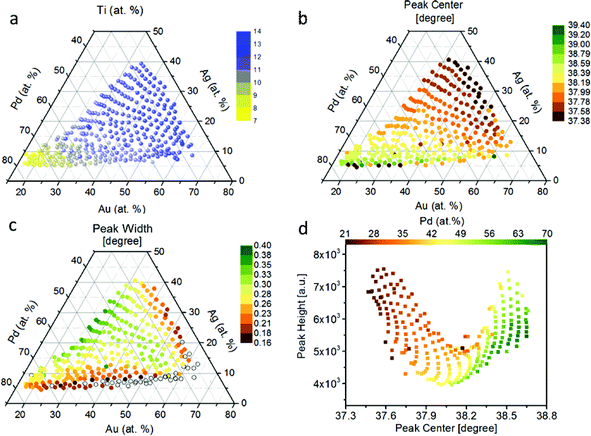
We show the compositional map of the entire Pd–Au–Ag–Ti thin film library (Fig. 1a). The composition variation in atomic percentage (at%) of the quaternary system is: Pd 21–71%, Au 15–65%, Ag 4–35%, and Ti 8–14%. This non-linear compositional distribution of the quaternary system of Pd–Au–Ag–Ti is caused by the orientation and the distance between the sputter targets and the base substrate as described previously.39 The continuous thin-film library does not exhibit any color variation over the whole compositional gradient. From XRD patterns of the individual measurement areas of the ML, we observe that there are 5 to 6 diffraction peaks that shift systematically with compositional variation as indicated (Fig. S1†). The Ag–Pd–Au system is known to be a fcc solid solution with a low Ti solubility.40 Upon addition of Ti, which has a low solubility,40 we do not observe any evidence of a parasitic phase in this quaternary composition range from the XRD patterns.41 Based on these observations, we assume a solid solution of all elements over the entire materials library. We note that annealing of the library could lead to the formation of Ti-containing phases due to the far from equilibrium nature of the deposition process (magnetron sputtering onto substrate at room temperature). As there is no occurrence of other XRD peaks than those matching a single solid solution FCC phase, the only secondary phase that could exist is an amorphous matrix, which is therefore not detectable with the herein used XRD analysis.With an increasing Pd content, the peaks shift to higher 2θ values, which indicates a contraction of the lattice (Fig. S1†). We illustrate that this trend becomes more pronounced when the peak center and width of the (111) peak are plotted over the compositional spread (Fig. 1b and c). For this plot the peaks were fitted by a simplified Cauchy curve:
Evaluation of electrocatalytic activity
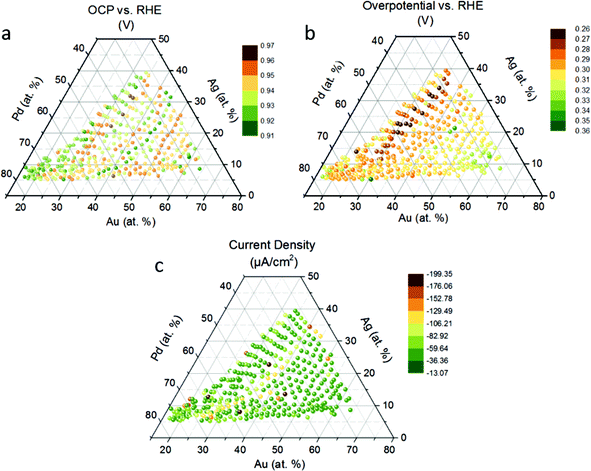
We show the open circuit potential (OCP) at each measurement area (Fig. 2a). Electrode materials, however, may not remain pure at the high thermodynamic ORR potential (1.23 V vs. NHE at standard conditions), but may undergo oxidation, which changes their surface properties. For example, the steady-state rest potential of a Pt electrode in O2 saturated 1 M H2SO4 is 1.06 V vs. NHE, a mixed value of the thermodynamic potential of Pt oxidation (0.88 V vs. NHE) and O2 reduction (1.23 V vs. NHE).45 In general, it is reasonable to find an increase in the OCP with the addition of noble metals.46 However we do not observe this in the quaternary system (Fig. 2a). For example, the OCP does not vary linearly with the Au content, showing instead a periodic trend. The peaks showed up around samples with 30, 40 and 50 at% Au display uniformly high OCP (∼0.96 V). The samples between the peaks display rather low OCP values (∼0.91 V). The OCP mapping reflects the stability of the alloys in 1 M KOH, and a higher OCP represents a higher starting point for ORR. The alloying effect may have a contribution to the trend but further studies are needed for a clear explanation.We show the ORR overpotential potential extracted from the linear sweep voltammograms following the OCP of the quaternary thin-film library and find a volcano-like relationship between the overpotential and Au content (Fig. 2b). The 30–35 at% Au region appears to have the lowest overpotential for the ORR. Within this region, we reveal promising compositions with the lowest overpotential for the ORR, namely Pd31Au29Au28Ti12 (0.265 V), Pd40Au29Ag20Ti12 (0.267 V), Pd35Au30Ag23Ti12 (0.265 V), Pd27Au30Ag30Ti13 (0.269 V), which is very close to that of the pure Pt thin film (0.268 V, Fig. S2a† inlet) sputtered for comparison. The Pd![[thin space (1/6-em)]](https://www.rsc.org/images/entities/char_2009.gif) :
:![[thin space (1/6-em)]](https://www.rsc.org/images/entities/char_2009.gif) Au ratio is roughly 1
Au ratio is roughly 1![[thin space (1/6-em)]](https://www.rsc.org/images/entities/char_2009.gif) :
:![[thin space (1/6-em)]](https://www.rsc.org/images/entities/char_2009.gif) 1 with one exception of Pd40Au29Ag20Ti12, which is 1.33
1 with one exception of Pd40Au29Ag20Ti12, which is 1.33![[thin space (1/6-em)]](https://www.rsc.org/images/entities/char_2009.gif) :
:![[thin space (1/6-em)]](https://www.rsc.org/images/entities/char_2009.gif) 1. We note that the 1
1. We note that the 1![[thin space (1/6-em)]](https://www.rsc.org/images/entities/char_2009.gif) :
:![[thin space (1/6-em)]](https://www.rsc.org/images/entities/char_2009.gif) 1 Pd
1 Pd![[thin space (1/6-em)]](https://www.rsc.org/images/entities/char_2009.gif) :
:![[thin space (1/6-em)]](https://www.rsc.org/images/entities/char_2009.gif) Au ratio has been previously reported exhibiting a similar overpotential to Pt.6 Previously Oliveira et al. found for binary Pd–Ag electrocatalysts decreasing overpotentials with lower Ag content.5 We observe this same trend in the region above 50 at% Au, where the overpotential shows a decreasing trend with higher Ag content (Fig. 2b).
Au ratio has been previously reported exhibiting a similar overpotential to Pt.6 Previously Oliveira et al. found for binary Pd–Ag electrocatalysts decreasing overpotentials with lower Ag content.5 We observe this same trend in the region above 50 at% Au, where the overpotential shows a decreasing trend with higher Ag content (Fig. 2b).
We reveal that from Pd 40% to Pd 52%, the overpotential increases with a decreasing current at 0.635 V vs. RHE (Fig. S2a†). However, we find a short-range order with a volcano relationship from Pd 23% to Pd 38%, and the lowest overpotential, with Pd 27%, 31%, and 38%. Fig. S2a† shows the plateau current of the compositions. Although the compositions around Au 40% did not achieve a low overpotential they all exhibit a similar current plateau of around −0.4 μA. Remarkably, in the binary Pd–Ag electrocatalyst system, there is a decreasing ORR current density with increasing Ag content,5 however, we notice that in the quaternary system high current densities around the 7 at% Ag region are found. This finding suggests that upon addition of Au and Ti, the relationship between current density and Ag content does not follow the same trend as shown in Pd–Ag binary system.
The current acquired with the SDC in this study is not comparable with RDE measurement since the mass transport is not controlled. We demonstrate chronoamperometry as a supplement to examine the activity for ORR (Fig. 2c). The following compositions have the highest current at 0.4 V vs. Ag/AgCl/3 M KCl: Pd37Au31Ag20Ti12 (−199.13 μA cm−2), Pd37Au39Ag12Ti12 (−192.15 μA cm−2), Pd51Au31Ag7Ti11 (−184.48 μA cm−2), and Pd57Au22Ag10Ti10 (−182.68 μA cm−2). Combining these observations with respect to high current density and the previous observations of low overpotentials, we suggest an ideal composition to be at about 40–60 at% Pd, 30–35 at% Au, 7–20 at% Ag and 12 at% Ti. Apparently, Au has a bigger influence on the ORR activity in this quaternary system than the other elements.
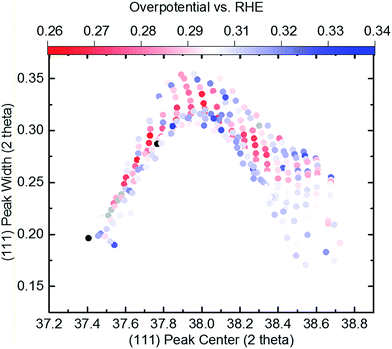
Based on this data abundance, we correlate our results from XRD and electrochemistry. Internal stress has previously been shown to drastically affect the electronic properties to the benefit of many electrochemical reactions.47,48 We find an interesting relationship when we plot the overpotential over the (111) peak center and peak width/strain (Fig. 1d) as shown in Fig. 3. Here, a non-trivial trend is visible for a given center position of the (111) peak. The lowest overpotentials are always recorded at intermediate values for the peak width/strain. It has been shown that strain can induce significant changes in the electronic structure of catalysts,47 which is in agreement with Fig. 3. However, there is a strong non-linearity with variation of the peak center position. The inset shows the overpotential over the peak width at a peak center position of 38.3° that hints at a volcano-like relationship. Especially when considering that the lowest overpotential is observed in the region of highest peak width/strain and in between the two quasi-equilibrium positions of the (111) peak at around 38.0° this correlation suggests further examination. We demonstrate an alternative visualization of this correlation is possible via the fact that a solid solution is present (Fig. 4). By plotting the lattice constant derived from Vegard's law and the lattice constant derived from XRD with the color-coded overpotential, we observe a similar trend that hints at a connection between strain and functional properties. We show that the lattice expands from a ‘equilibrium’ Vegard's value when moving rightward from a “Slope of 1” line (Fig. 4). For certain, small, lattice expansions the overpotential becomes higher. And similarly the peak width becomes larger for lattice contractions when moving leftward from a “Slope of 1” line. This changing of the peak broadness is shown in Fig. S6.† This finding indicates a possible route for optimization of ORR catalysts by finely adjusting the strain induced in a system through combinatorial alloying. Additionally, non-equilibrium strained alloys could be of interest as a design criterion for high-throughput computational investigations as performed at the Center for Next-Generation of Materials by Design: an Energy Frontier Research Center (CNGMD-EFRC).
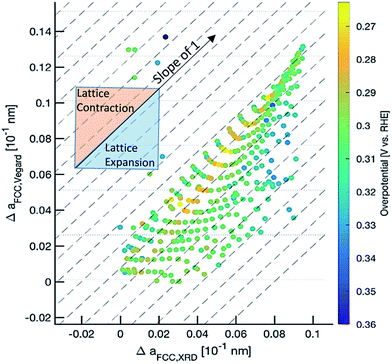 | ||
| Fig. 4 Correlation of Vegard's law and XRD derived lattice constants with color-coded overpotential potential values. | ||
Conclusion
A Pd–Au–Ag–Ti thin film library (340 measurement areas) was investigated for potential high activity ORR candidates in the alkaline regime using a SDC. We reveal that the lowest overpotential region is shown to be around a quaternary composition region with 30 at% Au and >7 at% Ag. However, the highest current from chronoamperometry was observed to be around 40% Au with >7 at% Ag. A composition of Pd–Au–Ag–Ti of 4![[thin space (1/6-em)]](https://www.rsc.org/images/entities/char_2009.gif) :
:![[thin space (1/6-em)]](https://www.rsc.org/images/entities/char_2009.gif) 3
3![[thin space (1/6-em)]](https://www.rsc.org/images/entities/char_2009.gif) :
:![[thin space (1/6-em)]](https://www.rsc.org/images/entities/char_2009.gif) 2
2![[thin space (1/6-em)]](https://www.rsc.org/images/entities/char_2009.gif) :
:![[thin space (1/6-em)]](https://www.rsc.org/images/entities/char_2009.gif) 1 is shown to have both promising overpotential and plateau current. The abundant data provided by SDC and the first study on quaternary Pd–Au–Ag–Ti thin film library could be applied in other fields of studies of electrocatalysts and provide guidance for a potential subsequent nanomaterial synthesis. A systematic volcano-like correlation between strain and overpotential is shown that could serve as a guideline for the optimization of new ORR catalysts.
1 is shown to have both promising overpotential and plateau current. The abundant data provided by SDC and the first study on quaternary Pd–Au–Ag–Ti thin film library could be applied in other fields of studies of electrocatalysts and provide guidance for a potential subsequent nanomaterial synthesis. A systematic volcano-like correlation between strain and overpotential is shown that could serve as a guideline for the optimization of new ORR catalysts.
Acknowledgements
The authors are grateful for support from NSF under Grant No. MRSEC DMR 1119826 (CRISP). A. D. T. also thanks the NSF-PECASE award (CBET-0954985). Facilities use was supported by YINQE, Brookhaven National Laboratory, and NSF MRSEC DMR 1119826 (CRISP). H. S. S. and K. S. acknowledge a PhD fellowship from the International Max Planck Research School for Surface and Interface Engineering (IMPRS-SurMat).References
- J. Sun, H. Ma, H. Jiang, L. Dang, Q. Lu and F. Gao, J. Mater. Chem. A, 2015, 3, 15882–15888 CAS.
- M. Carmo, R. C. Sekol, S. Ding, G. Kumar, J. Schroers and A. D. Taylor, ACS Nano, 2011, 5, 2979–2983 CrossRef CAS PubMed.
- L. Xu, Z. Luo, Z. Fan, X. Zhang, C. Tan, H. Li, H. Zhang and C. Xue, Nanoscale, 2014, 6, 11738–11743 RSC.
- J. Son, S. Cho, C. Lee, Y. Lee and J. H. Shim, Langmuir, 2014, 30, 3579–3588 CrossRef CAS PubMed.
- M. C. Oliveira, R. Rego, L. S. Fernandes and P. B. Tavares, J. Power Sources, 2011, 196, 6092–6098 CrossRef CAS.
- J.-J. Lv, S.-S. Li, A.-J. Wang, L.-P. Mei, J.-R. Chen and J.-J. Feng, Electrochim. Acta, 2014, 136, 521–528 CrossRef CAS.
- C.-L. Lee, Y.-C. Huang, L.-C. Kuo, J.-C. Oung and F.-C. Wu, Nanotechnology, 2006, 17, 2390–2395 CrossRef CAS.
- L. Kuai, B. Geng, S. Wang and Y. Sang, Chem.–Eur. J., 2012, 18, 9423–9429 CrossRef CAS PubMed.
- L. Jiang, A. Hsu, D. Chu and R. Chen, Electrochim. Acta, 2010, 55, 4506–4511 CrossRef CAS.
- G. Fu, Z. Liu, Y. Chen, J. Lin, Y. Tang and T. Lu, Nano Res., 2014, 7, 1205–1214 CrossRef CAS.
- C.-W. Chen, Y.-S. Hsieh, C.-C. Syu, H.-R. Chen and C.-L. Lee, J. Alloys Compd., 2013, 580, S359–S363 CrossRef CAS.
- C.-L. Lee, H.-P. Chiou, C.-M. Syu, C.-R. Liu, C.-C. Yang and C.-C. Syu, Int. J. Hydrogen Energy, 2011, 36, 12706–12714 CrossRef CAS.
- M. Carmo, G. Doubek, R. C. Sekol, M. Linardi and A. D. Taylor, J. Power Sources, 2013, 230, 169–175 CrossRef CAS.
- P. Quaino, F. Juarez, E. Santos and W. Schmickler, Beilstein J. Nanotechnol., 2014, 5, 846–854 CrossRef CAS PubMed.
- W. R. Fawcett, J. Am. Chem. Soc., 2000, 122, 6139 CrossRef.
- J. K. Nørskov, J. Rossmeisl, A. Logadottir, L. Lindqvist, J. R. Kitchin, T. Bligaard and H. Jónsson, J. Phys. Chem. B, 2004, 108, 17886–17892 CrossRef.
- R. B. Merrifield, J. Am. Chem. Soc., 1963, 85, 2149–2154 CrossRef CAS.
- H. S. Stein, R. Gutkowski, A. Siegel, W. Schuhmann and A. Ludwig, J. Mater. Chem. A, 2016, 4, 3148–3152 CAS.
- J. A. Haber, C. Xiang, D. Guevarra, S. Jung, J. Jin and J. M. Gregoire, ChemElectroChem, 2014, 1, 524–528 CrossRef.
- J. P. Kollender, A. I. Mardare and A. W. Hassel, Electrochim. Acta, 2015, 179, 32–37 CrossRef CAS.
- K. C. Neyerlin, G. Bugosh, R. Forgie, Z. Liu and P. Strasser, J. Electrochem. Soc., 2009, 156, B363 CrossRef CAS.
- R. Jiang and D. Chu, J. Electroanal. Chem., 2002, 527, 137–142 CrossRef CAS.
- D. Schaefer, C. C. Mardare, A. Savan, M. D. Sanchez, B. Mei, W. Xia, M. Muhler, A. Ludwig and W. Schuhmann, Anal. Chem., 2011, 83, 1916–1923 CrossRef CAS PubMed.
- M. L. Green, I. Takeuchi and J. R. Hattrick-Simpers, J. Appl. Phys., 2013, 113, 231101 CrossRef.
- H. Stein, D. Naujoks, D. Grochla, C. Khare, R. Gutkowski, S. Grützke, W. Schuhmann and A. Ludwig, Phys. Status Solidi A, 2015, 212, 2798–2804 CrossRef CAS.
- K. Sliozberg, H. S. Stein, C. Khare, B. A. Parkinson, A. Ludwig and W. Schuhmann, ACS Appl. Mater. Interfaces, 2015, 7, 4883–4889 CAS.
- K. Sliozberg, D. Schäfer, T. Erichsen, R. Meyer, C. Khare, A. Ludwig and W. Schuhmann, ChemSusChem, 2015, 8, 1270–1278 CrossRef CAS PubMed.
- J. Clausmeyer, J. Henig, W. Schuhmann and N. Plumere, ChemPhysChem, 2014, 15, 151–156 CrossRef CAS PubMed.
- M. Black, J. Cooper and P. McGinn, Meas. Sci. Technol., 2005, 16, 174–182 CrossRef CAS.
- R. C. Sekol, X. Li, P. Cohen, G. Doubek, M. Carmo and A. D. Taylor, Appl. Catal., B, 2013, 138–139, 285–293 CrossRef CAS.
- J. L. Fernández, V. Raghuveer, A. Manthiram and A. J. Bard, J. Am. Chem. Soc., 2005, 127, 13100–13101 CrossRef PubMed.
- M. Nie, P. K. Shen and Z. Wei, J. Power Sources, 2007, 167, 69–73 CrossRef CAS.
- G. Doubek, R. C. Sekol, J. Li, W. H. Ryu, F. S. Gittleson, S. Nejati, E. Moy, C. Reid, M. Carmo, M. Linardi, P. Bordeenithikasem, E. Kinser, Y. Liu, X. Tong, C. O. Osuji, J. Schroers, S. Mukherjee and A. D. Taylor, Adv. Mater., 2016, 28, 1940–1949 CrossRef CAS PubMed.
- R. C. Sekol, M. Carmo, G. Kumar, F. Gittleson, G. Doubek, K. Sun, J. Schroers and A. D. Taylor, Int. J. Hydrogen Energy, 2013, 38, 11248–11255 CrossRef CAS.
- S. Mukherjee, R. C. Sekol, M. Carmo, E. I. Altman, A. D. Taylor and J. Schroers, Adv. Funct. Mater., 2013, 23, 2708–2713 CrossRef CAS.
- S. Mukherjee, M. Carmo, G. Kumar, R. C. Sekol, A. D. Taylor and J. Schroers, Electrochim. Acta, 2012, 74, 145–150 CrossRef CAS.
- Z. W. Lu, S. H. Wei and A. Zunger, Phys. Rev. B: Condens. Matter Mater. Phys., 1991, 44, 10470–10484 CrossRef CAS.
- R. D. Shannon, Acta Crystallogr., Sect. A: Cryst. Phys., Diffr., Theor. Gen. Crystallogr., 1976, 32, 751–767 CrossRef.
- Y. Liu, J. Liu, S. Sohn, Y. Li, J. J. Cha and J. Schroers, Nat. Commun., 2015, 6, 7043 CrossRef CAS PubMed.
- H. Baker, ASM International Alloy Phase Diagram Committee and ASM International Handbook Committee, Alloy phase diagrams, ASM International, Materials Park, Ohio, 1992 Search PubMed.
- In Noble Metal Systems. Selected Systems from Ag–Al–Zn to Rh–Ru–Sc, ed. G. Effenberg and S. Ilyenko, Springer Berlin Heidelberg, Berlin, Heidelberg, 2006, pp. 1–7, DOI:10.1007/10916070_6.
- L. Vegard, Z. Phys., 1921, 5, 17–26 CrossRef CAS.
- S. Vives, E. Gaffet and C. Meunier, Mater. Sci. Eng., A, 2004, 366, 229–238 CrossRef.
- A. Prince, in Ternary Evaluations, ed. G. Effenberg, MSI, Materials Science International Services GmbH, Stuttgart, 1988 Search PubMed.
- C. Song and J. Zhang, in PEM Fuel Cell Electrocatalysts and Catalyst Layers: Fundamentals and Applications, Springer London, London, 2008, 89–134, DOI:10.1007/978-1-84800-936-3_2.
- D. Wang, H. L. Xin, Y. Yu, H. Wang, E. Rus, D. A. Muller and H. D. Abruña, J. Am. Chem. Soc., 2010, 132, 17664–17666 CrossRef CAS PubMed.
- B. Yildiz, MRS Bull., 2014, 39, 147–156 CrossRef CAS.
- P. Strasser, S. Koh, T. Anniyev, J. Greeley, K. More, C. Yu, Z. Liu, S. Kaya, D. Nordlund, H. Ogasawara, M. F. Toney and A. Nilsson, Nat. Chem., 2010, 2, 454–460 CrossRef CAS PubMed.
Footnote |
| † Electronic supplementary information (ESI) available. See DOI: 10.1039/c6ta08088j |
| This journal is © The Royal Society of Chemistry 2017 |

