Electrokinetically operated microfluidic devices for integrated immunoaffinity monolith extraction and electrophoretic separation of preterm birth biomarkers†
Mukul
Sonker
 ,
Ellen K.
Parker
 ,
Anna V.
Nielsen
 ,
Vishal
Sahore
 and
Adam T.
Woolley
 *
*
Department of Chemistry and Biochemistry, Brigham Young University, Provo, UT 84602, USA. E-mail: atw@byu.edu
First published on 3rd November 2017
Abstract
Biomarkers are often present in complex biological fluids like blood, requiring multiple, slow sample preparation steps that pose limitations in simplifying analysis. Here we report integrated immunoaffinity extraction and separation devices for analysis of preterm birth biomarkers in a human blood serum matrix. A reactive polymer monolith was used for immobilization of antibodies for selective extraction of target preterm birth biomarkers. Microfluidic immunoaffinity extraction protocols were optimized and then integrated with microchip electrophoresis for separation. Using these integrated devices, a ∼30 min analysis was carried out on low nanomolar concentrations of two preterm birth biomarkers spiked in a human serum matrix. This work is a promising step towards the development of an automated, integrated platform for determination of preterm birth risk.
1. Introduction
Microfluidic devices have garnered immense interest for disease diagnosis due to advantages like small sample requirements, low cost, portability, and rapid analysis.1–5 Microfluidic platforms have been reported recently for detection of biomarkers or molecular indicators of cancers,6,7 diabetes,8 cardiac disorders,9 Alzheimer's10 and infectious11,12 diseases. These biomarkers are typically present in complex biological matrices like blood, cerebrospinal fluid or urine, which often require complicated off-chip sample preparation steps prior to analysis.7,8,10–12 These processes are a major limitation in automated sample-to-answer microfluidic analysis; thus, numerous microfluidic platforms are being developed that can perform sample preparation processes on-chip, like blood cell-plasma separation,13 preconcentration,14,15 and fluorescent labeling16,17 in an integrated fashion.6,10,18,19Preterm birth (PTB), birth prior to 37 weeks of gestation, is the most common complication in pregnancy and the leading cause of neonatal deaths and newborn illnesses.20–22 Recently, a maternal serum biomarker panel (comprised of four proteins and five peptides) was identified that can predict a subsequent PTB with 87% sensitivity and 81% specificity.23,24 Thus, a platform for early detection of PTB risk could offer a substantial medical benefit in preventing preterm births. We have previously developed microfluidic devices for various on-chip sample preparation and analytical processes for PTB biomarkers, including electrophoretic separation,25,26 combined preconcentration with electrophoretic separation,14,27 and on-chip fluorescent labeling26 integrated with microchip electrophoresis (μCE).28 Here, we have developed an electrokinetically operated immunoaffinity monolith microfluidic device integrated with μCE for the extraction and separation of selected PTB biomarkers in a human serum matrix.
Porous polymer monoliths are often used in microfluidic systems as chromatographic materials due to their high surface area, low backpressure and ease of fabrication. Affinity monoliths are especially promising for solid-phase extraction applications in microfluidics.5,29 Liu et al.30 developed a voltage-driven glass microfluidic device with a carbohydrate-modified affinity monolith to study the interaction between polysaccharides and granulocyte colony-stimulating factor. Kang et al.31 used affinity monoliths made from glycidyl methacrylate (GMA) to carry out microfluidic immunoassays for H1N1 influenza virus. Low nanomolar to micromolar concentrations of target analyte were extracted and detected using these affinity devices; however, these affinity extraction reports could be improved by developing a multiplexed approach for capture of target analytes, and by working directly with biologically relevant sample matrices like blood or urine. Yang et al.32,33 previously developed an immunoaffinity channel wall coating using GMA copolymerized with polyethylene glycol diacrylate (PEGDA) in poly(methyl methacrylate) (PMMA) microchips. Using these affinity devices, automated extraction, separation, and quantification of low nanomolar concentrations of multiple cancer biomarkers was reported in human serum, but the biomarker panel was not designed for diagnostic potential. Additionally, the PMMA device material had poor compatibility towards organic solvents, which limited the ability to form and optimize monoliths. Finally, the wall-coated affinity column had limited binding capacity and was less effective for analyte capture compared to what could be achieved with a monolith polymerized across the full channel cross-section.
In this work, we improved over these major limitations of prior work with three key advances. First, we developed cyclic olefin copolymer (COC) devices which offer greater solvent compatibility than PMMA. Second, with this solvent compatibility we developed new affinity monoliths with low enough backpressure for filling via capillary action such that they could be polymerized within the full channel volume instead of only using a wall coating. Third, these high surface area monoliths were used to immobilize antibodies (Abs) specific to two protein biomarkers (ferritin and lactoferrin) correlated with preterm birth to develop a targeted diagnostic application.23,24,34 These proteins are usually found in high pM to low nM concentrations in human serum,23,24,34 and using our immunoaffinity monolith devices we have successfully extracted low nM concentrations of these biomarkers from buffer and human serum samples. This immunoaffinity extraction system was further integrated with μCE for the combined extraction and separation of two PTB biomarkers in a human serum matrix in <30 min analysis time. This work is a promising step towards an integrated microfluidic platform for the analysis of PTB biomarkers, which could be used for determining risk for a subsequent preterm birth.
2. Experimental section
2.1 Materials and reagents
Four-inch-diameter silicon wafers (single-side polished) were purchased from Desert Silicon (Tempe, AZ). PMMA sheets (1 mm and 3 mm thick) were from Evonik (Parsippany, NJ). Zeonor 1060R (6′′ × 6′′ × 1 mm and 6′′ × 4′′ × 2 mm) COC plates were purchased from Zeon Chemicals (Louisville, KY). GMA, ethylene glycol dimethacrylate (EGDMA), PEGDA (Mw 575), benzoin methyl ether (BME), 2,2-dimethoxy-2-phenylacetophenone (DMPA), 1-dodecanol, sodium tetraborate decahydrate, and dimethyl sulfoxide (DMSO) were from Sigma-Aldrich (St Louis, MO). Tween 20 and sodium hydroxide were purchased from Mallinckrodt Baker (Paris, KY). Cyclohexanol was from J. T. Baker (Phillipsburg, NJ). Tris base, isopropyl alcohol (IPA), and acetonitrile were from Fisher Scientific (Fair Lawn, NJ). Cyclohexane and methanol were bought from Macron (Center Valley, PA). Anhydrous sodium carbonate, sodium bicarbonate, citric acid, sodium citrate, sodium phosphate monohydrate, anhydrous sodium phosphate, and boric acid were obtained from Merck (Darmstadt, Germany). Sodium chloride was obtained from Columbus Chemicals (Columbus, WI).All buffers used in sample preparation and experiments were prepared using deionized water (18.3 MΩ) from a Barnstead EASYpure UV/UF system (Dubuque, IA) and further filtered with 0.45 μm syringe filters (Thermo Scientific Nalgene, Waltham, MA). Ferritin (Fer) was purchased from EMD Millipore (Billerica, MA). Lactoferrin (LF), anti-lactoferrin (anti-LF, produced in rabbit), and anti-ferritin (anti-Fer, produced in rabbit) were purchased from Sigma. Nitrocellulose paper and labeled secondary antibody (IRDye 800CW goat anti-rabbit IgG) were obtained from LI-COR, Inc. (Lincoln, NE). Tris hydrochloride, fluorescein isothiocyanate (FITC), and Alexa Fluor 488 TFP ester (AF 488) came from Life Technologies (Carlsbad, CA). Residual, de-identified human serum (slated for discard) from blood draw training with informed consent in BYU's NAACLS-accredited program was used.
2.2 Device design and fabrication
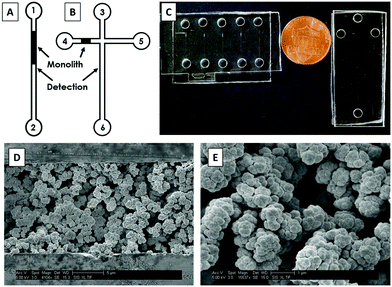
First, the device designs were transferred to silicon wafers at the Integrated Microfabrication Laboratory at Brigham Young University using standard photolithography and etching techniques described previously.35,36 PMMA and COC devices were fabricated from these silicon templates following hot embossing and thermal bonding protocols reported previously.16,26 Briefly, the patterns from silicon templates were transferred to 1 mm thick PMMA and COC sheets by hot embossing at 138 °C for 27 min. Holes for reservoirs were drilled into 2 mm thick COC plates using a 2 mm diameter bit with a drill press (Cameron, Sonora, CA). For PMMA, holes were cut into 2 mm thick sheets using a laser cutter (VLS 2.30 Versa Laser, Universal Laser Systems, Scottsdale, AZ). These plates were then thermally bonded to 1 mm thick sheets for 25 min at 110 °C. Devices were further sealed by applying acetonitrile (PMMA) or cyclohexane (COC) around the edges. Two different device designs were used for these experiments: straight channels for optimization of immunoaffinity extraction (Fig. 1A) and a “T” shaped layout for integrated immunoaffinity extraction and μCE (Fig. 1B). A photograph of these devices is shown in Fig. 1C.2.3 Monolith fabrication
A GMA-EGDMA monolith was polymerized in the microfluidic channels. For COC devices, a photografting step with PEGDA was done prior to monolith polymerization as described previously.27,37 The pre-polymer mixture was prepared using the following recipe: reactive monomer (GMA, 20%), crosslinker (EGDMA, 10%), porogen (cyclohexanol and 1-dodecanol, each 25%), and surfactant (Tween 20, 20%). This polymer mixture was sonicated for 10 min until a uniform solution was obtained; then, photoinitiator (DMPA, 1%) was added and the mixture was further sonicated for 10 min. This sonicated solution was transferred to device reservoirs and allowed to flow through channels by capillary action. A Cr mask with a 0.6 mm wide opening was used to expose the desired part of the channel for polymerization of the monolith. UV exposure (∼100 mW cm2) was carried out for 11 min using a SunRay 600 UV lamp (Uvitron International, West Springfield, MA). After exposure, the unpolymerized solution was flushed from the channels using IPA and a vacuum pump, after which the monolith was stored dry.For scanning electron microscopy (SEM) images, devices were cut into small pieces around the monoliths with an industrial bandsaw. These pieces were then glued to glass stubs using epoxy, and cross sections of the channels were microtomed using a glass knife. These pieces were placed on aluminum stubs using carbon tape and coated with ∼15 nm Au–Pd (60![[thin space (1/6-em)]](https://www.rsc.org/images/entities/char_2009.gif) :
:![[thin space (1/6-em)]](https://www.rsc.org/images/entities/char_2009.gif) 40) using a Q150 T ES Sputterer (Quorum Technologies, Lewes, East Sussex, UK) to reduce charging during imaging. SEM images were taken using a Philips XL30 ESEM FEG instrument (Hillsboro, OR) in high vacuum mode at 5 kV electron beam potential.
40) using a Q150 T ES Sputterer (Quorum Technologies, Lewes, East Sussex, UK) to reduce charging during imaging. SEM images were taken using a Philips XL30 ESEM FEG instrument (Hillsboro, OR) in high vacuum mode at 5 kV electron beam potential.
2.4 Antibody characterization and immobilization
The Abs were evaluated in a dot blot test to determine their specificity for and compatibility with their respective analytes (see ESI†). Abs were immobilized on the monolith using the epoxy groups present on the reactive monomer, GMA, as described previously.32,33,38,39 A solution of Ab (5 μL, 2 mg mL−1) was added to the reservoir and flowed through the monolith by capillary action. After adding the Ab, the reservoirs were filled with 20 mM borate buffer (pH 8) and sealed using tape to prevent evaporation. Devices were left overnight at room temperature to provide ample time for primary amines on the Ab to react with epoxy groups on the GMA monolith. Next, the remaining epoxy groups were blocked by flowing 0.1 M Tris buffer (pH 8.5) through the monoliths for 1 h. After blocking, the monoliths were thoroughly washed with 20 mM phosphate buffer (pH 7.2). Control experiments were carried out by blocking the whole monolith with Tris buffer without immobilizing any Ab.2.5 Fluorescent labeling
PTB biomarkers, serum, and Abs were fluorescently labeled off-chip using FITC and AF 488. Briefly, 10 mM FITC and 6 mM AF 488 solutions were prepared in DMSO. Unlabeled analyte solutions were prepared in 0.1 M bicarbonate buffer (BCB, pH 9.5). For anti-Fer labeling, 5 μL of 10 mM FITC was added to 50 μL of anti-Fer (2 mg mL−1). For Fer and LF labeling, 5 μL of AF 488 solution was added to 50 μL of Fer (1 mg mL−1) and LF (2 mg mL−1) solutions. These solutions were left overnight at room temperature on an electric shaker (VWR, Radnor, PA) to facilitate mixing. Unreacted FITC or AF 488 was removed from these solutions using 10 kDa cut-off Amicon ultra 0.5 mL centrifugal filters (EMD Millipore). The concentrations of filtered, labeled analytes were determined with a Nanodrop ND-1000 spectrophotometer (Wilmington, DE). For labeling of human serum, 50 μL of serum were mixed with 50 μL of 0.1 M BCB. Spiked serum also had 5 μL each of unlabeled Fer (10 μM) and LF (20 μM) added. For both spiked and unspiked samples, 10 μL of 6 mM AF 488 in DMSO was added to the diluted serum, which was left overnight on an electric shaker at room temperature. Unattached AF 488 was not filtered from labeled serum samples to avoid removal of low molecular weight labeled components; after labeling the serum samples were further diluted ten-fold in 20 mM phosphate buffer (pH 7.2). Other fluorescently labeled samples were also diluted in 20 mM phosphate buffer (pH 7.2) to the desired concentration prior to experiments.2.6 Instrumentation and data analysis
The laser-induced fluorescence (LIF) setup used for these studies has been described previously.16,27,35 A 488 nm laser (∼8 mW, CrystalLaser, Reno, NV or JDSU, Shenzhen, China) was directed through a 20× objective on an inverted Nikon TE300 microscope to the desired detection point as shown in Fig. 1A and B. Fluorescently labeled analyte transiting the detection point provided fluorescence signal, which passed through a 505LD dichroic filter and a D535/40 band-pass filter (Chroma, Rockingham, VT) and was detected by a photomultiplier tube (HC120-05, Hamamatsu, Bridgewater, NJ). The fluorescence data were digitized by a NI USB-6212 analog-to-digital converter (National Instruments, Austin, TX) and recorded at 20 Hz using LabVIEW software (National Instruments). A 5-point boxcar average was used to remove high frequency noise in some electropherograms. Platinum electrodes were used to apply desired voltages to the reservoirs through a custom-designed voltage box connected to two power supplies (Stanford Research Systems, Sunnyvale, CA). The fluorescence on monoliths was determined from images taken with a Photometrics coolSNAP HQ2 (Tucson, AZ) CCD camera using a 4× objective with 200–500 ms exposure times, with image processing in NIH ImageJ software.2.7 Device operation
3. Results and discussion
3.1 Monolith characterization
SEM images of GMA-EGDMA monoliths are shown in Fig. 1D and E. The monoliths were found to be well polymerized and anchored to the microfluidic channel walls. Pores were randomly distributed across the monolith, which aided in mixing of sample and increasing interaction with the Ab-modified monolith surface. Additionally, monolith nodules had average diameters of 750 nm (n = 10), and monoliths had average pore sizes of 1100 nm (n = 10). Monoliths did not detach from the channel walls or break during application of electric field or vacuum, consistent with previous reports.38,393.2 Antibody immobilization
Antibodies are used extensively in microfluidic systems because of their high selectivity towards target proteins and ease of immobilization within microfluidic environments.40 Compatibility of the antibody–antigen pairs used in this study was determined using a dot-blot test (see Fig. S1 in the ESI†). The dot blot shows high affinity of anti-LF and anti-Fer towards LF and Fer, respectively; and to LF and Fer spiked into serum. Additionally, some binding of anti-LF and anti-Fer was observed for unspiked serum because of LF and Fer naturally present in serum.Antibodies were immobilized in a single step by reacting the GMA epoxy groups on the monolith surface with amine groups present on Abs. We note that these epoxy groups can be converted to more reactive species for faster reaction kinetics, but that introduces additional column preparation steps that can reduce the overall device yield.39 Initially, different concentrations of FITC-labeled anti-Fer were used for immobilization to determine optimal binding conditions. We used fluorescence to probe Ab immobilization, providing internal consistency with fluorescence detection in our μCE separations. Fig. 2 shows the background-subtracted fluorescence obtained from monoliths after immobilizing FITC-anti-Fer concentrations ranging from 2–2000 μg mL−1 followed by a thorough rinsing step. A leveling off in the fluorescence signal from around 500–2000 μg mL−1 loaded Ab was observed, which indicates saturation of the monolith. FITC-modified Abs likely have reduced immobilization efficiency, leading to an underestimate of attachment density; for subsequent studies a concentration of 2000 μg mL−1 was used for unmodified anti-Fer and anti-LF in monolith derivatization. Additionally, the effect of repeating the Ab immobilization process for three consecutive days was also observed. Fig. S2 in the ESI† shows no increase in fluorescence signal after the first day of immobilization, confirming that a single day of immobilization time is sufficient.
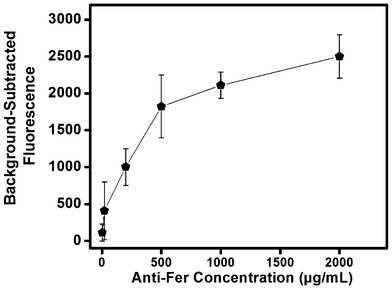 | ||
| Fig. 2 Background-subtracted fluorescence on a GMA-EGDMA monolith after immobilization of different concentrations of FITC-labeled anti-Fer (n = 3) followed by rinsing. | ||
3.3 Optimization of immunoaffinity extraction
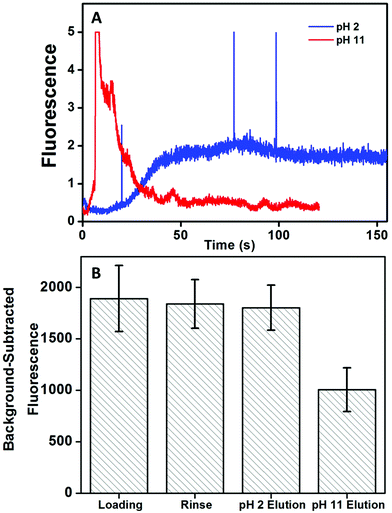
Next, the pH for elution of target biomarker after affinity extraction on monoliths was determined. We used a straight channel design (Fig. 1A) with the monolith modified with anti-Fer. Elution with either low pH (20 mM phosphoric acid, pH 2) or high pH (20 mM BCB, 25 mM NaCl, pH 11) was tested using 50 nM AF 488-labeled Fer. Fluorescent signal was recorded after the end of monolith as indicated in Fig. 1A. AF 488 was used for labeling due to its more stable fluorescence across a wide pH range than FITC. Fig. 3A shows elution traces of Fer from the monolith with both eluents. A delayed but steady elution of Fer was observed with low pH eluent. A more intense signal for eluted Fer was observed with high pH eluent, and the signal returned to background rapidly, indicating the higher elution efficiency at pH 11. Additionally, background-subtracted fluorescence was measured from CCD images of the monolith to show the effect on signal after each step (see Fig. 3B). Images were taken after filling the column with pH 7 buffer to eliminate pH-dependent changes in fluorescence signal. No statistically significant change in the fluorescence was observed after elution at pH 2, indicating poor elution. In contrast, a 47% decrease in the fluorescence signal was observed after elution at pH 11, indicating much better elution efficiency at this pH, also consistent with the results in Fig. 3A. Thus, pH 11 eluent was used for subsequent experiments; improved rinses and eluents may be able to reduce nonspecific adsorption on monoliths and increase elution of target analytes.3.4 Immunoaffinity extraction of PTB biomarkers
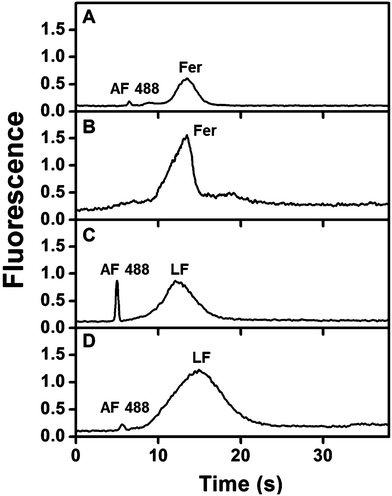
Fig. 4 shows immunoaffinity extraction of two AF 488-labeled PTB biomarkers, Fer and LF, from GMA-EGDMA columns with or without their corresponding Abs. Fig. 4A and B show elution traces for 10 and 1 nM Fer loaded on a monolith with or without anti-Fer. An initial peak at ∼3–5 s was observed in these elution traces, which indicates either nonspecifically adsorbed AF 488 present in the sample or unretained Fer located in the monolith pores. In the columns modified with anti-Fer, a second peak was observed at 15–30 s, indicating elution of retained Fer; in contrast, no peak was observed for experiments on columns without anti-Fer. In Fig. 4C and D, a similar initial peak was obtained at ∼2 s for all columns. However, for 25 and 2.5 nM LF (consistent with serum levels) a second peak for retained LF at 3–8 s was observed only when anti-LF was immobilized on the column, corresponding to the elution of retained LF. Two different low nM concentrations of Fer and LF were loaded on the column for these experiments; for a 10-fold increase in concentration 9- and 8-fold increases in eluted peak area were observed for Fer and LF, respectively, showing promise for quantitative analysis32 in the future. Low nM concentrations were chosen to highlight the applicability of our immunoaffinity monolith devices for extraction of Fer and LF concentrations at or near serum levels, with further potential for detecting lower concentrations through future integration with our recently reported preconcentration devices.27,28 The eluted peaks were also broader for higher loaded concentrations. These results indicate our ability to extract PTB biomarkers with concentration-dependent elution using Ab-modified monolithic columns.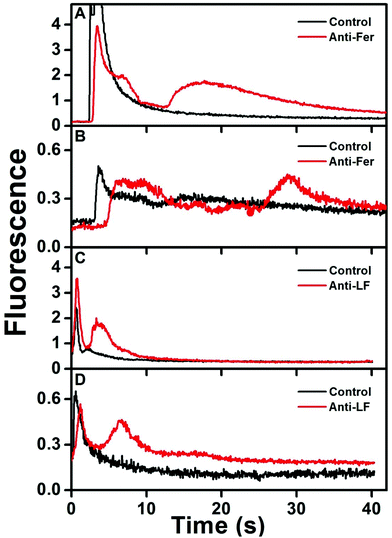 | ||
| Fig. 4 Elution traces after immunoaffinity extraction of PTB biomarkers on control and Ab-modified monoliths. Loaded concentrations: (A) 10 nM Fer, (B) 1 nM Fer, (C) 25 nM LF, and (D) 2.5 nM LF. | ||
3.5 Integrated immunoaffinity extraction and μCE
The ability to multiplex biomarkers is essential; in our studies, integration with μCE can be used to separate multiple extracted biomarkers. Fig. 5A shows μCE of 10 nM AF 488-labeled Fer using a standard T-shape device26,35,41 (lacking a monolith) using pinched injection for 1 min as described in section 2.7.2. When this same sample was first extracted on an anti-Fer modified monolith in an integrated device, the peak for free AF 488 was not observed at ∼6 s and the Fer peak area increased by 6 fold (Fig. 5B). Similarly, in Fig. 5C a peak for free AF 488 was observed in μCE of 25 nM LF (using a similar device to that in Fig. 5A). When this sample was first extracted on an integrated anti-LF column and then analyzed by μCE (Fig. 5D), the LF peak area increased by 2.5 fold, and the unbound AF 488 peak area decreased by 7 fold. In the integrated devices, small variations in the distance between the polymerized monolith and injection intersection can lead to variations in the time for the eluted analyte plug to reach the intersection. Thus for each integrated device, eluted analyte was initially detected at the injection intersection to determine the migration/elution time, as described in section 2.7.2. The elution times for Fer and LF ranged from 15–20 s and 5–10 s (n = 6), respectively, in these integrated devices, and the elution/injection times used to obtain data like that shown in Fig. 5B and D were 20 s and 7 s (n = 2), respectively. Devices with immobilized Abs could be reused over a span of 1–2 weeks when stored at 4 °C with pH 7 buffer in the channels. Moreover, all devices were used at least twice for each experiment, with minimal to no loss in Ab activity. These results show that the integrated affinity monolith devices can be used for capture and elution of analytes with good run-to-run and device-to-device reproducibility. Additionally, this work demonstrates our ability to combine immunoaffinity extraction, specific elution, and electrophoretic separation of PTB biomarkers from buffered samples using an integrated device.3.6 Extraction and μCE separation of PTB biomarkers in a human serum matrix
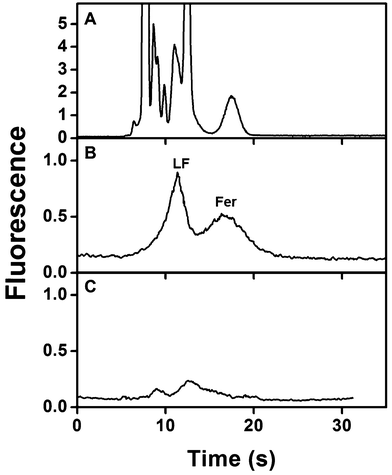
Biological matrices like blood often require multiple sample preparation steps prior to analysis that increase time and costs. Thus, after optimizing the integrated devices for analyzing samples in buffer, we analyzed spiked serum samples. Fig. 6A shows μCE of AF 488-labeled spiked human serum prepared as described in section 2.5. Multiple overlapping peaks from amine-labeled components present in serum mask the Fer and LF peaks. This same sample was then extracted on a monolith modified with both anti-LF and anti-Fer in an integrated device, eluted to the injection intersection, and analyzed by μCE. As above, the migration times for eluted Fer and LF were determined to have overlap at 15 s (n = 4) for the eluted plug at the injection intersection. In the electropherogram after on-chip sample processing (Fig. 6B), essentially all non-target peaks were removed and only peaks for LF and Fer were observed, indicating the sample purification capabilities of these devices. Notably, the total analysis time for this experiment was <30 min. The LF and Fer peaks were not baseline resolved because they have similar migration times (see Fig. 5), as also observed in a previous report.26Fig. 6C shows an electropherogram of unspiked AF 488-labeled human serum similarly processed in our integrated immunoaffinity/μCE system. The electropherogram shows small peaks corresponding to native serum concentrations of Fer and LF, consistent with the spiked sample in Fig. 6B and the dot blots in Fig. S1 in the ESI.† The fluorescence signal for the extracted LF and Fer peaks in Fig. 6B was lower than in Fig. 5 because the fluorescence labeling was affected by the presence of other abundant amine-reactive species in blood serum seen in Fig. 6A. Importantly, integration with a downstream fluorescent labeling process16,26,28 could improve signal. These results clearly indicate that integrated microfluidic devices can extract, specifically elute and separate serum concentrations of target biomarkers from complex biological matrices, offering potential for future point-of-care applications.4. Conclusions
We have reported immunoaffinity monolith microfluidic devices integrated with μCE for extraction and separation of PTB biomarkers directly from a human serum matrix. The microchips were electrokinetically operated, and a reactive GMA-EGDMA monolith was polymerized in microfluidic channels to immobilize antibodies specific to PTB biomarkers. Antibody immobilization and biomarker extraction protocols were optimized, and two PTB biomarkers were extracted at low nM concentrations using these affinity columns. These immunoaffinity monoliths were further integrated with μCE for combined extraction and separation of two PTB biomarkers directly in a blood serum matrix in <30 min analysis time.The separation of extracted biomarkers reported here could be further improved by modification of separation buffers to introduce stacking to get narrower peaks.25 Additionally, the device material could be further improved for better separation efficiency by incorporating surface modification37 to reduce non-specific adsorption of analytes on channel walls that induces peak tailing. Two biomarkers were extracted and separated on these integrated devices; in the future, more PTB biomarkers could also be analyzed by immobilizing additional antibodies on these high surface area monoliths. Additionally, the fluorescence signal for the captured biomarkers could be further increased by integration with downstream reversed-phase enrichment and fluorescent labeling16,26,36 prior to μCE. Challenges in integrating these processes on-chip include the fabrication of two different monoliths in a single device and electrokinetic manipulation of fluid within the channels over the wide pH range of reagents required for immunoaffinity extraction and fluorescent labeling. It may be possible to address these issues by using multilayer polydimethylsiloxane-COC microfluidic devices with valves and pumps for fabrication of monoliths, manipulation of reagents, and capture of the eluted analyte plug prior to μCE.14,25,28 The microfluidic system demonstrated herein offers promise for extraction and separation of desired biomarkers in serum samples, showing important progress towards an integrated microfluidic platform for analysis of PTB biomarkers.
Conflicts of interest
There are no conflicts to declare.Acknowledgements
We are thankful to Dr Vajira Weerasekara and Ashari Kannangara for their help with dot blot tests. Financial support for this work was provided by the National Institutes of Health through grant R01 EB006124 and a Roland K. Robins Graduate Research Fellowship awarded to Mukul Sonker from the Department of Chemistry and Biochemistry at Brigham Young University.References
- P. N. Nge, C. I. Rogers and A. T. Woolley, Chem. Rev., 2013, 113, 2550–2583 CrossRef CAS PubMed.
- S. Nahavandi, S. Baratchi, R. Soffe, S.-Y. Tang, S. Nahavandi, A. Mitchell and K. Khoshmanesh, Lab Chip, 2014, 14, 1496–1514 RSC.
- J. V. Pagaduan, V. Sahore and A. T. Woolley, Anal. Bioanal. Chem., 2015, 407, 6911–6922 CrossRef CAS PubMed.
- S. T. Sanjay, G. Fu, M. Dou, F. Xu, R. Liu, H. Qi and X. Li, Analyst, 2015, 140, 7062–7081 RSC.
- M. Sonker, V. Sahore and A. T. Woolley, Anal. Chim. Acta, 2017, 986, 1–11 CrossRef CAS PubMed.
- B. H. Shadfan, A. R. Simmons, G. W. Simmons, A. Ho, J. Wong, K. H. Lu, R. C. Bast Jr. and J. T. McDevitt, Cancer Prev. Res., 2015, 8, 37–48 CrossRef CAS PubMed.
- M. A. Ali, K. Mondal, Y. Jiao, S. Oren, Z. Xu, A. Sharma and L. Dong, ACS Appl. Mater. Interfaces, 2016, 8, 20570–20582 CAS.
- J. Li, K.-W. Chang, C.-H. Wang, C.-H. Yang, S.-C. Shiesh and G.-B. Lee, Biosens. Bioelectron., 2016, 79, 887–893 CrossRef CAS PubMed.
- S. R. Shin, Y. S. Zhang, D.-J. Kim, A. Manbohi, H. Avci, A. Silvestri, J. Aleman, N. Hu, T. Kilic, W. Keung, M. Righi, P. Assawes, H. A. Alhadrami, R. A. Li, M. R. Dokmeci and A. Khademhosseini, Anal. Chem., 2016, 88, 10019–10027 CrossRef CAS PubMed.
- R. M. Mohamadi, Z. Svobodova, Z. Bilkova, M. Otto, M. Taverna, S. Descroix and J.-L. Viovy, Biomicrofluidics, 2015, 9, 054117 CrossRef PubMed.
- F. Piraino, F. Volpetti, C. Watson and S. J. Maerkl, ACS Nano, 2016, 10, 1699–1710 CrossRef CAS PubMed.
- N. Garg, D. Vallejo, D. Boyle, I. Nanayakkara, A. Teng, J. Pablo, X. Liang, D. Camerini, A. P. Lee and P. Felgner, Procedia Eng., 2016, 159, 53–57 CrossRef CAS.
- M. Mohammadi, H. Madadi, J. Casals-Terré and J. Sellarès, Anal. Bioanal. Chem., 2015, 407, 4733–4744 CrossRef CAS PubMed.
- S. Kumar, V. Sahore, C. I. Rogers and A. T. Woolley, Analyst, 2016, 141, 1660–1668 RSC.
- Y. Cong, S. Katipamula, T. Geng, S. A. Prost, K. Tang and R. T. Kelly, Electrophoresis, 2016, 37, 455–462 CrossRef CAS PubMed.
- R. Yang, J. V. Pagaduan, M. Yu and A. T. Woolley, Anal. Bioanal. Chem., 2015, 407, 737–747 CrossRef CAS PubMed.
- C. Herzog, E. Poehler, A. J. Peretzki, S. M. Borisov, D. Aigner, T. Mayr and S. Nagl, Lab Chip, 2016, 16, 1565–1572 RSC.
- F. Cui, M. Rhee, A. Singh and A. Tripathi, Annu. Rev. Biomed. Eng., 2015, 17, 267–286 CrossRef CAS PubMed.
- M. Karle, S. K. Vashist, R. Zengerle and F. von Stetten, Anal. Chim. Acta, 2016, 929, 1–22 CrossRef CAS PubMed.
- R. L. Goldenberg, J. F. Culhane, J. D. Iams and R. Romero, Lancet, 2008, 371, 75–84 CrossRef.
- H. Blencowe, S. Cousens, M. Z. Oestergaard, D. Chou, A.-B. Moller, R. Narwal, A. Adler, C. Vera Garcia, S. Rohde, L. Say and J. E. Lawn, Lancet, 2012, 379, 2162–2172 CrossRef.
- R. Romero, S. K. Dey and S. J. Fisher, Science, 2014, 345, 760–765 CrossRef CAS PubMed.
- M. S. Esplin, K. Merrell, R. Goldenberg, Y. Lai, J. D. Iams, B. Mercer, C. Y. Spong, M. Miodovnik, H. N. Simhan, P. van Dorsten and M. Dombrowski, Am. J. Obstet. Gynecol., 2011, 204, 391.e1–391.e8 CrossRef PubMed.
- S. W. Graves and M. S. Esplin, Am. J. Obstet. Gynecol., 2011, 204, S46 CrossRef.
- V. Sahore, S. Kumar, C. I. Rogers, J. K. Jensen, M. Sonker and A. T. Woolley, Anal. Bioanal. Chem., 2016, 408, 599–607 CrossRef CAS PubMed.
- M. Sonker, R. Yang, V. Sahore, S. Kumar and A. T. Woolley, Anal. Methods, 2016, 8, 7739–7746 RSC.
- M. Sonker, R. Knob, V. Sahore and A. T. Woolley, Electrophoresis, 2017, 38, 1743–1754 CrossRef CAS PubMed.
- V. Sahore, M. Sonker, A. V. Nielsen, R. Knob, S. Kumar and A. T. Woolley, Anal. Bioanal. Chem., 2017 DOI:10.1007/s00216-017-0548-7.
- R. Knob, V. Sahore, M. Sonker and A. T. Woolley, Biomicrofluidics, 2016, 10, 032901 CrossRef PubMed.
- X. Liu, H. Wang, A. Liang, Y. Li, H. Gai and B. Lin, J. Chromatogr., A, 2012, 1270, 340–343 CrossRef CAS PubMed.
- Q.-S. Kang, X.-F. Shen, N.-N. Hu, M.-J. Hu, H. Liao, H.-Z. Wang, Z.-K. He and W.-H. Huang, Analyst, 2013, 138, 2613–2619 RSC.
- W. Yang, X. Sun, H.-Y. Wang and A. T. Woolley, Anal. Chem., 2009, 81, 8230–8235 CrossRef CAS PubMed.
- W. Yang, M. Yu, X. Sun and A. T. Woolley, Lab Chip, 2010, 10, 2527–2533 RSC.
- K. Abdel-Malek, M. A. El-Halwagi, B. E. Hammad, O. Azmy, O. Helal, M. Eid and M. Abdel-Rasheed, J. Obstet. Gynaecol., 2017, 1–4, DOI:10.1080/01443615.2017.1347915.
- R. T. Kelly and A. T. Woolley, Anal. Chem., 2003, 75, 1941–1945 CrossRef CAS PubMed.
- P. N. Nge, J. V. Pagaduan, M. Yu and A. T. Woolley, J. Chromatogr., A, 2012, 1261, 129–135 CrossRef CAS PubMed.
- Y. Ladner, A. Bruchet, G. Crétier, V. Dugas, J. Randon and K. Faure, Lab Chip, 2012, 12, 1680–1685 RSC.
- X. Sun, W. Yang, T. Pan and A. T. Woolley, Anal. Chem., 2008, 80, 5126–5130 CrossRef CAS PubMed.
- W. Yang, X. Sun, T. Pan and A. T. Woolley, Electrophoresis, 2008, 29, 3429–3435 CrossRef CAS PubMed.
- J. Mairhofer, K. Roppert and P. Ertl, Sensors, 2009, 9, 4804–4823 CrossRef CAS PubMed.
- S. C. Jacobson, R. Hergenröder, L. B. Koutny, R. Warmack and J. M. Ramsey, Anal. Chem., 1994, 66, 1107–1113 CrossRef CAS.
Footnote |
| † Electronic supplementary information (ESI) available. See DOI: 10.1039/c7an01357d |
| This journal is © The Royal Society of Chemistry 2018 |

