Electrogenerated chemiluminescence of Ru(bpy)32+ at a black phosphorus quantum dot modified electrode and its sensing application†
Lei
Zhang
a,
KaiJin
Tian
a,
YongPing
Dong
 *a,
HouCheng
Ding
a and
ChengMing
Wang
*b
aSchool of Chemistry and Chemical Engineering, Hexian Development Institute of Chemical Industry, Anhui University of Technology, Maanshan, China 243002. E-mail: dongyp524@163.com; Tel: +86-555-2311807
bHefei National Laboratory for Physical Science at the Microscale, University of Science and Technology of China, Hefei, China 230026. E-mail: chmwang@ustc.edu.cn; Tel: +86-551-63606447
First published on 16th November 2017
Abstract
Black phosphorus quantum dots (BPQDs) with an average size of 8.2 nm were synthesized through a liquid exfoliation method. The surface morphology and the thickness of the BPQDs were identified by high-resolution transmission microscopy (HRTEM), atomic force microscopy (AFM), and Raman spectroscopy. The electrogenerated chemiluminescence (ECL) behavior of Ru(bpy)32+ was investigated at a BPQD modified glassy carbon electrode under neutral conditions. A strong anodic ECL signal was obtained at the modified electrode in the absence of a coreactant, which is nearly three orders of magnitude larger than that at the bare electrode. Electrochemical results revealed that the oxidation process of Ru(bpy)32+ can be significantly catalyzed by BPQDs, suggesting that BPQDs can act as the coreactant of Ru(bpy)32+ to generate strong light emission. Dopamine could react with the oxidation product of Ru(bpy)32+ and exhibited an apparent inhibiting effect on ECL emission. As a result, it can be sensitively detected in the range of 0.1 nM to 50 nM with a detection limit of 0.022 nM. The present work revealed that BPQDs are a potential ECL platform, and which are promising in the fabrication of a novel ECL biosensor.
1. Introduction
In the past few years, a two dimensional (2D) monolayer and few-layered materials, such as graphene and transition-metal dichalcogenides (TMDs), have attracted great attention due to their altered optoelectronic and mechanical properties compared to their bulk counterparts.1 Inspired by the successful applications of these nanomaterials, considerable efforts have been devoted to the exploration of new members of the 2D family. Similar to graphite, the layered allotrope of phosphorus, black phosphorus (BP), has been intensively investigated as a new 2D building block in field-effect transistors, lithium batteries, photocatalysis, and gas sensors, owing to its unique structure as well as fascinating optical and electronic properties.2–8 As bulk BP consists of puckered layers stacked together by weak van der Waals interactions, the mechanical exfoliation method has been successfully used to prepare single- and few-layer BP nanosheets.9 Because of the anisotropic electrical conductance of BP nanosheets, it is very possible to have interesting applications in electrochemical sensing.10 Pumera et al. firstly reported the electrochemical behaviors of BP nanomaterials, and found that BP nanosheets exhibited inherent electrochemistry.11 In their following work, BP nanoparticles were synthesized by electrochemical exfoliation with bipolar electrodes, which exhibited a catalytic effect on the hydrogen evolution reaction. As a result, BP nanoparticles were used as electrocatalytic tags in a competitive immunoassay for rabbit immunoglobulin G detection.12 Besides the layered structure, the quantum dots of these materials also exhibit unique electronic and optical properties owing to the quantum confinement and edge effects.13,14 For example, graphene and MoS2 QDs have been prepared and widely used in photovoltaic devices, opto-electronics, and biological analysis.15–18 Recently, BP quantum dots (BPQDs) have been successfully synthesized and exhibited many fascinating properties such as UV-vis absorption, fluorescence, near-infrared photothermal conversion performance, and biocompatibility.19–22 Although the electrochemical behaviors of BP nanomaterials have been tentatively discussed, further application of BPQDs in analytical chemistry is still needed to be investigated.Electrogenerated chemiluminescence (ECL) is a powerful analytical technique, and has been widely used in biochemical analysis. There are many ECL systems, such as tris(2,2′-bipyridyl)ruthenium(II), luminol, acridinium esters, quantum dots, and metal nanoclusters.23–26 Among these ECL systems, Ru(bpy)32+ ECL is widely used in the detection of various samples.27–31 A coreactant is often needed in Ru(bpy)32+ ECL, and numerous analytes, such as oxalate, alkylamines, NADH, and amino acids, can be served as coreactants.32–37 However, the reported coreactants often suffered from weak light emission, low water solubility, and poisonous nature, which make the experimental operation of ECL relatively difficult. Therefore, it is still urgent to search for a new coreactant of Ru(bpy)32+. It was found in our previous work that CdSe QDs can act as a coreactant of Ru(bpy)32+ to generate strong ECL emission under neutral conditions, revealing that semiconductor QDs are the potential coreactants of traditional ECL systems.38 However, the role of BPQDs in ECL investigation has never been explored. Herein, BPQDs were prepared through ultrasonic exfoliation assisted with high speed centrifugation. The prepared BPQDs exhibited excellent catalytic effect on the oxidation of Ru(bpy)32+, and could act as an ECL platform to generate strong light emission. Dopamine exhibited an apparent inhibiting effect on the ECL signal and could be sensitively detected.
2. Experimental
2.1 Chemicals
High-purity black phosphorus crystals were purchased from Nanjing XFNANO Materials Tech. Co., Ltd, China. N-Methyl-2-pyrrolidone (NMP) and Ru(bpy)32+ were purchased from Sigma. All the chemicals were of analytical grade, and were used as received without further purification. Double distilled water was used throughout.2.2 Preparation of BPQDs
5 mg of BP powder was added into 1 mL of NMP in a mortar and then ground for 20 min. The mixture was transferred to a glass vial containing 3 mL of NMP. After it was sealed carefully, the vial was sonicated in an ice-bath for 8 h at the power of 100 W. The resulting dispersion was centrifuged first at 7000 rpm for 20 minutes and then at 10![[thin space (1/6-em)]](https://www.rsc.org/images/entities/char_2009.gif) 000 rpm for 20 minutes. The top 75% of the solution was collected each time.
000 rpm for 20 minutes. The top 75% of the solution was collected each time.
2.3 Characterization of BPQDs
Atomic force microscopy (AFM) was used to determine the topography and the thickness of BPQDs by means of a Veeco DI Nano-scope MultiMode V system. Transmission electron microscopy (TEM) and high-resolution TEM (HRTEM) were carried out using a JEOL ARM-200F field-emission transmission electron microscope with an acceleration voltage of 200 kV. The size distribution was determined on a Nano-Z zeta potential analyzer. The Raman spectra were collected on a LABRAM-HR confocal laser micro Raman spectrometer 750 K with 514 nm excitation at a laser power of 0.5 mW at room temperature.2.4 Preparation of BPQD modified electrode
A glassy carbon electrode (GCE) with 3 mm diameter was mechanically polished with alumina pastes of 0.3 μm, and cleaned thoroughly in an ultrasonic cleaner with alcohol and water sequentially. Then, the electrode was cycled in 1 mM K3Fe(CN)6 solution between −0.20 and 0.60 V (vs. SCE) at a potential scan rate of 100 mV s−1 until a pair of reversible CV peaks was obtained, indicating that the surface of GCE was cleaned. After it was dried by blowing N2, 10 μL of BPQD suspension was spread on the working area of GCE and dried at the room temperature to fabricate a BPQD modified GCE (denoted as BPQDs/GCE).2.5 Electrochemical and ECL measurements
Electrochemical measurements were recorded with a CHI 660D electrochemical workstation (CH Instruments Co., China). A conventional three-electrode system was adopted, including a BPQDs/GCE as the working electrode, a platinum wire as the counter electrode and a saturated calomel electrode (SCE) as the reference electrode, respectively. Electrochemical impedance spectroscopy (EIS) was carried out at open circuit potential in 0.1 mol L−1 KCl solution containing K3[Fe(CN)6]/K4[Fe(CN)6] (5 mM, 1![[thin space (1/6-em)]](https://www.rsc.org/images/entities/char_2009.gif) :
:![[thin space (1/6-em)]](https://www.rsc.org/images/entities/char_2009.gif) 1). The frequency range was selected as 0.01 Hz–100 kHz, and the potential amplitude was 5 mV. The ECL measurement was carried out on a model MPI-M electrochemiluminescence analyzer (Xi'An Remax Electronic Science & Technology Co. Ltd, China) at room temperature, and the voltage of the photomultiplier tube (PMT) was set at −800 V during the detection. A commercial 5 mL cylindroid glass cell was used as the ECL cell and was placed directly in front of the PMT.
1). The frequency range was selected as 0.01 Hz–100 kHz, and the potential amplitude was 5 mV. The ECL measurement was carried out on a model MPI-M electrochemiluminescence analyzer (Xi'An Remax Electronic Science & Technology Co. Ltd, China) at room temperature, and the voltage of the photomultiplier tube (PMT) was set at −800 V during the detection. A commercial 5 mL cylindroid glass cell was used as the ECL cell and was placed directly in front of the PMT.
3. Results and discussion
3.1 Characterization of BPQDs
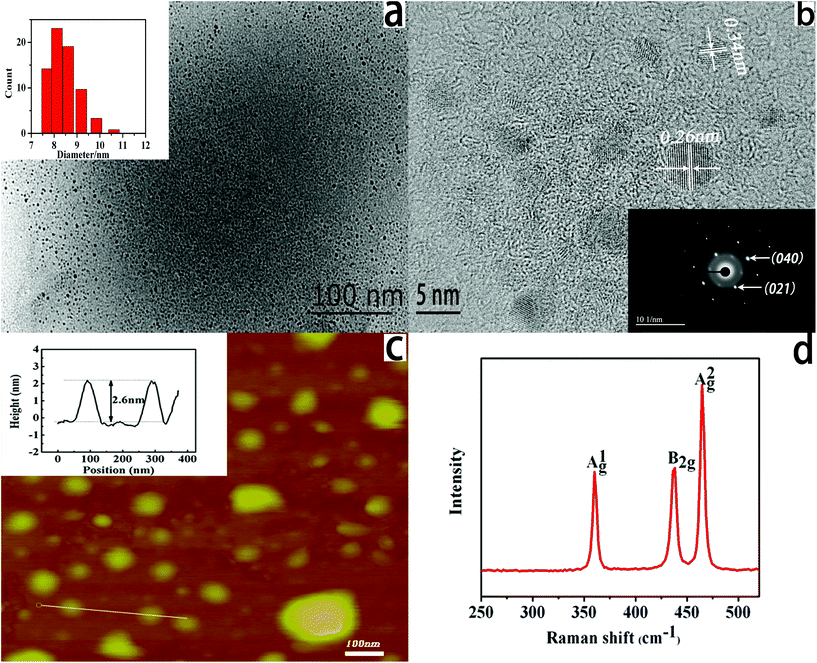
Previous work reported that single- and few-layers of BP nanosheets can be prepared by a liquid exfoliation method. Furthermore, the ultrasmall size of few-layers BP (also called BPQDs) can be obtained through exfoliating bulk BP crystals combining grinding and sonication processes.39–41 The obtained BPQDs exhibited excellent photothermal and memory performances.19,20 However, as far as we know, the role of BPQDs in ECL investigation has never been reported. In order to explore the potential application of BPQDs in ECL, characterization of as-prepared BPQDs is necessary. The morphology, the size distribution, and the thickness of BPQDs were characterized by high-resolution transmission electron microscopy (HRTEM), atomic force microscopy (AFM), and Raman spectroscopy as shown in Fig. 1. TEM images (Fig. 1a) show that BPQDs are uniformly distributed. The average size of BPQDs is determined as 8.2 ± 1.1 nm (the inset of Fig. 1a). HRTEM images of BPQDs (Fig. 1b) show lattice fringes of 0.34 nm and 0.26 nm, which can be ascribed to the (021) and (040) planes of the BP crystal, respectively.19 The good crystallinity of BPQDs is further confirmed by the selective area electron diffraction (SAED) pattern shown in the inset of Fig. 1b.The thickness of BPQDs was characterized by AFM. As seen in Fig. 1c the thickness of BPQDs ranges from 1.6 to 2.7 nm, corresponding to a stack of 3 to 5 layers of BP. Raman spectroscopy is a very powerful and sensitive technique to test crystallographic orientation, stress, chemical composition and phase transition of materials, which was used to characterize the BPQDs in the present work. As shown in Fig. 1d, three prominent peaks can be ascribed to one out-of-plane phonon mode at 361.6 cm−1, and two in-plane modes at 436.7 and 464.8 cm−1, corresponding to Ag1, B2g, and Ag2 modes of orthorhombic crystalline phosphorus.40 These sharp modes confirm that the BPQDs disintegrated from bulk BP crystal maintain their crystalline nature. These modes are blue-shifted around 5.8 cm−1 compared with the bulk BP, which can be assigned to the decrease of the thickness and the lateral dimensions.9
3.2 Electrochemistry and ECL of Ru(bpy)32+ at BPQDs/GCE
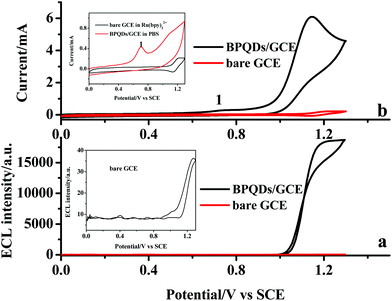
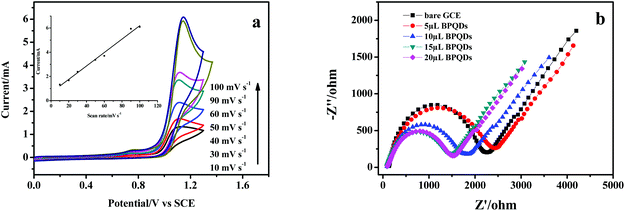
BPQDs were used to modify the glassy carbon electrode to fabricate an electrochemical platform, and Ru(bpy)32+ was selected as a model ECL system to explore the potential application of BPQDs in the ECL field. The electrochemistry and the ECL of Ru(bpy)32+ were comparatively studied at a bare GCE and a BPQDs/GCE in pH 7.4 phosphate buffer solution (PBS) as shown in Fig. 2. It can be found from the inset of Fig. 2a that the anodic ECL is extremely weak at the bare GCE, revealing that a coreactant is necessary for the strong light emission of Ru(bpy)32+.23 No light emission is obtained at the BPQDs/GCE in PBS without Ru(bpy)32+, suggesting that BPQDs can't generate an ECL signal. The strong anodic ECL emission can be obtained at the BPQDs/GCE in the presence of Ru(bpy)32+, and the ECL intensity increases nearly 3 orders of magnitude compared with the bare GCE. The ECL intensities of Ru(bpy)32+ at the BPQDs/GCE were recorded under 15 repeated cyclic voltammetric scans. The results revealed that the ECL intensity is quite stable with a relative standard deviation (RSD) of 1.3% (Fig. S1†). The ECL results suggested that BPQDs is probably a new coreactant for Ru(bpy)32+ to generate a strong anodic ECL. In order to confirm this conclusion, the cyclic voltammetric (CV) behaviors of Ru(bpy)32+ were comparatively investigated at the bare GCE and the BPQDs/GCE as shown in Fig. 2b. The inset of Fig. 2b shows that one pair of CV peaks (1.23/1.14 V) is obtained at the bare GCE, corresponding to the oxidation/reduction processes of Ru(bpy)32+. One apparent anodic CV peak is obtained at 0.70 V (peak 1 in the inset of Fig. 2b) when the BPQDs/GCE was studied in PBS without Ru(bpy)32+, which can be assigned to the oxidation of BPQDs.11 In the presence of Ru(bpy)32+, the oxidation peak of BPQDs is slightly shifted to the positive potential and peak current decreases, revealing the existence of the interaction between Ru(bpy)32+ and BPQDs. The oxidation current of Ru(bpy)32+ increases nearly 5-times while the peak potential shifts from 1.23 to 1.15 V compared with the bare GCE, suggesting that BPQDs can catalyze the electrochemical oxidation of Ru(bpy)32+. According to the mechanism of a coreactant involved ECL system, a strong anodic ECL should result from the electrocatalytic effect of BPQDs.23 Therefore, BPQDs can act as the coreactant of Ru(bpy)32+ to generate strong light emission. Compared with other coreactants, e.g. propylamine (TPA) and CdSe QDs, the ECL of the BPQD/Ru(bpy)32+ system is stronger than that of the CdSe/Ru(bpy)32+ system but weaker than that of the TPA/Ru(bpy)32+ system (Fig. S2†). Considering the highly volatile, poisonous nature and poor solubility of TPA, the lower toxicity of BPQDs might be a promising alternative for TPA in ECL sensors.42The effect of potential scan rate on the oxidation current of Ru(bpy)32+ was studied at the BPQDs/GCE as shown in Fig. 3a. The oxidation current increases linearly with the potential scan rate, revealing that the oxidation of Ru(bpy)32+ is an adsorption-controlled process. The electrochemical impedance spectroscopy (EIS) of GCE modified with different amounts of BPQD suspension was recorded and is shown in Fig. 3b. The EIS of the modified electrode consists of a semicircle at a high frequency range and a line at a low frequency range, demonstrating that the electrode process was controlled by electron transfer at high frequency and by diffusion at low frequency. The diameter of the semicircle decreases with the increase of modified BPQD suspension, revealing that electron transfer through BPQD film is facile, which should be responsible for the electrocatalytical effect of BPQDs.
3.3 Impacting parameters on ECL
Several parameters, such as the concentration of Ru(bpy)32+, the modified amount of BPQD suspension, the pH, and different analytes, can affect ECL intensity. Fig. 4a shows that ECL intensity increases with the increase of Ru(bpy)32+ concentration. In order to decrease the consumption of luminescent reagents, 1.0 × 10⁻⁴ mol L−1 Ru(bpy)32+ was selected, which can fulfill the sensitivity of ECL detection. Fig. 4b reveals that the ECL intensity increased with the increase of BPQD amount. When the amount of modified BPQDs reached 10 μL, the ECL intensity leveled off. Therefore, 10 μL of BPQDs was adopted to modify the electrode. Fig. 4c displays the effect of pH value on the ECL intensity. The most intense ECL signal can be obtained in neutral solution, suggesting that the present ECL platform is suitable for the fabrication of biosensors. The effects of different analytes, such as cysteine, glucose, cytochrome c (Cyt C), dopamine, and ascorbic acid, on ECL intensity were investigated as shown in Fig. 4d. It can be found that dopamine exhibited the most apparent inhibiting effect on ECL intensity, demonstrating that the proposed ECL system can be used in the sensitive detection of dopamine.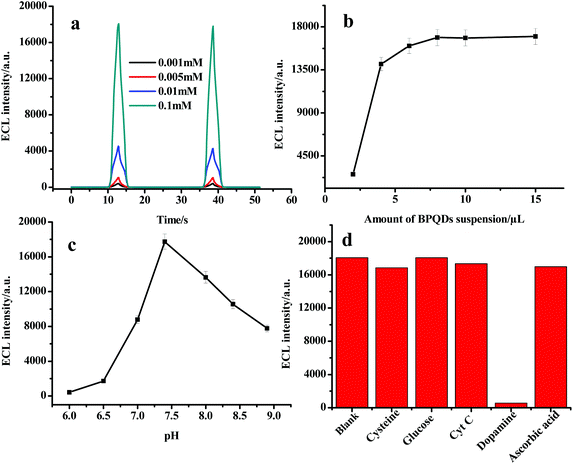 | ||
| Fig. 4 (a) Effect of Ru(bpy)32+ concentration; (b) effect of BPQD amount; (c) effect of pH value; and (d) effects of different analytes. | ||
3.4 Analytical performance of BPQDs/GCE
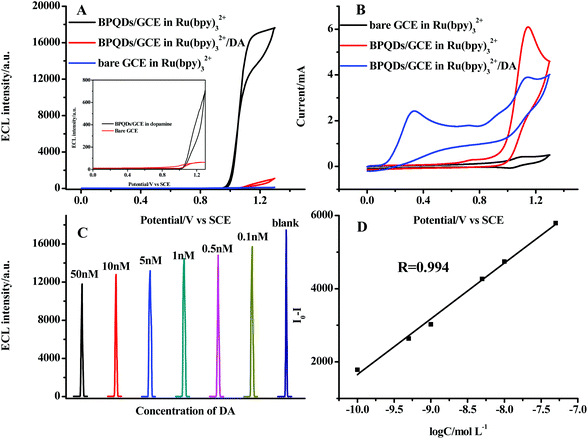
Due to its apparent inhibiting effect on the ECL signal, dopamine was selected as the target analyte to evaluate the analytical performance of the BPQDs/GCE. Fig. 5a shows that the ECL intensity decreased to 5% of the initial ECL intensity when 1 μM dopamine was added, revealing that dopamine can be sensitively detected. Fig. 5b shows that the oxidation current of Ru(bpy)32+ apparently decreased when dopamine was added, suggesting that dopamine can react with the oxidation product of Ru(bpy)32+, which should be responsible for the decrease of ECL intensity. Taking the intensity decrement ΔI = I0 − I (where I0 and I are the ECL intensity without and with DA, respectively) as a function of the change of DA concentration, ΔI is linearly dependent on the logarithm of DA concentration in the range of 1.0 × 10⁻¹⁰–5.0 × 10⁻⁸ mol L−1 (Fig. 5c). The linear regression equation was determined as ΔI = 16![[thin space (1/6-em)]](https://www.rsc.org/images/entities/char_2009.gif) 881 + 1522
881 + 1522![[thin space (1/6-em)]](https://www.rsc.org/images/entities/char_2009.gif) log
log![[thin space (1/6-em)]](https://www.rsc.org/images/entities/char_2009.gif) C, with the regression coefficient of 0.994 (Fig. 5d). The detection limit of dopamine was determined as 2.2 × 10⁻¹¹ mol L−1 (3σ). The stability of the modified electrode was evaluated by recording the ECL responses in 10 nM dopamine. The BPQDs/GCE exhibited good stability, and the relative standard deviation (RSD) was 1.5% for 10 times successive measurements. The reproducibility of the BPQDs/GCE for the detection of dopamine was estimated by determining 10 nM dopamine at six different modified electrodes. Similar ECL responses were obtained at the different modified electrodes and the relative standard deviation was 3.5%, indicating an acceptable reproducibility. The long-term stability of BPQDs/GCE was evaluated by detecting ECL intensity after the BPQDs/GCE was stored under N2-saturated condition at 4 °C. After two weeks of storage, the modified electrode still exhibited good ECL behavior and the ECL intensity decreased to about 90% of its initial response.
C, with the regression coefficient of 0.994 (Fig. 5d). The detection limit of dopamine was determined as 2.2 × 10⁻¹¹ mol L−1 (3σ). The stability of the modified electrode was evaluated by recording the ECL responses in 10 nM dopamine. The BPQDs/GCE exhibited good stability, and the relative standard deviation (RSD) was 1.5% for 10 times successive measurements. The reproducibility of the BPQDs/GCE for the detection of dopamine was estimated by determining 10 nM dopamine at six different modified electrodes. Similar ECL responses were obtained at the different modified electrodes and the relative standard deviation was 3.5%, indicating an acceptable reproducibility. The long-term stability of BPQDs/GCE was evaluated by detecting ECL intensity after the BPQDs/GCE was stored under N2-saturated condition at 4 °C. After two weeks of storage, the modified electrode still exhibited good ECL behavior and the ECL intensity decreased to about 90% of its initial response.
Many ECL systems can be used in the detection of dopamine.43–47 The comparison between the present ECL system with the previously reported systems is shown in Table 1. As can be seen, the proposed method displays higher sensitivity compared with most previous reported results. The applicability of the ECL sensor was evaluated by detecting DA in two kinds of dopamine hydrochloride injections with the standard addition method. The dopamine hydrochloride injections were diluted with 0.1 mol L−1 PBS to appropriate concentrations as real samples for analysis. It can be found from Table S1† that the average recovery ranged from 103% to 105%, showing promising application of the ECL sensor for DA detection.
3.5 ECL mechanism
It has been previously reported that various positively charged quantum dots (e.g. CdTe QDs, g-C3N4, and carbon dots) could be produced through hole injection at the electrode during a positive potential scan.48–50 According to these results, we supposed that BPQDs could be oxidized through hole injection to form positively charged BPQDs (BPQDs˙+). The oxidation process of Ru(bpy)32+ to Ru(bpy)33+ could be catalyzed by BPQDs. Then, BPQDs˙+ reacted with Ru(bpy)33+ to generate the excited state of Ru(bpy)32+ (Ru(bpy)32+*) which emits light at 610 nm. Dopamine could be oxidized at the modified electrode during the anodic potential sweep (Fig. 5B). The oxidation product (DA˙+) reacted with Ru(bpy)33+, which could compete with ECL reactions and result in a decreased ECL signal.43,514. Conclusions
Black phosphorus quantum dots have been synthesized from its bulk crystal by a facile liquid exfoliation method, and have been used in ECL application for the first time. The electrochemical oxidation process of Ru(bpy)32+ can be significantly catalyzed by BPQDs, confirming that BPQDs can act as the coreactant of the Ru(bpy)32+ ECL system to obtain a strong anodic ECL signal under neutral conditions. Dopamine can decrease ECL intensity through reacting with the oxidation product of Ru(bpy)32+. As a result, it can be sensitively detected. The role of BPQDs in the ECL system revealed in the present work suggests that BPQDs is a good ECL platform which possesses great potential in the fabrication of novel ECL biosensors.Conflicts of interest
The authors have no conflicts of interest to declare.Acknowledgements
This work is financially supported by National Natural Science Foundation of China (No. 21575002, 21573212) and the Natural Science Foundation from the Bureau of Education of Anhui Province (No. KJ2015A075, KJ2016A086).References
- P. Miro, M. Audiffred and T. Heine, Chem. Soc. Rev., 2014, 43, 6537–6554 RSC.
- L. K. Li, Y. J. Yu, G. J. Ye, Q. Q. Ge, X. D. Ou, H. Wu, D. L. Feng, X. H. Chen and Y. B. Zhang, Nat. Nanotechnol., 2014, 9, 372–377 CrossRef CAS PubMed.
- H. O. H. Churchill and P. Jarillo-Herrero, Nat. Nanotechnol., 2014, 9, 330–331 CrossRef CAS PubMed.
- F. N. Xia, H. Wang and Y. C. Jia, Nat. Commun., 2014, 5, 4458 CAS.
- M. Buscema, D. J. Groenendijk, S. I. Blanter, G. A. Steele, H. S. J. van der Zant and A. Castellanos-Gomez, Nano Lett., 2014, 14, 3347–3352 CrossRef CAS PubMed.
- A. Favron, E. Gaufres, F. Fossard, A. L. Phaneuf-L'Heureux, N. Y. W. Tang, P. L. Levesque, A. Loiseau, R. Leonelli, S. Francoeur and R. Martel, Nat. Mater., 2015, 14, 826–832 CrossRef CAS PubMed.
- H. T. Yuan, X. G. Liu, F. Afshinmanesh, W. Li, G. Xu, J. Sun, B. Lian, A. G. Curto, G. J. Ye, Y. Hikita, Z. X. Shen, S. C. Zhang, X. H. Chen, M. Brongersma, H. Y. Hwang and Y. Cui, Nat. Nanotechnol., 2015, 10, 707–713 CrossRef CAS PubMed.
- Z. B. Yang, J. H. Hao, S. G. Yuan, S. H. Lin, H. M. Yau, J. Y. Dai and S. P. Lau, Adv. Mater., 2015, 27, 3748–3754 CrossRef CAS PubMed.
- H. Liu, A. T. Neal, Z. Zhu, Z. Luo, X. F. Xu, D. Tomanek and P. D. Ye, ACS Nano, 2014, 8, 4033–4041 CrossRef CAS PubMed.
- R. X. Fei and L. Yang, Nano Lett., 2014, 14, 2884–2889 CrossRef CAS PubMed.
- L. Wang, Z. Sofer and M. Pumera, ChemElectroChem, 2015, 2, 324–327 CrossRef CAS.
- C. C. Mayorga-Martinez, N. M. Latiff, A. Y. S. Eng, Z. Sofer and M. Pumera, Anal. Chem., 2016, 88, 10074–10079 CrossRef CAS PubMed.
- K. A. Ritter and J. W. Lyding, Nat. Mater., 2009, 8, 235–242 CrossRef CAS PubMed.
- S. N. Baker and G. A. Baker, Angew. Chem., Int. Ed., 2010, 49, 6726–6744 CrossRef CAS PubMed.
- Y. Li, Y. Hu, Y. Zhao, G. Q. Shi, L. E. Deng, Y. B. Hou and L. T. Qu, Adv. Mater., 2011, 23, 776–780 CrossRef CAS PubMed.
- G. Konstantatos, M. Badioli, L. Gaudreau, J. Osmond, M. Bernechea, F. P. G. de Arquer, F. Gatti and F. H. L. Koppens, Nat. Nanotechnol., 2012, 7, 363–368 CrossRef CAS PubMed.
- Q. Liu, B. D. Guo, Z. Y. Rao, B. H. Zhang and J. R. Gong, Nano Lett., 2013, 13, 2436–2441 CrossRef CAS PubMed.
- H. D. Ha, D. J. Han, J. S. Choi, M. Park and T. S. Seo, Small, 2014, 10, 3858–3862 CrossRef CAS PubMed.
- X. Zhang, H. M. Xie, Z. D. Liu, C. L. Tan, Z. M. Luo, H. Li, J. D. Lin, L. Q. Sun, W. Chen, Z. C. Xu, L. H. Xie, W. Huang and H. Zhang, Angew. Chem., Int. Ed., 2015, 127, 3724–3728 CrossRef.
- Z. B. Sun, H. H. Xie, S. Y. Tang, X. F. Yu, Z. N. Guo, J. D. Shao, H. Zhang, H. Huang, H. Y. Wang and P. K. Chu, Angew. Chem., Int. Ed., 2015, 127, 11688–11692 CrossRef.
- L. F. Gao, J. Y. Xu, Z. Y. Zhu, C. X. Hu, L. Zhang, Q. Wang and H. L. Zhang, Nanoscale, 2016, 8, 15132–15136 RSC.
- H. U. Lee, S. Y. Park, S. C. Lee, S. Choi, S. Seo, H. Kim, J. Won, K. Choi, K. S. Kang, H. G. Park, H. S. Kim, H. R. An, K. H. Jeong, Y. C. Lee and J. Lee, Small, 2016, 12, 214–219 CrossRef CAS PubMed.
- L. Z. Hu and G. B. Xu, Chem. Soc. Rev., 2010, 39, 3275–3304 RSC.
- H. Wei and E. K. Wang, Trends Anal. Chem., 2008, 27, 447–459 CrossRef CAS.
- P. Bertoncello and R. J. Forster, Biosens. Bioelectron., 2009, 24, 3191–3200 CrossRef CAS PubMed.
- R. J. Forster, P. Bertoncello and T. E. Keyes, Annu. Rev. Anal. Chem., 2009, 2, 359–385 CrossRef CAS PubMed.
- W. J. Miao and A. J. Bard, Anal. Chem., 2003, 75, 5825–5834 CrossRef CAS PubMed.
- E. G. Hvastkovs, M. So, S. Krishnan, B. Bajrami, M. Tarun, I. Jansson, J. B. Schenkman and J. F. Rusling, Anal. Chem., 2007, 79, 1897–1906 CrossRef CAS PubMed.
- F. Deiss, C. N. LaFratta, M. Symer, T. M. Blicharz, N. Sojic and D. R. Walt, J. Am. Chem. Soc., 2009, 131, 6088–6089 CrossRef CAS PubMed.
- N. Egashira, S. I. Moria, E. Hifumi, Y. Mitoma and T. Uda, Anal. Chem., 2008, 80, 4020–4025 CrossRef CAS PubMed.
- J. Zhang, H. L. Qi, Y. Li, J. Yang, Q. Gao and C. X. Zhang, Anal. Chem., 2008, 80, 2888–2894 CrossRef CAS PubMed.
- Z. J. Lin, X. M. Chen, T. T. Jia, X. D. Wang, Z. X. Xie, M. Oyama and X. Chen, Anal. Chem., 2009, 81, 830–833 CrossRef CAS PubMed.
- I. S. Shin, S. W. Bae, H. Kim and J. I. Hong, Anal. Chem., 2010, 82, 8259–8265 CrossRef CAS PubMed.
- Y. W. Chi, Y. Q. Dong and G. N. Chen, Anal. Chem., 2007, 79, 4521–4528 CrossRef CAS PubMed.
- M. Zorzi, P. Pastore and F. Magno, Anal. Chem., 2000, 72, 4934–4939 CrossRef CAS PubMed.
- H. N. Choi, S. H. Cho and W. Y. Lee, Anal. Chem., 2003, 75, 4250–4256 CrossRef CAS PubMed.
- K. F. Chow, F. Mavré, J. A. Crooks, B. Y. Chang and R. M. Crooks, J. Am. Chem. Soc., 2009, 131, 8364–8365 CrossRef CAS PubMed.
- Y. P. Dong, T. T. Gao, Y. Zhou, L. P. Jiang and J. J. Zhu, Sci. Rep., 2015, 5, 15392 CrossRef CAS PubMed.
- J. R. Brent, N. Savjani, E. A. Lewis, S. J. Haigh, D. J. Lewis and P. O'Brien, Chem. Commun., 2014, 50, 13338–13341 RSC.
- J. Kang, J. D. Wood, S. A. Wells, J. H. Lee, X. L. Liu, K. S. Chen and M. C. Hersam, ACS Nano, 2015, 9, 3596–3604 CrossRef CAS PubMed.
- P. Yasaei, B. Kumar, T. Foroozan, C. H. Wang, M. Asadi, D. Tuschel, J. E. Indacochea, R. F. Klie and A. Salehi-Khojin, Adv. Mater., 2015, 27, 1887–1892 CrossRef CAS PubMed.
- N. M. Latiff, W. Z. Teo, Z. Sofer, A. C. Fisher and M. Pumera, Chem. – Eur. J., 2015, 21, 13991–13995 CrossRef CAS PubMed.
- L. L. Xue, L. H. Guo, B. Qiu, Z. Y. Lin and G. N. Chen, Electrochem. Commun., 2009, 11, 1579–1582 CrossRef CAS.
- M. L. Yang, X. M. Yang, M. L. Wang and R. Jiang, Anal. Methods, 2017, 9, 2334–2341 RSC.
- D. H. Yuan, S. H. Chen, R. Yuan, J. J. Zhang and X. F. Liu, Sens. Actuators, B, 2014, 191, 415–420 CrossRef CAS.
- R. Cui, Y. P. Gu, L. Bao, J. Y. Zhao, B. P. Qi, Z. L. Zhang, Z. X. Xie and D. W. Pang, Anal. Chem., 2012, 84, 8932–8935 CrossRef CAS PubMed.
- S. F. Liu, X. Zhang, Y. M. Yu and G. Z. Zou, Anal. Chem., 2014, 86, 2784–2788 CrossRef CAS PubMed.
- G. D. Liang, S. F. Liu, G. Z. Zou and X. L. Zhang, Anal. Chem., 2012, 84, 10645–10649 CrossRef CAS PubMed.
- C. M. Cheng, Y. Huang, J. Wang, B. Z. Zheng, H. Y. Yuan and D. Xiao, Anal. Chem., 2013, 85, 2601–2605 CrossRef CAS PubMed.
- L. Y. Zheng, Y. W. Chi, Y. Q. Dong, J. P. Lin and B. B. Wang, J. Am. Chem. Soc., 2009, 131, 4564–4565 CrossRef CAS PubMed.
- Y. T. Liu, Q. B. Wang, J. P. Lei, Q. Hao, W. Wang and H. X. Ju, Talanta, 2014, 122, 130–134 CrossRef CAS PubMed.
Footnote |
| † Electronic supplementary information (ESI) available. See DOI: 10.1039/c7an01617d |
| This journal is © The Royal Society of Chemistry 2018 |

