An electrochemical cell with Gortex-based electrodes capable of extracting pure hydrogen from highly dilute hydrogen–methane mixtures†
Klaudia
Wagner
*,
Prerna
Tiwari
,
Gerhard F.
Swiegers
 * and
Gordon G.
Wallace

Intelligent Polymer Research Institute and ARC Centre of Excellence for Electromaterial Science, University of Wollongong, Wollongong, NSW 2522, Australia. E-mail: kwagner@uow.edu.au; swiegers@uow.edu.au
First published on 7th December 2017
Abstract
In this work we report a novel liquid–acid electrochemical cell containing Gortex-based gas diffusion electrodes, layered with suitable catalysts and current collectors, that is capable of sustainably extracting pure hydrogen from methane mixtures containing as little as 5% hydrogen. The origin of its efficiency appears to derive from the solid–liquid interface between the solid Gortex electrodes and the liquid electrolyte, as well as the high proton conductivity of the electrolyte. This interface and electrolyte exhibit an efficiency for reaction that greatly exceeds that achieved by the comparable solid–solid interface and proton conductor in Proton Exchange Membrane Fuel Cell (PEMFC) technology. We report hydrogen yields and recovery by the cell from a range of methane–hydrogen mixtures. Electrochemical impedance spectroscopy has been used to characterise the cell and to illuminate the system limitations.
Broader contextNumerous gas and electric utilities are actively pursuing “Power-to-Gas” (P2G) technology, which involves using excess renewable power to manufacture hydrogen gas that is then injected into existing natural gas pipelines. Amongst others, this approach: (i) monetizes excess renewable energy, (ii) allows for greater penetration of renewable energy on electrical grids, and (iii) progressively decarbonizes natural gas pipelines. It is envisaged that up to 10% by volume of many natural gas pipelines will, in future, be renewable hydrogen. At present, three technologies exist for the selective downstream extraction of pure hydrogen from mixtures of hydrogen and natural gas. None of these can viably extract hydrogen if its proportion is less than 20%. One method is electrochemical and based on Polymer Electrolyte Membrane Fuel Cell (PEMFC) technology. While it forms the basis of several new high technology companies, a single cell using this process can only successfully extract hydrogen from natural gas mixtures containing >50% hydrogen. In this work we report a liquid–acid electrochemical cell that can sustainably extract pure hydrogen from methane mixtures containing as little as 5% hydrogen. As natural gas is predominantly methane, the cell offers the prospect of downstream extraction of pure, renewable hydrogen close to the point of end use, from P2G natural gas pipelines. |
Introduction
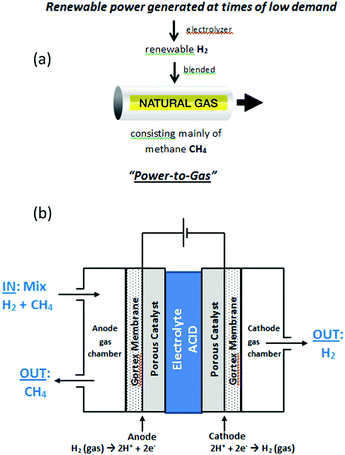
Blending hydrogen into the existing natural gas pipeline network forms the basis of so-called “Power-to-Gas” (P2G) technology, which aims to convert excess, unwanted renewable electrical power into gaseous hydrogen, as a fuel (Fig. 1(a)).1 The idea is that the natural gas, enriched with renewable hydrogen, can still be used for heating and other purposes, reducing the emissions of carbon dioxide, whilst simultaneously allowing for a greater and more efficient deployment of renewable energy sources on electrical grids. The natural gas network offers a potentially vast storage medium for renewable hydrogen; in the USA alone, the network comprises of 2.44 million miles of pipe.1a At the present time, renewable hydrogen can be routinely injected into existing gas pipelines at 5–10% hydrogen by volume without need for modifications to the network.1 For the injection of 10–50% hydrogen, more significant issues would have to be addressed such as the conversion of household appliances, or an increase in compression capacity along distribution mains serving industrial users. Blends containing more than 50% hydrogen would face more notable safety issues, requiring engineering modifications to the system. Accordingly, renewable hydrogen in the range 5–10% by volume is readily accommodated in pipeline natural gas and it is envisaged that up to 10% by volume of many natural gas pipelines will, in future, be renewable hydrogen.Blending hydrogen into natural gas pipeline networks has also been proposed as a means of delivering pure hydrogen to markets,1a using separation and purification technologies downstream to extract the hydrogen close to the point of end use. Three gas-separation technologies are presently available to extract hydrogen from mixtures in natural gas pipelines: (a) pressure swing adsorption (PSA),2 (b) membrane separation (MS),3 and (c) electrochemical hydrogen separation (EHS, or hydrogen pumping).4
PSA is reported to be technically capable of operating with low hydrogen concentrations down to a theoretical minimum of 20%. In practice however, the PSA units become un-viably large as the impurities in the gas increase.2
MS works very efficiently with high concentrations of hydrogen, but recovery of hydrogen at lower concentrations requires a steeper pressure differential across the membrane, which is a significant technical challenge.3
In EHS purification systems, an electrochemical cell is used. The cell is based on Proton Exchange Membrane Fuel Cell (PEMFC) technology.4 The gas mixture is generally passed into the anode of the cell, where electrochemical oxidation of hydrogen to protons takes place. The protons are then transported to the cathode, through an intervening solid-state Proton Exchange Membrane (PEM) that acts as the electrolyte in the cell. At the cathode, the protons are reduced, to thereby generate pure hydrogen.4
Electrochemical separation of this type has, at present, only been demonstrated in prototypes that have been tested at a laboratory scale.5 These demonstrations have shown that the use of such electrochemical pumps in single cell form are limited to gas mixtures in which the hydrogen content is above 50%.6 At lower hydrogen contents, proton transport to the cathode becomes a limiting process, which causes a substantial and unviable increase in energy consumption. These mass-transport limitations make PEMFC-type systems unsuitable for extracting pure hydrogen from more dilute sources, such as the 5–10% hydrogen-enriched natural gas produced in “Power-to-Gas”.
Abdulla and co-workers7 have further reported that, in the case of a 50% hydrogen mixture, a single stage PEMFC system can only recover 65% of the hydrogen and then with an energy efficiency of 50%. Energy efficiencies of >90% with >98% hydrogen recovery can be achieved using a multistage system consisting of 20 units, with a voltage of 0.65 V each.7
An additional problem is that pipeline gases typically have to be exceedingly dry.1,8 However, PEMFC systems require their feedstock gases to be humidified in order to provide sufficient proton conductivity by the Proton Exchange Membrane. A humidification system must therefore be incorporated in the gas inlet to the cell, with a corresponding humidity removal system in the gas outlet, where the H2-depleted natural gas would return to the pipeline. For this reason, cells with proton-conducting ceramic membrane have also been tested for hydrogen purification using the same essential electrochemical mechanism.8 Cells of this type employ elevated temperatures but, even so, the wider practical application is limited by insufficient protonic conductivity in the ceramic membrane.8 Without such conductivity, it is impossible to achieve high efficiency and good stability. CO2 exposure, for example, leads to a deterioration of the mechanical properties of this membrane.8
In this study we report efficient electrochemical purification and recovery of hydrogen, in a single step, from even exceedingly dilute mixtures of hydrogen in methane, as low as 5% hydrogen in methane. The purification cell contained two porous, Gortex-based electrodes, coated with suitable catalysts and current collectors (Fig. 1(b)). A liquid electrolyte of 1 M H2SO4 was used. Hydrogen-containing methane gas blends were passed through an anode gas chamber of the cell (Fig. 1(b)). Hydrogen was selectively extracted from the methane mixture in the gas chamber and oxidized at the three-way solid–liquid–gas interface between the Gortex electrode, the porous catalyst layer, and the liquid electrolyte. The product of this reaction, protons (H+), then flowed to the cathode through the 1 M H2SO4 electrolyte, which was notably more conductive than an equivalent PEM or proton conducting ceramic electrolyte. At the cathode, the protons were reduced to form pure hydrogen (free of methane), which was collected from a cathode gas chamber. The methane acted purely as a carrier for the hydrogen and did not interfere or become interposed in the process. Studies aimed at characterising and understanding the remarkable efficiency of this cell under such highly dilute conditions are also described.
Results and discussion
The use of expanded PTFE (ePTFE) membranes (‘Gortex’) as electrode substrates
In several recent studies, a novel material, Gortex, has been employed as an electrode substrate.9,10 Gortex, also known as expanded PTFE (or ePTFE) comprises of a hydrophobic, porous network of microscopically-small Teflon filaments.11 Since its discovery in 1969, ePTFE has been used in numerous applications, including as a water-resistant textile, filtration material, sealant, polymer coating, and within medical devices.12 The key utility of Gortex is that it combines high porosity with high hydrophobicity to thereby allow the passage of gases but not aqueous liquids. For example, in textile applications Gortex allows the water vapour from a wearer's body to pass through, but not liquid rain that may fall on the textile.While Gortex has long been used as an outermost “water-exclusion” layer in some air electrodes, it has only recently been considered as an electrode substrate in its own right.9,10 A key, promising feature of Gortex is that it has a significantly more uniform and hydrophobic pore structure than is possible in present-day, conventional gas diffusion electrodes. Thus, as recently reported by us,9 finely-pored Gortex membranes may be used to fabricate gas diffusion electrodes that do not flood until the excess of the water-side pressure over the gas-side pressure is 4 bar. This is more than an order of magnitude greater than conventional gas diffusion electrodes, which typically flood at overpressures of <0.1 bar.13 It drastically supersedes the cutting edge in conventional gas diffusion electrodes, which display flooding resistance up to 0.2 bar.14 Highly flood-resistant electrodes of this type potentially open up the possibility of substantially decreasing the energy consumption of several industrial electrochemical processes, by bathing their unproductive counter-electrodes in a depolarising gas.13 This field has, to date, been blocked in practice by the low resistance of conventional gas diffusion electrodes to flooding. Gortex substrates have also been successfully deployed as novel, highly active fuel cell and electrolyser gas diffusion electrodes.9,10
In this work we have fabricated and studied a liquid acid cell containing two Gortex-based gas diffusion electrodes. In each of these, the Gortex substrate had been coated with a catalyst layer containing 10% Pt/carbon black, dispersed poly(tetra-fluoroethylene) (PTFE) as a binder, and a fine Ni mesh as a current carrier (as described in the Experimental section). Polypropylene-backed Preveil™ expanded PTFE (ePTFE) (‘Gortex’) membranes, produced by General Electric Energy were used in all experiments. These membranes were resistant to flooding at overpressures of >4 bar.9 The Pt loading was 0.05 mg cm−2, which is unusually low when compared to PEMFC electrochemical hydrogen separation systems.4
Initial experiments: pure hydrogen supplied at the anode
During the initial experiments, mixtures of hydrogen and methane at atmospheric pressure were allowed to slowly flow through the anode gas compartment of the test cell. Each of the gases employed were supplied, in high purity form, from attached cylinders. Pure hydrogen was collected at the cathode. The cell was designed to ensure that each Gortex-based gas diffusion electrode had a 1 cm2 geometric area. The anode and cathode electrodes were placed in a facing disposition to each other, separated by an inter-electrode gap of 3 mm that was filled with liquid electrolyte (1 M H2SO4). No diaphragm or ionomer barrier was present in the gap between the electrodes in the cell.In general, only small amounts of external power are required to carry out the hydrogen oxidation reaction (HOR, eqn (1)) at one electrode in an electrochemical cell and the hydrogen evolution reaction (HER, eqn (2)) at the other. This arises because only a low polarization of the electrodes, with an accompanying low theoretically voltage, is needed to transport protons thought the electrolyte between the electrodes.
| HOR(anode) H2(gas) → 2H+ + 2e− | (1) |
| HER(cathode) 2H+ + 2e− → H2(gas) | (2) |
The minimum required potential can be calculated from the Nernst equation (eqn (3)):15
 | (3) |
For a mixture of 5% hydrogen (0.05) in methane introduced into a cell of the above-described type at 25 °C, a voltage of only 0.076 V is theoretically required to drive the protons from the anode to the cathode (eqn (4)):15
 | (4) |
The conductivity of sulfuric acid (H2SO4) in 25 °C is reported to be 0.35 S cm−1 for 1 M, and 0.83 S cm−1 for 4.5 M sulfuric acid.16 However, the latter high H2SO4 concentration can lead to an increase in sulfate/bisulfate adsorption on, especially, Pt catalyst surfaces, thereby blocking catalytic sites.17 For this reason experiments were performed using 1 M H2SO4 as electrolyte.
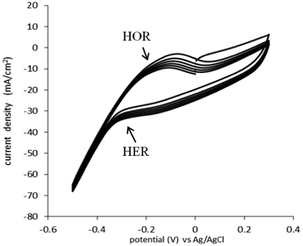
The HOR and HER, for the catalyst used (0.05 mg cm−2 Pt on Vulcan carbon black, at both the anode and the cathode) were determined in 1 M H2SO4 (Fig. 2). In this experiment, the cell was configured in “fuel cell” mode, with the anode gas chamber filled with pure hydrogen and the cathode gas chamber filled with pure oxygen. To determine the actual potential, the reactions were monitored against a Ag/AgCl reference electrode placed in the top of the cell.
The HOR trace is visible on the anodic scan, at the broad peak at −0.23 V vs. Ag/AgCl. The onset of hydrogen evolution can be seen to commence from −0.33 V vs. Ag/AgCl (−0.12 vs. NHE) (Fig. 2). This is expected and similar to the electrochemistry of the HOR and HER on a platinum metal electrode.18
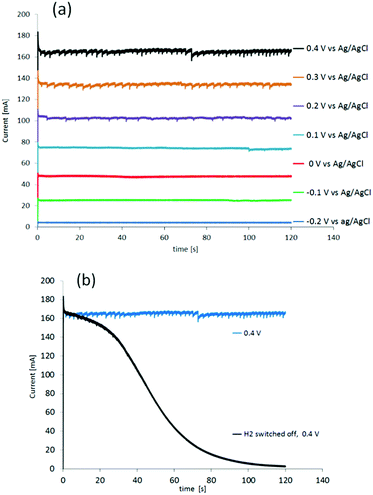
The performance of the cell was then determined under potentiostatic conditions, measuring the current at applied potentials from −0.2 V to 1.0 V, vs. Ag/AgCl (Fig. 3(a)). Pure hydrogen with a flow of 10 ml min−1, was supplied to anode compartment.
The first gas generated at the cathode was observed at a potential of −0.1 V, which is about 100 mV above the oxidation potential of hydrogen in this cell (Fig. 3(a)). Control measurements were performed by switching off the hydrogen flow to the anode at all potentials (depicted only for 0.4 V in Fig. 3(b), black line). During the first 10 s after switching off the hydrogen flow to the anode (Fig. 3(b), black line), the current stayed at the same level as the current recorded under constant hydrogen flow (Fig. 3(b), blue line). Thereafter it decayed, falling to zero after 100 s. During the first 40 s, gas still evolved from the cathode, causing visible “spikes” at the beginning of the black line in Fig. 3(b). This current decay to zero after turning off the hydrogen flow to the anode corresponds to the last hydrogen/protons being consumed. In other words, the currents from both reactions, HOR (anode) and HER (cathode), dwindle and are no longer present after the remaining hydrogen is consumed at the anode and protons are no longer delivered to the cathode for the reduction. The current observed at the 100 s mark after switching off the hydrogen flow to the anode is likely due to gas still present in the tubing, gas dissolved in the sulfuric acid, and protons in-train between the electrodes.19
Electrochemical activation of the electrodes with pure hydrogen
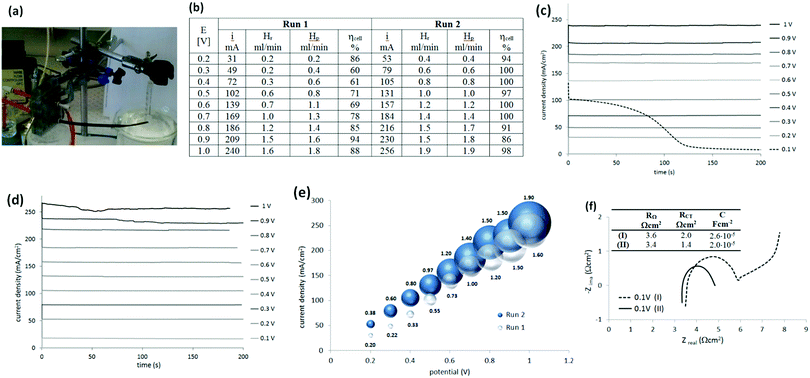
After this first examination of the cell responses, it was decided to continue the work with a two-electrode configuration, with the potential controlled against the cathode. Measurements were performed similarly (Fig. 4(a)) under potentiostatic conditions, with pure hydrogen supplied to the anode compartment. Potentials between 0.1 V and 1 V were applied and the current was measured over 3 min (Fig. 4(b and c)). The gas produced at the cathode compartment was collected during the measurements. The photo in Fig. 4(a) shows the cell and the gas collection setup.Recovered hydrogen Hr was collected from the cathode during this test using a graduated water-filled syringe that was sealed at its top (shown on the right in Fig. 4(a)). From the volume of collected gas, the cell efficiency was calculated from eqn (5), with the results given in Fig. 4(b).
 | (5) |
It was noticed that the current and the amount of recovered hydrogen was lower during the first potentiostatic set of measurements, called here Run 1, when compared to the following one (Run 2). This difference was particularly obvious at lower current density. Additionally, the very first chronoamperogram at 0.1 V in Run 1 (Fig. 4(c), dashed line) always started from a higher current (∼100 mA cm−2) and gradually decreased to a steady state current (6–7 mA).
To understand this phenomena and the origin of the cell improvement after electrochemical activation, electrochemical impedance spectroscopy (EIS) was undertaken. Two measurements were compared:
(I) was taken after establishing the hydrogen flow at the anode (open circuit potential at −0.8 V) and at the very first applied potential of 0.1 V (before Run 1, Fig. 4(f), dashed line); and
(II) after two sets of electrochemistry measurements, returning again to the potential 0.1 V (after Run 2, Fig. 4(f), solid line).
Nyquist plots of the measurements (Fig. 4(f)) show some differences. In general, the intercept of the arc with the real axis at the high-frequency end represents the total ohmic resistance RΩ, which is the sum of the contributions from uncompensated contact resistance and the ohmic resistance of cell components, such as electrolyte (electrolyte ionic resistivity) and electrodes. After electrochemical activation this resistance (RΩ) decreased only slightly from 3.6 to 3.4 Ω (5%). The second intercept with the real axis, was the sum of ohmic resistance and charger transfer resistance RΩ + RCT at the electrodes (called also kinetic resistance).20 Only one arc was present on the spectrum but it represented both electrodes. It was clear, that after activation, the charger transfer resistances of the HOR and HER decreased by ca. 30%, from 2.0 Ω cm2 to 1.4 Ω cm2.
One more difference was observed between these two plots. When the potential of 0.1 V was applied for the first time (Fig. 4(f), dashed line), an additional response at the lower frequency part was present. This was an indication of a diffusion-controlled process, limited by proton diffusion to anode. However, after the cell was tested electrochemically and the flux of the protons was established, this diffusion resistance disappeared. A higher capacitance (C; 2.6 × 10⁻⁵ F cm−2versus 2.0 × 10⁻⁵ F cm−2) observed at the electrode interfaces at the beginning of cell operation, was also in agreement with the higher current recorded when the potential was first applied (Fig. 4(c), dashed line). The origin of this current is not clear. It may be a simple result of electrical double-layer rearrangement at the electrode interfaces and activation of the so-called three-way solid–liquid–gas interface that is formed in gas diffusion electrodes. It may be also an oxidation of impurities.
It could be concluded from EIS that electrochemical activation of the electrodes reduced all resistances in the cell. Significant improvements in the charger transfer resistance at the electrodes were, especially, noted. This may be due to the combined effect of improving the: (i) electron conducting pathways upon applying the potentials (solid – both electrodes, electrochemical cleaning, increased active surface area), (ii) ion-conduction path (liquid-improved wettability, establishing diffusion) or (iii) more efficient gas penetration (anode), or gas evolution (cathode) as the microstructure of the electrodes improved.
The solubility of hydrogen in H2SO4 may also have contributed to the lowering of the cell performance at the beginning. It has been reported that the solubility of hydrogen in 1 M H2SO4 at 30 °C is 14.3 ml dm−3,19 which will initially consume evolved hydrogen in proportions of: 50% at 10 mA cm−3, 25% at 20 mA cm−3 and 17% in 30 mA cm−3 (for the cell volume of 2.7 cm3). It would further be expected, that this solubility would affect the amount of hydrogen evolved until the solution of sulfuric acid became saturated with hydrogen. This may explain the apparent low cell performance at the lower current density (e.g. Run 1 vs. Run 2 in Fig. 4(b)). These conclusions are supported by the fact that the cell efficiency was close to 100% across the entire current range density during the second set of electrochemical tests.
Methane blends containing 25–100% hydrogen
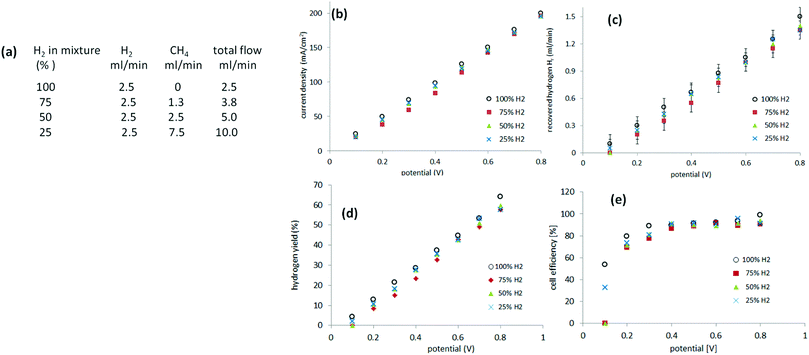
Recovery of pure hydrogen from mixtures with methane was first attempted from mixtures of 75%, 50% and 25% hydrogen. Experiments were performed, as described previously, in a two-electrode system. Instead of supplying the anode of the cell with pure hydrogen, a gas mixture of hydrogen and methane was provided. The relative flow (of hydrogen) was kept constant at 2.5 ml min−1 with varying amounts of methane incorporated (Fig. 5(a)). The current was measured between 0.1 V and 0.8 V to avoid cell starvation (Fig. 5(b)). The gas generated at the cathode was collected (Fig. 5(c)).Hydrogen yield ηH is defined according eqn (6), as the ratio of the hydrogen recovered Hr to the feedstock hydrogen supplied, Hf.
 | (6) |
Methane crossover to the cathode and methane reactivity at the anode
In the above experiments, no gas whatsoever evolved at the cathode in the absence of an applied voltage over the cell. The methane passing through the anode therefore did not migrate to and through the cathode under these conditions. Also: no difference was observed in the recorded current relative to the amount of hydrogen collected from the cathode, when comparing pure hydrogen with the methane mixtures in the 75–25% range (Fig. 5). Methane therefore did not react at the anode.Additional experiments were performed to test whether methane crossed-over to the cathode or reacted at the anode. A flow of pure methane (10 ml min−1 or 50 ml min−1) with or without applied potential was found to generate no current in the cell and no gas evolution at the cathode (Table S1, ESI,† experiments 1–4). A mixture of 10 ml min−1 methane and 10 ml min−1 hydrogen, which produced current in the cell and gas generation at the cathode, gradually stopped producing current and gas when the hydrogen flow was halted (Table S1, ESI,† experiments 5 and 6). Once the remaining hydrogen had been consumed, the current fell to zero (with the methane flow still on). It can be concluded that methane is inert to reaction in the cell and does not crossover to cathode through the electrolyte.
Methane blends containing 5–25% hydrogen
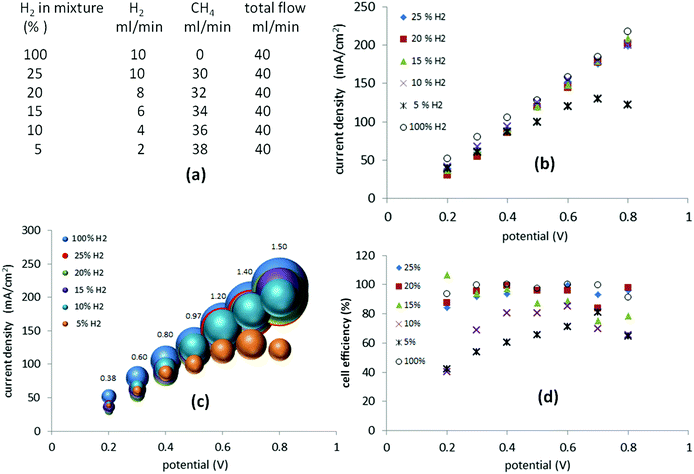
Still more dilute mixtures of hydrogen and methane (25–5%) were then investigated. In this set of experiments, the total flow of the gas mixture was kept constant at 40 ml min−1 (Fig. 6(a)). When a potential between 0.2 V and 0.8 V was applied, the current required was, essentially, identical to that of the mixtures of 25%, 20%, 15% and 10% hydrogen (Fig. 6(b)). In the case of a 5% mixture, the current recorded between 0.2 V and 0.4 V followed the previous trend but above 0.4 V it started to decay as cell starvation set in (Fig. 6(b)).The cell efficiencies for the 15–25% mixtures (Fig. 6(d)) were similar to the 25–75% mixtures. The 10% mixture yielded optimum efficiencies of 80–85% between 0.4 V and 0.6 V, while the 5% mixture operated at 71–78% efficiency at 0.6–0.7 V, approaching the lowest value of 40% at 0.2 V (Fig. 6(d)).
Further studies on methane blends containing 5% hydrogen
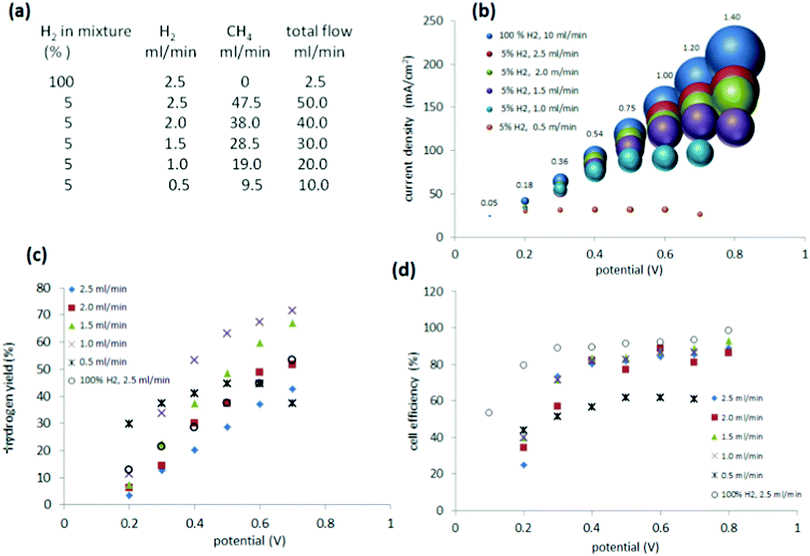
Based on the above results, it was clear that the 5% mixture suffered from lower performance at higher current densities, which indicated a problem with cell starvation. Cell starvation occurs when hydrogen at the anode is consumed faster than it is supplied. To investigate in more detail and optimise the performance of the cell with the 5% mixture, measurements were undertaken with different flow rates to the anode (0.5 ml min−1 to 2.5 ml min−1) (Fig. 7(a)).As evidenced by the current (Fig. 7(b)), the amount of hydrogen fed into the anode is crucial for proper maintenance of the cell. When compared to pure hydrogen supplied at the 2.5 ml min−1, the mixture of 5% hydrogen, which was delivered to the cell at the same flow rate (2.5 ml min−1) displayed only a minor decrease in current and gas production at the cathode (Fig. 7(b)). However reducing the rate of flow to the anode (to below 2.5 ml min−1 hydrogen, down to 0.5 ml min−1) had a definite impact, decreasing the current and the quantity of gas produced at the cathode. At the lowest flow rate of 0.5 ml min−1, the current and evolved gas reached a steady state condition.
Thus, a low proportion of hydrogen in a methane blend (for example, 5% hydrogen), may be compensated by merely increasing the flow rate of the blend through the cell. The key feature that is critical to high performance is the net flow rate of hydrogen through the cell and not the dilution of the hydrogen in the methane carrier.
The hydrogen yield ηH showed, as expected, an increased trend with slower flow to the anode, reflecting a more efficient consumption of the supplied hydrogen (Fig. 7(c)). A ηH of 72% was achieved for a flow of 1 ml min−1 at 0.7 V.
Long-term performance of the cells
The tests depicted in Fig. 7 were carried out sequentially, repeatedly, or continuously over periods of up to 10 h at a time, for several days, without changes to the observed data, or with small improvements (see, for example, Fig. S4, ESI†). The reversibility of the cell was, additionally, tested before and after each set of tests, including at the start and the end of each day, and found to be either unchanging or slightly improved. Accordingly, we were unable to observe or measure a rate of long-term performance degradation. This is consistent with the known, long-term durability of comparable PEMFC electrochemical hydrogen separation cells, which also use Pt as anode and cathode catalyst.4Characteristics of the cells
Fig. 8 depicts the potentials at the anode versus the current density for different gas mixtures, from pure hydrogen to 5% hydrogen in methane. Plots of this type are known as polarization curves. The linear nature of this plot indicates that internal resistance (IR) losses dominate the cell overpotential in this region (20–200 mA cm−2).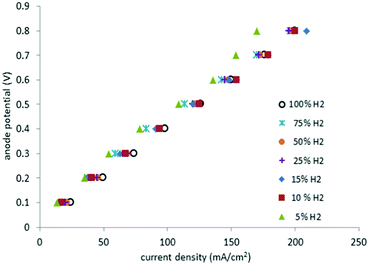 | ||
| Fig. 8 Polarization curves for pure hydrogen gas at the anode and mixtures with methane between 100% and 5% (295 K, 1 atm, Pt catalyst, 2.5 ml min−1). | ||
Cell resistance was estimated from the slope of the polarization curves for mixtures having between 100% and 10% hydrogen in methane (3.9 ± 0.2 Ω), as well as for 5% hydrogen in methane (4.3 Ω). Thus, in the present system only a small change of 0.4 Ω was observed in going from 100% hydrogen to a 5% hydrogen in methane mixture. By contrast, the equivalent polarization curves of PEM cells operating with dilute hydrogen, display significant increases in cell resistance as the amount of the hydrogen in the gas mixture decreases.6
The ohmic resistance of the cell, RΩ, determined from impedance measurement to be 3.4 Ω (Fig. 4(f)), is slightly lower than the resistance calculated from the polarization curves. As reported in the literature,22 an over-estimation of the ohmic potential drop may arise from using polarization curves due to the inherent difference in the response of a porous electrode with non-negligible resistance, to a large voltage perturbation (as in a polarization curve) compared to a small perturbation (as in an impedance measurement).
The ohmic resistance of the supporting electrolyte depends on the anode-to-cathode spacing or the charge-transport length (d), cross-sectional area of charge transport (A) and the ionic conductivity (σ) (eqn (7))
 | (7) |
The transport properties (proton conductivity) of PEM are determined by the water content within the hydrophilic domains and the interaction of protons with the acidic functional groups, which create a need for PEM membranes to be well hydrated. Maintaining such water content in a PEM membrane may be challenging. By contrast, in an aqueous solution of acid, protons are associated with water molecules and exist as hydronium ions, which are themselves hydrated. The mobility of protons in liquids is therefore abnormally high compared to other ions, as explained by the so-called Grotthuss mechanism, or “proton-hopping” mechanism. The diffusion coefficient for protons in sulfuric acid is in the order of 10−5 cm2 s−1,19 which is two orders of magnitude larger than that in the Nafion membranes used in PEM technology (10−7 cm2 s−1).26
To obtain more information about why the liquid cell operates successfully with even very dilute mixtures of hydrogen, further impedance measurements were undertaken. Mixtures of 50%, 25%, 10% and 5% hydrogen in methane were examined in the potential range 0.1 V to 0.4 V and compared to the results produced by pure hydrogen.
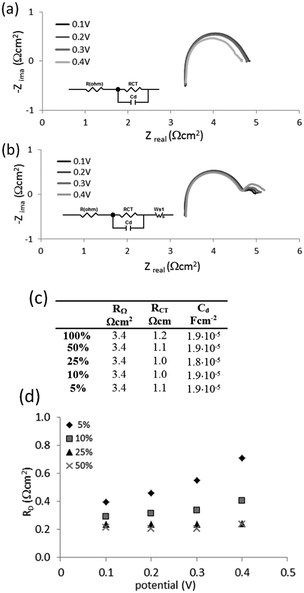
Nyquist plots for 100% hydrogen and the 5% mixture of hydrogen in methane are shown in Fig. 9(a). An equivalent circuit was used to fit the data for pure hydrogen (Fig. 9(a), inset). The same circuit, extended with a Wartburg element to fit Nernst impedance (finite diffusion), was used to fit the data for all mixtures (Fig. 9(b), inset). The results are presented in Fig. 9(c).
No significant differences were observed for the ohmic resistance RΩ, charger transfer resistance RCT and capacitance at the electrodes for the 5% mixture and pure hydrogen at the investigated potentials (Fig. 9(b)). However the 5% mixture exhibited diffusion resistance RD at the lower frequency part (Fig. 9(d)). This resistance: (i) increased with the extent of dilution of hydrogen in the mixture, and (ii) increased with the applied potential. However the measured diffusion resistances are relatively small, being below 1 Ω cm2.
This is a huge contrast with the PEMFC cells, which suffer massive diffusion-controlled, mass-transport limitations when the hydrogen is dilute.6 Since the EIS spectrum for PEMFC changes in the high frequency domain, such limitations may be indicative of either: (i) hydrogen diffusion in the gas phase to the electrode or (ii) hydrogen diffusion across a thin water film formed at the surface of catalysts particles.6 Such limitations are not observed in the present liquid cell.
The origin of the efficiency of the liquid cell therefore appears to fundamentally derive from the solid–liquid interface between the (solid) catalyst-layered Gortex electrodes and the (liquid) electrolyte, as well as the high proton conductivity of the acid electrolyte. This interface and electrolyte clearly exhibit an extraordinary efficiency for selective extraction of hydrogen, conversion of the hydrogen into protons, and transfer of those protons via the proton conducting liquid phase, to the other electrode. The efficiency of these elements for the reaction very substantially exceeds the capability of the comparable solid–solid interface that exists in PEMFC technology.
Energy consumption of the cell under operational conditions using a 5% hydrogen in methane blend
The power (in W) required by a cell of the above type is the product of its voltage (in V) and current (in A). The energy consumption of the cell (in W h) is obtained by multiplying its power usage by the time over which the power is applied (in h). To determine the energy consumption under operational conditions, it is necessary to select the lowest reasonable voltage at which practically useful hydrogen fluxes are achieved by the cell, with accompanying high cell efficiencies and hydrogen yields. The data in Fig. 7(b and c) for a 5% hydrogen blend suggest that these conditions may be best met using 5% hydrogen supplied at 1 ml min−1 at 0.40 V. A 1 cm2 cell operating under these conditions consumes 75 mA (Fig. 7(b)) with a hydrogen yield of 55% (Fig. 7(c)). Accordingly, the power required by such a 1 cm2 cell would be 0.40 × 0.075 = 0.03 W. Over 1 h, its energy consumption would be 0.03 W × 1 h = 0.03 W h, or 3 × 10⁻⁵ kW h. During that time, it would generate: 55% × 1 ml min−1 = 0.55 ml min−1 of H2, or 33 ml h−1 of H2. According to the ideal gas law, at 25 °C and 1 atmosphere pressure, 1 kg of H2 equates to 12![[thin space (1/6-em)]](https://www.rsc.org/images/entities/char_2009.gif) 145 L.27 Thus, the cell would generate 33/(12
145 L.27 Thus, the cell would generate 33/(12![[thin space (1/6-em)]](https://www.rsc.org/images/entities/char_2009.gif) 145 × 1000) = 2.717 × 10⁻⁶ kg of H2, giving it an energy consumption, under operational conditions, of: 3 × 10⁻⁵/2.717 × 10−6 = 11.04 kW h kg−1 H2.
145 × 1000) = 2.717 × 10⁻⁶ kg of H2, giving it an energy consumption, under operational conditions, of: 3 × 10⁻⁵/2.717 × 10−6 = 11.04 kW h kg−1 H2.
The theoretical minimum energy required to generate 1 kg of H2 is 39.41 kW h kg−1.28 In practice however, at the overall system level, large electrolyzers (e.g. 1000 kg H2 per day) require 49–53 kW h kg−1 H2 and very large electrolyzers of the type planned for commercial Power-to-Gas installations (50![[thin space (1/6-em)]](https://www.rsc.org/images/entities/char_2009.gif) 000–200
000–200![[thin space (1/6-em)]](https://www.rsc.org/images/entities/char_2009.gif) 000 kg H2 per day) are expected to require 43–48 kW h kg−1 H2.1,28 Small-scale electrolyzers (1–20 kg H2 per day) are generally more energy-intensive because of the high cost of active cooling at small scale, requiring 70–90 kW h kg−1 H2.28
000 kg H2 per day) are expected to require 43–48 kW h kg−1 H2.1,28 Small-scale electrolyzers (1–20 kg H2 per day) are generally more energy-intensive because of the high cost of active cooling at small scale, requiring 70–90 kW h kg−1 H2.28
Illustrative potential future applications utilizing Power-to-Gas
In order to illustrate the potential of the above technology when combined with Power-to-Gas technology, we now consider some possible future scenarios. It should be noted that this discussion is purely hypothetical and intended only to demonstrate a few, selected possibilities.The above results suggest that, if the above cell could be adapted to operate using natural gas enriched with 5% hydrogen (i.e. a Power-to-Gas blend), it may be possible to leverage the economies of scale of Power-to-Gas electrolyzers in order to generate small amounts of pure hydrogen for only an additional ca. 11.04 kW h kg−1 H2. That is, using an adapted cell coupled to a Power-to-Gas pipeline, it would potentially be possible to generate hydrogen locally in quantities of 1–20 kg per day at a total energy consumption, including the upstream Power-to-Gas electrolyzer, of ca. 54–59 kW h kg−1. This would be less than a typical small-scale electrolyzer.28
More pertinently however, the cost of the extracted hydrogen would likely also be notably lower than could be achieved with a small scale electrolyzer. This would be for the following reasons. The principle of Power-to-Gas is to use renewable electricity that is inexpensively, or even negatively priced (because there is a low demand for it), to manufacture hydrogen that is injected into a natural gas pipeline.1 The pipeline hydrogen is likely to cost end-users no more than the equivalent volume of natural gas. At present US spot prices of USD $3.00/1000 cubic feet of natural gas (where 1000 cubic feet = 28![[thin space (1/6-em)]](https://www.rsc.org/images/entities/char_2009.gif) 317 L), the volume of gas in 1 kg of hydrogen extracted from a Power-to-Gas pipeline, would cost USD $1.29. To that would have to be added the cost of extracting the hydrogen from the pipeline. Using the present average US industrial electricity price of 7.25 US cents per kW per h, the cost of extraction could potentially be 7.25 × 11.04 = 80 US cents per kg H2. The total cost of the hydrogen would then be ca. USD $1.29 + $0.80 = USD $2.09 per kg H2, which is roughly half the 2015 DOE target for commercial electrolyzers of $3.90 per kg H2.29
317 L), the volume of gas in 1 kg of hydrogen extracted from a Power-to-Gas pipeline, would cost USD $1.29. To that would have to be added the cost of extracting the hydrogen from the pipeline. Using the present average US industrial electricity price of 7.25 US cents per kW per h, the cost of extraction could potentially be 7.25 × 11.04 = 80 US cents per kg H2. The total cost of the hydrogen would then be ca. USD $1.29 + $0.80 = USD $2.09 per kg H2, which is roughly half the 2015 DOE target for commercial electrolyzers of $3.90 per kg H2.29
This analysis does not, of course, take account of all of the potential operational costs, such as capital costs, distributor margins, and the like. But, on the other hand, it also does not consider savings that could arise from using inexpensively or negatively priced excess renewable electricity for the hydrogen extraction process.
In effect, low-cost hydrogen would be produced by harnessing the excess renewable power from wind- or solar-generators that would normally be turned off when demand was low, or whose output would normally be discarded at times of low demand.1 This low-cost hydrogen would, further, be distributed, using an existing gas distribution system that is widespread and readily available to end-users.
What could the extracted hydrogen be used for? As noted earlier, the above H2–methane cell uses 0.05 mg Pt per cm2 on each electrode. If an adapted, H2-natural gas cell employed the same loadings and contained a total of 10 g of Pt, which is about the amount of Pt in an automobile catalytic converter,30 then the cell would have 10 m2 of cathodes and 10 m2 of anodes. Based on Fig. 7(b and c), such a cell could potentially generate 6.5 kg of H2 per day at 0.4 V, which is roughly the amount of hydrogen required to refuel a hydrogen-based fuel cell electric vehicle (FCEV).30 The 2025 target for Pt in the powertrain of FCEVs is also 10 g.30 According to an industry rule of thumb, 6.5 kg of hydrogen would allow the FCEV to travel 650 km.30 CO2-free vehicle transportation using renewable hydrogen could thereby potentially be enabled. That is, renewable energy could be converted to and harnessed as a transportation fuel.
Given that the cost of renewable energy is declining rapidly, Power-to-Gas and associated technologies could potentially become a platform for a future hydrogen economy.1
Conclusions
In this work we have demonstrated a liquid-based electrochemical cell with acid electrolyte that facilitates efficient, single-step, extraction of hydrogen from even exceedingly dilute mixtures with methane. The dilute mixtures of hydrogen and methane are very similar to the natural gas compositions envisioned with Power-to-Gas. At present, the concentration of hydrogen in such pipelines can only be at the level of 5–10% by volume. Existing gas-separation technologies cannot efficiently or cost-effectively deal with such low levels.An electrochemical cell comprising of two symmetrical, porous, Gortex-based electrodes coated with active catalytic Pt, with a 1 M H2SO4 liquid electrolyte, has been studied. In this configuration, mixtures of hydrogen and methane were supplied to the anode, where hydrogen was converted by oxidation to protons. The protons then diffused through the liquid electrolyte to the cathode, where proton reduction caused the hydrogen to re-form in high purity. At the same time, methane or methane with an excess of unreacted hydrogen, inertly passed through the anode and left the cell. Methane did not pass through the cell or accumulate at the cathode.
The most important highlights of the study can be summarised as follows:
1. Cells operated with the 10–100% mixtures of hydrogen and methane behave essentially the same as cells fed with pure hydrogen. Close to 100% retrieval efficiency can be achieved in a single step.
2. Electrochemical purification of the hydrogen can be performed from methane mixtures diluted to 5% hydrogen by volume. The cell retrieval efficiency at 0.4 V and 0.7 V were 82% and 89% respectively. A best hydrogen yield of 72% was achieved with a flow of 1 ml min−1 and a potential of 0.7 V. In respect of the amount of hydrogen fed into the cell, cell starvation was not observed and successful operation proved possible from even very dilute mixtures, such as 5%.
3. At low levels of hydrogen in methane (e.g. 5%), mass transport comprises the key limitation. This limitation can, however, be readily overcome by simply increasing the flow rate of the hydrogen–methane mixture through the cell.
4. Electrochemical conditioning of the cell improved its performance across a spectrum of current densities, but especially in the lower current density range.
5. Electrochemical liquid purification cells of this type do not suffer from the massive, diffusion-controlled, mass-transport limitations exhibited by PEM. This allows for efficient extraction of hydrogen from very dilute mixtures.
6. The origin of the efficiency of the present cell derives, fundamentally, from the intrinsic efficiency of the solid–liquid interface between the catalyst-coated Gortex electrodes and the liquid electrolyte, as well as the high proton conductivity of the acid electrolyte. This interface and electrolyte is substantially more effective than the comparable solid–solid interface and proton conductor in PEM technology.
Experimental
Materials
The following materials were employed (Supplier): carbon black (AkzoNobel), 10% Pt on Vulcan XC-72 (Premetek Co. # P10A100), poly(tetrafluoroethylene) (PTFE) (60 wt% dispersion in alcohols/H2O; Sigma-Aldrich #665800), H2SO4 95–98% (Sigma-Aldrich #320501), stain steel (SS) mesh offcuts, 200 LPI, supplied by AquaHydrex Pty Ltd, (cleaned using isopropyl alcohol prior to use, and copper tape 6.35 mm width (3 M)). Polypropylene-backed Preveil™ expanded PTFE (ePTFE) membranes with 0.2 μm pore size, produced by General Electric Energy were used in all experiments.Preparation of catalyst-coated Gortex
The catalysts were prepared as a slurry, by weighing out catalyst (10% Pt on Vulcan XC-72) and carbon black into a 20 ml vial, purging with N2 for ca. 2 min to remove air, then adding isopropyl alcohol (IPA) and water. The mixture was sheared using a homogeniser (IKA T25) with dispersing element (IKA S 25 N–18 G) at 10![[thin space (1/6-em)]](https://www.rsc.org/images/entities/char_2009.gif) 000 rpm for 5 min. PTFE aqueous dispersion was then added dropwise with continuous shearing. After all of the PTFE was added, shearing at 10
000 rpm for 5 min. PTFE aqueous dispersion was then added dropwise with continuous shearing. After all of the PTFE was added, shearing at 10![[thin space (1/6-em)]](https://www.rsc.org/images/entities/char_2009.gif) 000 rpm was continued for another 5 min.
000 rpm was continued for another 5 min.
The resulting catalyst slurry was drop-cast onto the Teflon side of the ePTFE membranes (24 mm × 24 mm membrane pieces) and spread out into a square shape measuring ca. 12 mm × 12 mm as shown in Fig. S1 in the ESI.† Nickel mesh, which had been laser cut to dimensions 12 mm × 12 mm for the square part with an attached 4 mm × 34 mm neck, was laid on top of the wet slurry and pushed down gently using tweezers to ensure even wetting. Membrane/slurry/mesh assemblies were allowed to dry under ambient conditions.
The dried membrane/slurry/mesh assemblies were compacted using a double-roll mill, having metal rollers. After drying, membrane/slurry/mesh assemblies were rolled three-times through a gap equal to 0.1 mm plus the mesh thickness. For the meshes used, a roller gap of 0.1 mm + 0.15 mm = 0.25 mm was set. As the membrane was ca. 0.2 mm thick, the membrane/slurry/mesh assemblies were compressed by 0.1 mm during rolling.
After rolling, the membrane/slurry/mesh assemblies were weighed. These values were used, together with the weight of the membrane (pre-measured before applying catalyst) and the weight of the mesh (pre-measured before use) to calculate the catalyst loading. The catalyst loading was, on average, 0.5 g m−2 metal (Pt) loading, which equates to 0.05 mg cm−2.
Electrode preparation
Electrodes were prepared by mounting them in a plastic (PET) laminate that became rigid after passing through a stationery-store laminator. After weighing, each dried and rolled membrane/slurry/mesh assembly was mounted in a pre-cut, folded PET laminate of the type available in stationery stores. The laminate was first cut, using a laser cutter, to a design depicted in Fig. S2 (ESI†), which included a 1 cm × 1 cm window in each side. After folding over, the membrane/catalyst/mesh assembly was placed inside the folded-over laminate such that the membrane/catalyst/mesh was located in the middle of the window (as depicted in Fig. S2, ESI†). The resulting assembly was then fixed in place by carefully passing it through a commercial hot laminator of the type found in stationery stores. In this way, both sides of the catalyst-coated ePTFE membrane remained open and exposed, within the window in the laminate. A small piece of conductive copper tape was attached over the terminus of the neck of the Ni mesh as an electrode contact (see Fig. S2, ESI†).The 10 mm × 10 mm window in the laminate limited the geometric area of the electrode to be 1 cm2.
Cell construction
Stainless steel and polymeric test cells were custom built to match the dimensions of the laminated electrodes. Fig. S3 (ESI†) depicts a photograph and a cross-sectional schematic of one such cell, showing how the laminate-mounted electrodes were placed between the three components of the cell, which were then bolted together using twelve, edge-arrayed screws/bolts. Each laminate-mounted electrode was placed in the cell such that the exposed, windowed catalyst-mesh side faced inwards, toward the facing electrode, and the uncoated back of the ePTFE faced outwards. The cell was assembled using a 3 mm spacer between the electrodes. The gas connections were made using gas-tight fittings. The central cavity of the cell was filled with 1 M H2SO4.Reactant gases and electrochemical testing
The hydrogen and methane used in the experiments were stored in high-pressure cylinders connected via suitable gas-impermeable polymer tubing to the test cell. In order to obtain the desired mixtures of hydrogen and methane, calibrated mass flow controllers were used (Aalborg, Stanton Scientific, 10 ml min−1 for H2 and 50 ml min−1 for CH4). The anode compartment of the cell was fed with pure hydrogen or a mixture of hydrogen and methane.Electrochemical testing was carried out using a Biologic VSP potentiostat. The fuel cells were characterised by steady-state current–voltage (I–V) curves, chronoamperometry, and chronopotentiometry. Gas from the cathode compartment was collected using an upturned, water-filled syringe that had been sealed at its top end.
For the three-electrode measurements, the potential was controlled versus a Ag/AgCl electrode (BASi, Bioanalytical Systems) placed inside the cell from the top. In the two-electrode system, the cathode, operating in hydrogen evolution mode, was used as a reference.
Glossary
| CO2 | Carbon dioxide |
| EHS | Electrochemical hydrogen separation |
| ePTFE | ‘Expanded PTFE’ (generically termed “Gortex”) |
| FCEV | Fuel cell electric vehicle |
| H+ | Proton |
| H2SO4 | Sulfuric acid |
| HER | Hydrogen evolution reaction |
| HOR | Hydrogen oxidation reaction |
| MS | Membrane separation |
| NHE | Normal hydrogen electrode |
| P2G | “Power-to-Gas” |
| PEM | Proton exchange membrane, or polymer electrolyte membrane |
| PEMFC | Polymer electrolyte membrane fuel cell |
| PSA | Pressure swing absorption |
| PTFE | Poly(tetrafluoroethylene) |
| Vulcan | A form of carbon black |
Conflicts of interest
There are no conflicts to declare.Acknowledgements
The authors gratefully acknowledge support under Australian Research Council (ARC) Linkage Grant LP130101135 and from industry partner, AquaHydrex Pty Ltd. PT gratefully acknowledges an ARC Post-Graduate Award (APA). Support from the ARC Centre of Excellence Scheme (Project Number CE140100012) is gratefully acknowledged. The authors acknowledge the Australian National Fabrication Facility (ANFF) Materials Node for equipment use and for design and printing of custom-built parts.Notes and references
- (a) M. W. Melaina, O. Antonia and M. Penev, in “Blending Hydrogen into Natural Gas Pipeline Networks: A Review of Key Issues” Technical Report NREL/TP-5600-51995, National Renewable Energy Laboratory, March 2013, and references therein (http://https://energy.gov/eere/fuelcells/downloads/blending-hydrogen-natural-gas-pipeline-networks-review-key-issues); (b) V. Reitenbach, L. Ganzer, D. Albrecht and B. Hagemann, Environ. Earth Sci., 2015, 73, 6927 CrossRef CAS; (c) S. Schiebahn, T. Grube, M. Robinius, V. Tietze, B. Kumar and D. Stolten, Int. J. Hydrogen Energy, 2015, 40, 4285 CrossRef CAS; (d) B. Emonts, S. Schiebahn, K. Görner, D. Lindenberger, P. Markewitz, F. Merten and D. Stolten, J. Power Sources, 2017, 342, 320 CrossRef CAS; (e) L. Ausfelder, C. Beilmann, M. Bertau, S. Bräuninger, A. Heinzel, R. Hoer, W. Koch, F. Mahlendorf, A. Metzelthin, M. Peuckert, L. Plass, K. Räuchle, M. Reuter, G. Schaub, S. Schiebahn, E. Schwab, F. Schüth, D. Stolten, G. Teßmer, K. Wagemann and K.-F. Ziegahn, Chem. Ing. Tech., 2015, 87, 17 CrossRef; (f) “Power-to-Gas: The Case for Hydrogen – White Paper”, California Hydrogen Business Council, Los Angeles, CA 90049, 2015 and references therein (http://https://californiahydrogen.org/sites/default/files/CHBC%20Hydrogen%20Energy%20Storage%20White%20Paper%20FINAL.pdf).
- M. Hishiike, M. Miyake and K. Shima, Suiso Enerugi Shisutemu, 2015, 40, 8 CAS , and references therein.
- P. Li, Z. Wang, Z. Qiao, Y. Liu, X. Cao, W. Li, J. Wang and S. Wang, J. Membr. Sci., 2015, 495, 130 CrossRef CAS , and references therein.
- (a) C. Casati, P. Longhi, L. Zanderighi and F. Bianchi, J. Power Sources, 2008, 180, 103 CrossRef CAS ; see also: ; (b) B. Ibeh, C. Gardner and M. Ternan, Int. J. Hydrogen Energy, 2007, 32, 908 CrossRef CAS . (Pt loadings of 10 g m−2, or 1 mg cm−2, were used in these studies).
- P. Millet, in Hydrogen Compression, Purification, and Storage in Hydrogen Compression, Purification, and Storage in Electrochemical Technologies for Energy Storage and Conversion, ed. R.-S. Liu, L. Zhang, X. Sun, H. Liu and J. Zhang, Wiley-VCH Verlag GmbH & Co. KGaA, Weinheim, Germany, 2012, ch. 10, vol. 1 & 2, p. 425 Search PubMed.
- M. T. Dinh Nguyen, S. A. Grigoriev, A. A. Kalinnikov, A. A. Filippov, P. Millet and V. N. Fateev, J. Appl. Electrochem., 2011, 41, 1033 CrossRef CAS.
- A. Abdulla, K. Laney, M. Padilla, S. Sundaresan and J. Benziger, AIChE J., 2011, 57, 1767 CrossRef CAS.
- H. Iwahara, Solid State Ionics, 1999, 125, 271 CrossRef CAS.
- P. Tiwari, G. Tsekouras, G. F. Swiegers and G. G. Wallace, submitted for publication.
- (a) B. Winther-Jensen, O. Winther-Jensen, M. Forsyth and D. R. MacFarlane, Science, 2008, 321, 671 CrossRef CAS PubMed; (b) B. Winther-Jensen, K. Fraser, C. Ong, M. Forsyth and D. R. MacFarlane, Adv. Mater., 2010, 22, 1727 CrossRef CAS PubMed; (c) O. Winther-Jensen, K. Chatjaroenporn, B. Winther-Jensen and D. R. MacFarlane, Int. J. Hydrogen Energy, 2012, 37, 8185 CrossRef CAS; (d) B. Kolodziejczyk, O. Winther-Jensen, B. A. Pereira, S. S. Nair and B. Winther-Jensen, J. Appl. Polym. Sci., 2015, 132, 42359 CrossRef.
- (a) M. Wikol, B. Hartmann, J. Brendle, M. Crane, U. Beuscher, J. Brake and T. Shickel, in Filtration and Purification in the Biopharmaceutical Industry, ed. M. W. Jornitz and T. H. Meltzer, Taylor & Francis, 2nd edn, 2007, ch. 23 Search PubMed; (b) F. A. AlMarzooqi, M. R. Bilad, B. Mansoor and H. A. Arafat, J. Mater. Sci., 2016, 51, 2017 CrossRef CAS.
- See, for example: Z. Radivojeviz and J. Saunamaeki, Int. Pat. WO2009074160A1, 2009 Search PubMed.
- I. Moussallem, J. Jorissen, U. Kunz, S. Pinnow and T. Turek, J. Appl. Electrochem., 2008, 38, 1177 CrossRef CAS and references therein.
- A. F. Gulla and J. L. Krasovic, Int. Pat. WO2013037902, 2013, and references therein Search PubMed.
- K. Fishel, G. Qian, G. Eisman and B. C. Benicewicz, in High Temperature Polymer Electrolyte Membrane Fuel Cells, Approaches, Status, and Perspectives, ed. Q. Li, D. Aili, H. A. Hjuler and J. O. Jensen, Springer International Publishing, Switzerland, 2016, ch. 24 Search PubMed.
- H. E. Darling, J. Chem. Eng. Data, 1964, 9, 421 CrossRef CAS.
- M. E. Gamoa-Aldeco, E. Herrero, P. S. Zelenay and A. Wieckowski, J. Electroanal. Chem., 1993, 348, 451 CrossRef CAS.
- A. J. Bard and L. R. Faulkner, Electrochemical Methods: Fundamentals and Applications, Masson, 1982 Search PubMed.
- P. Ruetschi and R. F. Amlie, J. Phys. Chem., 1966, 70, 718 CrossRef CAS.
- N. Wagner and K. A. Friedrich, Fuel Cells, 2009, 9, 237 CrossRef CAS.
- N. Chouhan and R.-S. Liu, in Electrochemical Technologies for Energy Storage and Conversion, in Electrochemical Technologies for Energy Storage and Conversion, ed. R.-S. Liu, L. Zhang, X. Sun, H. Liu and J. Zhang, Wiley-VCH Verlag GmbH & Co. KGaA, Weinheim, Germany, 2012, ch. 1, vol. 1 & 2, p. 1 Search PubMed.
- K. R. Cooper and M. Smith, J. Power Sources, 2006, 160, 1088 CrossRef CAS.
- S. A. Mousavi Shaegh, N.-T. Nguyen and S. H. Chan, Int. J. Hydrogen Energy, 2011, 36, 5675 CrossRef CAS.
- G. W. Vinal and D. N. Craig, J. Res. Natl. Bur. Stand., 1934, 13, 689 CrossRef CAS.
- B. Y. Pirogov and A. G. Zelinskii, Russ. J. Electrochem., 2009, 45, 336 CrossRef CAS.
- R. Strobel, M. Oszcipok, M. Fasil, B. Rohland, L. Jorissen and J. Garche, J. Power Sources, 2002, 105, 208 CrossRef CAS.
- P. Atkins and J. Paula, Physical Chemistry, Oxford University Press, 9th edn, 2010 Search PubMed.
- (a) J. O. Jensen, V. Bandur, N. J. Bjerrun, S. H. Jensen, S. Ebbesen, M. Mogensen, N. Trophoj and L. Yde, “Pre-Investigation of Water Electrolysis”, Publication PSO-F&U 2006-1-6287, RISO and the Danish Technical University, 2008; (b) For 1–20 kg H2 per day electrolyzers: See specification sheets at http://www.proton.com and http://www.hydrogenics.com for Proton S10, Proton S20, Hydrogenics HyLyzer 1, Proton H2M, Hydrogenics HyLyzer 2, Proton H4M, Proton H6M, Proton Hogen 380; (c) for 1000 kg H2 per day electrolyzer: see Norsk Hydro 5040 in A. Godula-Jopek, Hydrogen Production by Electrolysis, Wiley-VCH, 2015; see also specification sheets at http://www.nelhydrogen.com for NEL A range (plus compression); (d) the first commercial 100 MW Power-to-Gas installation is expected to use multiple NEL-485 electrolyzers, see B. Simonsen, Hydrogen reaching Fossil Parity around the World, Presentation and Abstract 25 at the First International Conference on Electrolysis, Copenhagen, 12–15 June 2017; see specification sheets at http://www.nelhydrogen.com for NEL-485.
- 2012 MYRDD Plan of the US Department of Energy, see: http://https://www.energy.gov/eere/fuelcells/downloads/fuel-cell-technologies-office-multi-year-research-development-and-22.
- U. Eberle, B. Mueller and R. von Helmolt, Energy Environ. Sci., 2012, 5, 8780 Search PubMed.
Footnote |
| † Electronic supplementary information (ESI) available: Preparation of electrodes, mounting of electrodes, cell configuration and construction. See DOI: 10.1039/c7ee02236k |
| This journal is © The Royal Society of Chemistry 2018 |

