Rapid nitrite production via partial denitrification: pilot-scale operation and microbial community analysis†
Zheng
Si
a,
Yongzhen
Peng
 a,
Anming
Yang
b,
Shujun
Zhang
b,
Baikun
Li
 a,
Bo
Wang
a and
Shuying
Wang
 *a
*a
aNational Engineering Laboratory for Advanced Municipal Wastewater Treatment and Reuse Technology, Engineering Research Center of Beijing, Beijing University of Technology, Beijing 100124, PR China
bResearch Center of Beijing Drainage Group, Beijing Drainage Group Co. Ltd (BDG), Beijing 100022, PR China
First published on 1st November 2017
Abstract
Achieving nitrite accumulation via partial denitrification (PD) is a novel technique to supply sufficient nitrite for the anammox process which is used to treat carbon-limited wastewater. Rapid initiation of PD through pH control was developed in this pilot-scale study and the optimum C/N ratio was investigated. The start-up strategy is proposed based on a lab-scale experiment reported in this work in which a high rate of nitrate reduction and an efficient nitrate-to-nitrite transformation ratio (NTR) could be simultaneously achieved at the pH of 9.0. Two pilot-scale reactors (100 L), with one serving as an experimental reactor and the other as a control, were used to determine the pH effect on the start-up of the PD process. In the experimental reactor, the initial pH of 9.0 was applied at the beginning of mixing in each cycle. Results showed that the PD process was rapidly established within 100 cycles with an average NTR of 83.86%, whereas the control reactor achieved PD after 250 cycles. Moreover, the effect of C/N ratios on the PD process was investigated and the result showed that the optimum C/N ratio was 2.5 with both the NTR and nitrate reduction ratio (NRR) exceeding 80%. High-throughput sequencing results demonstrated that Thauera, possibly a functional bacterium for the partial denitrification process, was dominant on the genus level and accounted for over 65% of the microbial community in both PD reactors. The strategy for establishing the partial denitrification process can be easily achieved through long-term stable nitrite accumulation. PD can be integrated with anammox to improve nitrogen removal in an energy-saving mode.
Water impactBiological nitrogen removal using anammox has been applied in many wastewater treatment projects. However, the steady nitrite accumulation is still a bottleneck problem for the application of the anammox process. This study presents a novel strategy for rapid nitrite production via partial denitrification in pilot-scale reactors. The strategy for establishing the partial denitrification process has the advantages of being easily achieved and having a simple operation and good stability. |
1. Introduction
ANaerobic AMMonium OXidation (anammox) is an emerging autotrophic biochemical process for nitrogen removal from wastewater, with nitrite as an electron acceptor to oxidize ammonium. Partial Nitrification (PN) has been widely applied to provide nitrite for anammox.1 However, stable nitrite accumulation in the PN process is affected by several operational conditions such as temperature, dissolved oxygen (DO), hydraulic retention time (HRT), sludge retention time (SRT) and substrate concentration.2 The steady nitrite accumulation through the PN pathway is a bottleneck for the application of the anammox process in the mainstream of wastewater treatment plants (WWTPs).3 On the other hand, the partial denitrification (PD) process was reported as a newly arisen and effective biochemistry method to supply nitrite as an electron acceptor for the anammox process.4–6 Results obtained by Cao et al. revealed that an approximately 80% nitrate-to-nitrite transformation ratio was achieved under long-term operation.4 The integration of PD and anammox can provide solutions for nitrogen removal from carbon-limited wastewater (e.g. domestic wastewater and nitrate sewage), and it has been proven to be feasible in previous studies wherein total nitrogen removal efficiencies of around 90–97% could be achieved in treating synthetic wastewater5 or domestic wastewater coupling nitrate sewage6 in lab-scale reactors. Compared with nitrification/denitrification, PD/anammox can reduce the oxygen demand by 45%, because only a proportion of the ammonium is required to be oxidized to nitrate.1 Compared with PN/anammox, nitrite could be provided without strict operating requirements in PD/anammox, such as the strict control of DO and SRT.2,5,6Partial denitrification reduces nitrate to nitrite, whereas the intermediate NO2−-N is consumed in the subsequent anoxic reaction via conventional denitrification (eqn (1)) that requires extra carbon sources.7 PD saves 60% of the organic carbon consumption compared with conventional denitrification theoretically.8 Meanwhile, PD provides the substrate (nitrite) for anammox and reduces the nitrate generated by anammox (eqn (2)). Furthermore, anammox bacteria are sensitive to organic compounds that could be degraded in the partial denitrification process.9 In wastewater treatment plants (WWTPs), the carbon source saved by PD and the autotrophic anammox process could be used for carbon-intensive processes such as advanced biological phosphorus removal and bioenergy (i.e. methane) recovery. Furthermore, the PD process is a cost-saving alternative for treating NO3−-N containing wastewater such as that from fertilizer, explosive, metal finishing, and nuclear industries.
 | (1) |
| NH4+ + NO2− → N2 + NO3− | (2) |
Nitrite accumulation is affected by several factors such as carbon source type, carbon to nitrogen ratio (C/N),10 seeding sludge5 and pH.11 Until now, it is unclear how to achieve a steady nitrite accumulation through the PD pathway, especially a rapid PD start-up for the integrated PD/anammox process. The effects of pH for nitrite accumulation via conventional denitrification have been studied. The conclusions revealed that the reduction rate of NOx− is strongly dependent on pH which could give rise to nitrite accumulation in the pH range of 6.0–9.0,12 and the accumulation of intermediates during denitrification could increase significantly as the mixed liquor pH is increased from 7.5 to 9.0.11 However, the influence of pH on the partial denitrification start-up is still unknown. Furthermore, the pH effects as well as the microbial community of the PD system have not been well-understood.
In this study, the effect of pH on the start-up of the PD process was investigated in two pilot-scale sequencing batch reactors (SBRs with a volume of 100 L) with one as an experimental reactor and the other as a control reactor. The specific pH adopted in this study was confirmed by a lab-scale test. Afterwards, the optimum C/N ratio for stable nitrite accumulation was investigated through long-term operation. Finally, the microbial community of the PD sludge in these two reactors was estimated through high-throughput sequencing to elucidate the microbial evolution during this experiment.
2. Experimental
2.1 Lab-scale experimental setup
Four SBRs (10 L) were used to investigate the denitrification properties at different pH values (7.0, 8.0, 9.0 and 10.0) and provide the guidelines for the pilot-scale PD experiments. The lab-scale tests were conducted at a temperature of 25 ± 0.5 °C and a stirring rate of 100 rpm. At the beginning of the pH impact tests, the reactor was filled with sludge that was washed three times with discarding the supernatant. Synthetic wastewater was then added to achieve the initial C/N ratio of 5.0, a NO3−-N concentration of about 30 mg of N per L and a chemical oxygen demand (COD) of about 150 mg L−1. During tests of 180 min, 10 mL mixed liquor samples were taken every 20–30 min for analysis.2.2 Pilot-scale experimental setup
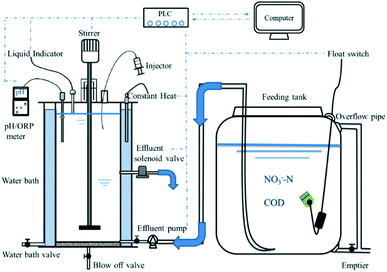
Two reactors termed SBR1 and SBR2 with an identical configuration (cylinder, diameter: 40 cm, height: 100 cm, effective volume: 100 L) were used in the pilot-scale experiment (Fig. 1). The temperature was controlled at 25 °C using a water bath. The stirring rate of the reactors was 120 rpm. Each cycle consisted of feeding (3 min), anoxic mixing (20–180 min) (as the reaction rate improved, the mixing time was shortened simultaneously in both SBRs), sedimentation (20 min), and discharging (15 min) (volumetric exchange ratio: 50%). The start-up period was divided into two phases. Phase I (cycles 1–29) was a pre-adaptive phase for the seeding sludge. Phase II (cycles 30–100) was a contrast experiment phase at different pH values. The initial pH in SBR2 was adjusted to 9.0 (±0.1) at the beginning of mixing in each cycle, while SBR1 was operated without pH control. The domestic sludge in SBR2 was used to explore the optimum C/N ratio for long-term operation. At this stage, a C/N ratio of 3.0 was used for cycles 101–136, a C/N ratio of 2.0 for cycles 137–171, and a C/N ratio of 2.5 for cycles 172–250.2.3 Seeding sludge and wastewater
The seeding sludge for the lab-scale and pilot-scale experiments was collected from the secondary sedimentation tank of a wastewater treatment plant (Beijing, China) using an anaerobic/anoxic/oxic (A/A/O) process to treat domestic wastewater. The concentration of mixed liquor suspended solids (MLSS) in the lab-scale test was 2.0 g L−1. The concentration of MLSS in the pilot-scale reactors was 3.0 g L−1 at the beginning and maintained at about 2.0 g L−1 during the long-term operational period.Synthetic wastewater was prepared as follows (per liter): 728.4 mg NaNO3 (60 mg NO3−-N)/364.2 mg NaNO3 (30 mg NO3−-N), 11.1 mg KH2PO4, 6 mg MgSO4·7H2O, 3 mg CaCl2·2H2O and 1 mL trace-element, which contained (per liter): 1.5 g FeCl3·6H2O, 0.03 g CuSO4·5H2O, 0.12 g MnCl3·4H2O, 0.06 g Na2MoO4·2H2O, 0.12 g ZnSO4·7H2O, 0.15 g CoCl2·6H2O, 0.18 g KI, 0.15 g H3BO3 and 10 g ethylenediaminetetraacetic acid (EDTA). Sodium acetate was used as the carbon source to supply the electron donor for NO3−-N reduction. 2 mol L−1 NaOH and 2 mol L−1 HCl solution were used for pH adjustment.
2.4 Chemical analysis methods
Mixed liquor samples were filtered through filter paper (0.45 μm) before analysis. According to Standard Methods,13 the influent and effluent samples were collected on a cyclical basis and were analyzed daily. The NO3−-N and NO2−-N parameters were measured with a Lachat QuikChem 8500 Flow Injection Analyzer (Lachat Instruments, Milwaukee, USA); chemical oxygen demand (COD) was analyzed using a COD quick-analysis apparatus (Lianhua Tech. Co., Ltd., 5B-1, China). The MLSS of the activated sludge were measured according to Standard Methods. The pH and temperature were measured with an online pH probe (pH 900, WTW, Germany).The nitrate-to-nitrite transformation ratio (NTR) and nitrate reduction ratio (NRR) were calculated using eqn (3) and (4), respectively.
| NTR (%) = (NO2−-Neff/t − NO2−-Ninf/initial)/(NO3−-Ninf/initial − NO3−-Neff/t) | (3) |
| NRR (%) = (NO3−-Ninf − NO3−-Neff/t)/NO3−-Ninf | (4) |
2.5 Microbial community analysis
The sludge samples for sequencing were sent to Shanghai Majorbio Bio-pharm Technology Co., Ltd (Shanghai, China). Operational taxonomic units (OTUs) for community analysis were defined at 97% identity thresholds in sequences. The rarefaction curves and Shannon–Wiener index were generated from the OTU numbers as the species richness. The generated raw sequences of the sludge samples have been archived at the NCBI Sequence Read Archive (SRA) database with the accession number SUB2519026.3. Results and discussion
3.1 Determination of the optimal pH in the lab-scale tests
A lab-scale batch test was conducted to investigate the nitrite accumulation at different pH values and select a suitable pH for the start-up of pilot-scale PD reactors. The transformation ratio of nitrate-to-nitrite increased significantly as the mixed liquor pH was increased from 7.0–10.0 (Table 1). At pH 7.0 and 8.0, the NO3−-N reduced rapidly and the NO2−-N concentration increased to a peak value, and then decreased. At pH 9.0 and 10.0, the accumulation concentration of NO2−-N increased steadily. The nitrate reduction rate was 5.82 mg gVSS−1 h−1 at pH 9.0, showing that the activity of denitrification was not suppressed compared with the other pH values. A distinct accumulation of nitrite was observed with a peak value of 10.07 mg L−1 at pH 9.0. In contrast, denitrification was severely inhibited at pH 10.0, and the specific nitrate reduction rate was only 1.19 mg gVSS−1 h−1 while it was 7.21 mg gVSS−1 h−1 at pH 8.0.| pH | NO2−-Nmaxa (mg L−1) | NTRmaxa (%) | rNO3−b (mg gVSS−1 h−1) | rNO2−b (mg gVSS−1 h−1) | Δr (mg gVSS−1 h−1) |
|---|---|---|---|---|---|
| a NO2−-Nmax and NTRmax are the maximum values of nitrite concentration and NTR (nitrate-to-nitrite transformation ratio), respectively. b rNO3− and rNO2− are the average nitrate and nitrite reduction rate data for 20–100 min (the time at which the reaction was steady). Δr = rNO3− − rNO2−. | |||||
| 7.0 | 1.97 | 7.48 | 4.24 | 4.00 | 0.24 |
| 8.0 | 6.06 | 21.82 | 7.21 | 5.92 | 1.29 |
| 9.0 | 10.07 | 35.99 | 5.82 | 3.83 | 1.99 |
| 10.0 | 4.34 | 35.89 | 1.19 | 0.43 | 0.75 |
The nitrite accumulation was ascribed to the reduction rate difference (Δr) of nitrate–nitrite conversion.14 The pH values affected the reduction rate of NO2−-N and NO3−-N. The lab-scale tests showed that the maximum Δr occurred at pH = 9.0 (1.99 mg gVSS−1 h−1), which would be the optimal pH for nitrite accumulation in the pilot-scale PD experiments.
3.2 Partial denitrification (PD) start-up in the pilot-scale reactors
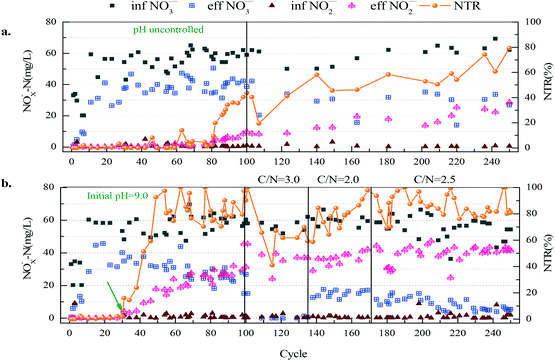
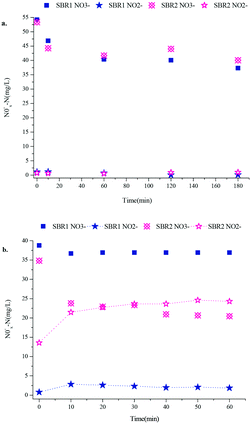
PD was achieved during a 100-cycle operation in the SBR2 system (the experimental reactor with pH control) at the initial pH of 9.0, whereas high nitrite accumulation wasn't achieved in the SBR1 system (the control system without pH control) until cycle 250 (Fig. 2). The first 100 cycles were the comparison period and cycles 101–249 were the accessional period only for SBR1. During the pre-adaptive phase, the influent NO3−-N concentration was increased from 30 mg L−1 to 60 mg L−1 and the C/N ratio was maintained at 1.5, since a low C/N ratio could limit the electron supply for complete reductive reactions of nitrate. In this phase, the biodegradation rate increased and the reaction time was shortened from 1 h to 20 min. The nitrate-to-nitrite transformation ratio (NTR) in both reactors did not exceed 1%. A typical cycle 29 showed that the nitrate reduction ratio (NRR) and nitrite accumulation in SBR1 and SBR2 were similar (30.31% versus 25.90%, [NO2−-N] < 1.00 mg L−1) (Fig. 3(a)).In phase II, the pH ranges from 8.9 to 9.3 as the result of pH adjustment in SBR2 and the pH ranges from 7.8 to 8.5 in SBR1. The nitrite accumulated substantially after the pH control in SBR2, while the NTR increased to more than 50% at cycle 42, then rapidly reached 92.6% at cycle 49 and became stable. The effluent nitrate concentration at cycle 49 was 31.39 mg L−1 with a NRR of 35.11%. Afterwards, as the NO3−-N effluent concentration dropped, the NRR increased gradually to 61.56% at cycle 68. The effluent NOx−-N concentration was constant. However, the effluent nitrite concentration was negligible in the SBR1 system in phase II. A typical cycle 80 showed that the substrate degradation in SBR2 was clearly different from that in SBR1 (Fig. 3(b)). SBR2 could prevent NO2−-N from being restored with a NTR of 82.37% and a NRR of 62.65%, while the NTR and NRR of SBR1 were only 2.48% and 40.51%, respectively. At cycles 68–100 of SBR2, the average NTR was 83.86%, but the highest NTR of the SBR1 system was below 50% with a much lower NRR than SBR2. At the accessional period of SBR1, the NTR increased to 74.01% on cycle 236 and was maintained over 60% for several cycles without pH control, indicating that the PD process was successfully established in SBR1 during the 250-cycle operation.
The experimental results indicated that the initial pH of 9.0 promoted the start-up of the PD process. A high nitrate-to-nitrite transformation ratio was achieved after 20 regulative cycles and became stable. This contrast experiment showed that a high pH value was critical for the rapid start-up of PD.
3.3 Optimal C/N ratio for the PD process in long-term operation
The theoretical requirement of COD for nitrate-to-nitrite transformation was 1.14,8 while the actual required C/N ratio for denitrification was more than the theoretical value. A C/N ratio of 1.5 was inadequate for effective NO3−-N removal in the PD systems (Fig. 2). In this part, the nitrate-to-nitrite transformation ratio (NTR) and nitrate reduction ratio (NRR) at different C/N ratios were studied.When the C/N ratio was increased from 1.5 to 3.0, the effluent NO3−-N concentration dropped below 1.5 mg L−1, and the consumption of nitrate resulted in the decline of the NTR to 59.26% at cycle 136, which was much lower than the average values (Fig. 2 & Table 2). When a C/N ratio of 2.0 was used in phase II, the NTR gradually increased from 59.26% to 97.84% and the effluent nitrite concentration slightly increased from 36.94 mg L−1 to 42.04 mg L−1. Nevertheless, the residual NO3−-N concentration increased to 15.01 ± 2.430 mg L−1, and the NRR was 75.13% at this stage. When the C/N ratio was increased to 2.5, the NO3−-N concentration decreased to 4.62 mg L−1 at cycle 212 and reached a stable level of 8.27 ± 4.63 mg L−1. The NRR was 84.91% and the NTR was 87.01%, the highest values throughout this experiment. Based on the nitrate reduction efficiency and nitrate-to-nitrite transformation ratio, the C/N ratio of 2.5 was suggested to be used in the pilot-scale PD process.
| Cycle | C/N | eff NO3−a (mg L−1) | eff NO2−a (mg L−1) | NRR (%) | NTR (%) |
|---|---|---|---|---|---|
| a eff NO3− and eff NO2− are the effluent nitrate and nitrite concentrations, respectively. | |||||
| 68–100 | 1.5 | 25.57 ± 3.09 | 27.17 ± 4.79 | 57.29 | 83.86 |
| 101–136 | 3.0 | 0.67 ± 0.51 | 35.56 ± 3.72 | 97.12 | 65.78 |
| 137–171 | 2.0 | 15.10 ± 2.43 | 36 ± 5.59 | 75.13 | 80.78 |
| 172–249 | 2.5 | 8.27 ± 4.63 | 40.12 ± 6.54 | 84.91 | 87.01 |
3.4 Characteristics of microbial community evolution in the PD systems
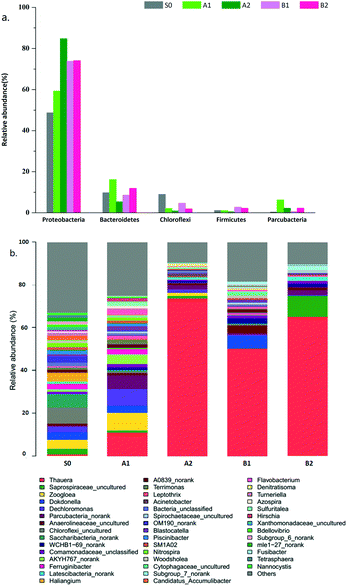
Highly complex microbial communities play crucial roles in denitrifying performance in wastewater treatment. Five activated sludge samples were collected for high-throughput sequencing to elucidate the microbial evolution and the ideal functional bacterium for the conversion of nitrate to nitrite in the PD systems. The samples include the seeding sludge at the initial stage (S0) and the cultured sludge at cycle 100 (A1 for SBR1, B1 for SBR2) and cycle 250 (A2 for SBR1, B2 for SBR2). The phylogenetic classification of effective bacterial sequences was conducted at phylum (Fig. 4(a)) and genus taxonomic levels (Fig. 4(b)).During the 100-cycle comparison period, the Shannon index decreased from 5.31 to 4.49 in the SBR1 system and decreased to 3.38 in the SBR2 system (Table S1†), indicating that the biodiversity became obvious at high pH conditions. The dominant genus in both A1 and B1 was Thauera, with a percentage of 11.05% and 50.12%, respectively, while it was only 1.03% in the seeding sludge. The other dominant genera (>5.00%) were Zoogloea (8.23%), Dechloromonas (7.74%), and Parcubacteria_norank (6.28%) in A1 and Dokdonella (5.64%) in B1. Thauera, Zoogloea, Dechloromonas and Dokdonella had been found to carry out denitrification.16
During cycles 100–250, the proportion of Thauera increased to 73.60% in SBR1 and 65.35% in SBR2. There was no other dominant genus (>5.00%) in both systems. However, the obtained results in the PD systems were different from the denitrifiers frequently isolated from denitrifying bioreactors, in which the bacterial strains isolated are closely related to Hyphomicrobium, Paracoccus, Pseudomonas and Comamonas spp.16 In particular, in Li's study, the dominant denitrifying bacteria shifted from Thauera to Hyphomicrobium in the nitrite accumulation system.18 This could be due to the fact that different reactors and operation conditions were used. In this study, PD was achieved in the SBR2 system within 100-cycles and in SBR1 till cycle 250, indicating that the high nitrite accumulation in PD systems might be related to the predominant Thauera genus, which belonged to class β-proteobacteria and family Rhodocyclaceae of phylum Proteobacteria. Previous studies found that most of the strains within Thauera were denitrifiers.17 In addition, Thauera was also found predominantly in the nitrite accumulation system in Du's study.6 From the above evidence, Thauera might be functional for high NO2−-N accumulation in PD systems. Notably, although SBR1 failed to launch a PD process during 100 cycles, Thauera accounted for 11.05% of the microbial community in the A1 sample, which was much higher than that in the seeding sludge. At the genus taxonomic rank, Zoogloea (8.23%), Dechloromonas (7.74%), Flavobacterium (1.53%) and Azospira (1.25%) as denitrifying bacteria,15 played important roles in oxynitride reduction. The relative percentage of these genera dropped sharply to 2.00% when nitrate was accumulated.
3.5 Mechanisms of rapid start-up of PD at pH 9.0
At the pH of 9.0, NO2−-N could be accumulated more efficiently and the functional bacteria were enriched within a short period of time. There were three reasons for the effects of pH on the start-up of PD processes:a) The high initial pH value may affect the balance of biochemical reactions. In the stoichiometries for nitrate and nitrite reduction, no acid is consumed in the reduction of nitrate to nitrite while 0.625 equivalents of acid are consumed for the reduction of 1 mole of nitrite to N2 (eqn (5) and (6)).11
| 0.25CH3COO− + 1NO3− → 0.5NO2− + 0.5H2O + 0.25HCO3− + 0.25CO2 | (5) |
| 0.375CH3COO− + 1NO3− + 0.625H+ → 0.75HCO3− + 0.5N2 + 0.25H2O | (6) |
b) pH could affect the activity and stability of enzymes. Results obtained by Wei et al. revealed that a high pH seriously inhibited the NiR activity compared to the NaR activity. As the pH rose from 7.2 to 9.2, the NaR activity showed no statistical difference, but the NIR activity dropped sharply from 0.067 ± 0.004 to 0.023 ± 0.005 μg h−1 per g protein.18
c) pH affected the competition of electron supply among denitrifying enzymes. Results obtained by Pan et al. revealed that the pH affects not only the activities of nitrogen oxide reductases, but also the carbon oxidation rate. Then the carbon oxidation rate likely induces the electron competition among the reduction of the different nitrogen species. And the order of accepting electrons for the NOx−-N is different at different pH values.19 Similar research shows that the intramolecular electron transfer rate in NiR decreased sharply with increasing pH,20 which may be related to the inhibition of NiR activity.21–23 However, more research is required to understand the specific effect of pH in partial denitrification.
In this study, the reduction rate of NO3−-N (rNO3−) and NO2−-N (rNO2−) was inhibited at high pH (Table 1). Specifically, high pH seriously depressed rNO2− compared to rNO3−:rNO3− and rNO2− declined by 19.28% and 35.30%, respectively, at the pH of 9.0. rNO3− and rNO2− were reduced by 79.55% and 92.74%, respectively, at the pH of 10.0, compared to the maximum reduction rate at the pH of 8.0. The pilot-scale study proved that the PD process could be rapidly started up at the initial pH of 9.0, which was supported by the result of microbial community analysis in which the specific dominant bacteria, Thauera, were enriched at high pH conditions primarily.
3.6 PD as a potential technology for advanced nitrogen removal via combination with anammox
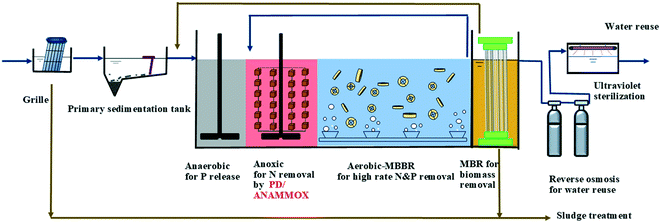
In a wastewater treatment plant (WWTP), biological nutrient removal has a high requirement of organic carbon and the biological nitrogen removal and biological phosphorus removal always compete for the carbon source in low C/N ratio sewage. The development of technologies that exhibit acceptable phosphorus emissions while achieving desirable levels of nitrogen removal remains a significant challenge. The integrated PD/anammox process holds great potential for enhancing nitrogen removal due to its low consumption of organic carbon. Previous studies have proven the capability of the anammox process because of its low demand for oxygen and organic carbon, high nitrogen removal and low sludge yield.24,25 This study demonstrated that nitrite production via PD was easily operated and maintained, which could be established in 250-cycles in an easy automatic control system and could be promoted within 100-cycles by the adjustment of the initial pH value. The PD/anammox process can be used as a potential solution to replace denitrification at the anoxic zone for the anaerobic/anoxic/oxic (A/A/O) process in the mainstream (Fig. 5). The backflow of nitrified water concentrates the nitrogen-containing wastewater at the anoxic zone, from where the substrate could provide nitrate, ammonia and carbon sources for the PD/anammox process. For domestic sewage with low C/N ratios (<3.0), the organic carbon (COD) saved by the PD/anammox process could be used for advanced phosphorus removal. For domestic sewage with sufficient nutrients, the process will be more beneficial for bioenergy (i.e. methane) recovery. Moreover, the PD/anammox process can be used as a cost-saving alternative for treating NO3−-N containing wastewater.Conclusions
This pilot-scale study clearly demonstrated that a high pH (pH = 9.0) facilitated the start-up of the PD process. An average nitrate-to-nitrite transformation ratio (NTR) of 83.86% was achieved within 100-cycles by pH control. High-throughput sequencing results showed that Thauera was enriched and dominant in the PD systems. The optimum C/N ratio was 2.5 for long-term operation, with a NTR and nitrate reduction ratio (NRR) of 87.01% and 84.91%, respectively. The PD process is expected to combine with anammox for further nitrogen removal and would open new possible scenarios for designing wastewater treatment plants.Conflicts of interest
There are no conflicts to declare.Acknowledgements
This study was supported by the Natural Science Foundation of China (21677005), the 111 Project of China (005000522106) and the Funding Projects of Beijing Municipal Commission of Education.Notes and references
- B. Ma, S. Wang, S. Cao, Y. Mao, F. Jia, R. Du and Y. Peng, Bioresour. Technol., 2016, 149, 570–574 Search PubMed.
- S. W. H. V. Hulle, H. J. P. Vandeweyer, B. D. Meesschaert, P. A. Vanrolleghem, P. Dejans and A. Dumoulin, Chem. Eng. J., 2010, 162(1), 1–20 CrossRef.
- Q. Wang, L. Ye, G. Jiang, S. Hu and Z. Yuan, Water Res., 2014, 55, 245–255 CrossRef CAS PubMed.
- S. Cao, S. Wang, Y. Peng, C. Wu, R. Du, L. Gong and B. Ma, Bioresour. Technol., 2013, 149(4), 570–574 CrossRef CAS PubMed.
- S. Kalyuzhnyi, M. Gladchenko, A. Mulder and B. Versprille, Water Res., 2006, 40(19), 3637–3645 CrossRef CAS PubMed.
- R. Du, S. Cao, B. Li, S. Wang and Y. Peng, Chemosphere, 2017, 174, 399–407 CrossRef CAS PubMed.
- W. G. Zumft, Microbiol. Mol. Biol. Rev., 1997, 61(4), 533–616 CAS.
- B. E. Rittmann and P. L. McCarty, Environmental Biotechnology: Principles and Applications, McGraw Hill, New York, 2001 Search PubMed.
- M. Mooyoung, W. A. Anderson and A. M. Chakrabarty, Water Res., 2012, 46, 136–144 CrossRef PubMed.
- S. Ge, Y. Peng, S. Wang, C. Lu, X. Cao and Y. Zhu, Bioresour. Technol., 2012, 114, 137–143 CrossRef CAS PubMed.
- C. Glass and J. A. Silverstein, Water Res., 1998, 32(3), 831–839 CrossRef CAS.
- Y. Pan, L. Ye, B. J. Ni, P. L. Bond and Z. Yuan, Water Res., 2012, 46, 4832–4840 CrossRef CAS PubMed.
- A. P. H. Association, A. W. W. Association and W. E. Federation, Standard Methods for the Examination of Water and Wastewater, American Public Health Association, Washington, 21st edn, 2005 Search PubMed.
- M. Blaszczyk, Appl. Environ. Microbiol., 1993, 59, 3951–3953 CAS.
- J. P. Shapleigh, The Denitrifying Prokaryotes, ed. M. Dworkin, Springer, New York, 2006, vol. 123, pp. 769–792 Search PubMed.
- H. Lu, K. Chandran and D. Stensel, Water Res., 2014, 64, 237–254 CrossRef CAS PubMed.
- C. S. Srinandan, M. Shah, B. Patel and A. S. Nerurkar, Bioresour. Technol., 2011, 102, 9481–9489 CrossRef CAS PubMed.
- W. Li, X. Y. Shan, Z. Y. Wang, X. Y. Lin, C. X. Li, C. Y. Cai, G. Abbas, M. Zhang, L. D. Shen, Z. Q. Hu, H. P. Zhao and P. Zheng, Water Res., 2016, 88, 758–765 CrossRef CAS PubMed.
- J. K. Thomsen, T. Geest and R. P. Cox, Appl. Environ. Microbiol., 1994, 60, 536–541 CAS.
- P. Tavares, A. S. Pereira, J. J. Moura and I. Moura, J. Inorg. Biochem., 2006, 100, 2087–2100 CrossRef CAS PubMed.
- M. J. Boulanger, M. Kukimoto, M. Nishiyama, S. Horinouchi and M. E. Murphy, J. Biol. Chem., 2000, 275(31), 23957–23964 CrossRef CAS PubMed.
- K. Kataoka, H. Furusawa, K. Takagi, K. Yamaguchi and S. Suzuki, J. Biochem., 2000, 127(2), 345 CrossRef CAS PubMed.
- K. Kobayashi, S. Tagawa, K. K. Deligeer and S. Suzuki, J. Biochem., 1999, 126, 408 CrossRef CAS PubMed.
- M. S. M. Jetten, M. Strous, K. T. van de Pas-Schoonen, J. Schalk, U. G. van Dongen, A. A. vande Graaf, S. Logemann, G. Muyzer, M. C. van Loosdrecht and J. G. Kuenen, FEMS Microbiol. Rev., 1998, 22, 421–437 CrossRef CAS PubMed.
- D. U. Van, M. S. Jetten and M. C. van Loosdrecht, Water Sci. Technol., 2001, 44, 153–160 Search PubMed.
Footnote |
| † Electronic supplementary information (ESI) available. See DOI: 10.1039/c7ew00252a |
| This journal is © The Royal Society of Chemistry 2018 |

