Cooperative effects of inorganic and organic structure-directing agents in ZSM-5 crystallization†
Aseem
Chawla‡
,
Rui
Li‡
,
Rishabh
Jain
 ,
R. John
Clark
,
James G.
Sutjianto
,
Jeremy C.
Palmer
,
R. John
Clark
,
James G.
Sutjianto
,
Jeremy C.
Palmer
 and
Jeffrey D.
Rimer
 *
*
Department of Chemical and Biomolecular Engineering, University of Houston, 4726 Calhoun Road, Houston, TX 77204, USA. E-mail: jrimer@central.uh.edu
First published on 30th October 2017
Abstract
Zeolite crystallization occurs in the presence of inorganic and/or organic structure-directing agents (SDAs) that facilitate the formation of microporous crystals with various pore geometries. One of the most common zeolites is ZSM-5 (MFI type), which is used as a catalyst and sorbent in a wide range of industrial applications. One of the challenges with ZSM-5 synthesis is to identify new and inexpensive organic SDAs that can tailor the physicochemical properties of the final product. The most frequently used SDA in ZSM-5 synthesis is tetrapropylammonium (TPA); however, recent studies have shown that the surfactant cetyltrimethylammonium (CTA) can be used as an alternative SDA. Here, we examine the effects of dual structure-directing agents using CTA and TPA as organic SDAs in combination with a variety of alkali metals as inorganic SDAs. Our findings reveal that the selection of SDA combinations has a significant impact on the kinetics of ZSM-5 crystallization, as well as the properties of the resulting crystals. Notably, we show that TPA/Na and CTA/K are optimal combinations of SDAs that can markedly alter the size, morphology, and aluminum distribution in ZSM-5. Using a combination of experiments and molecular modeling, we explore the use of CTA as an alternative organic SDA for zeolite MFI and show that we can achieve smaller crystals (ca. 600 nm) in similar time (<24 h) as syntheses employing TPA. Given the relatively low cost of CTA and its high market availability compared to other organic SDAs, these findings have the potential to impact commercial production of ZSM-5 for a variety of applications.
Design, System, ApplicationA method of synthesizing zeolite ZSM-5 (MFI framework) was designed wherein the surfactant cetyltrimethylammonium (CTA) is explored as an organic structure-directing agent (SDA) relative to common alternatives, such as tetrapropylammonium (TPA). The system examined in this body of work consists of a binary mixture of organic SDAs (CTA or TPA) and inorganic SDAs (alkali metals). Parametric assays reveal that CTA and K is an optimal combination that leads to small ZSM-5 crystals in relatively short synthesis time. Our findings also reveal that the judicious selection of organic/inorganic SDA combinations has a significant impact on the physicochemical properties of the final product, which ultimately impact the performance of these materials for commercial applications. Notably, ZSM-5 is one of the most widely used zeolites in industry for applications that include (but are not limited to) catalysis, adsorption, and separations. The immediate application of CTA-based synthesis is the establishment of a commercially-viable platform for ZSM-5 crystallization using an efficient SDA with considerable promise to supplant organics currently implemented in large-scale production of zeolites. |
Introduction
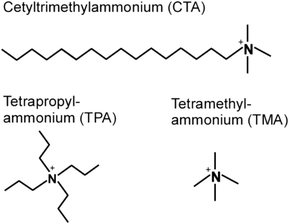
Zeolites are crystalline microporous aluminosilicates with unique properties, such as tunable acidity and exceptional (hydro)thermal stability, which are utilized in commercial processes ranging from ion-exchange and adsorption to catalysis and separations.1–4 In this study we focus on the synthesis of ZSM-5 (MFI framework type), which is heavily used in catalytic applications that include (but are not limited to) reforming,5 isomerization,6 hydrocracking,7 biomass conversion,8 and methanol to hydrocarbon (MTH) reactions.9 The MFI framework is comprised of a 3-dimensional (3D) pore network consisting of intersecting straight and sinusoidal channels (ca. 5.6 Å diameter). Among the approximate 230 known zeolite structures, the vast majority are synthesized in the presence of an organic structure-directing agent (OSDA),10 which is a molecule with a size and geometry similar to the channels or cages of zeolites; therefore, OSDAs facilitate pore formation, alter the kinetics of crystallization, and (in some instances) direct the incorporation of Al at specific tetrahedral sites within the crystal lattice.11 It is possible to synthesize ZSM-5 in the absence of an OSDA using sodium ions12,13 as inorganic structure-directing agents; however, the products of OSDA-free synthesis contain a significant amount of Al (i.e., Si/Al <20). In order to achieve higher Si content, which is often desirable for catalytic applications, an OSDA must be used in the growth mixture.The most common OSDA for zeolite MFI is tetrapropylammonium (TPA).14,15 Prior literature contains examples of other OSDAs, such as triethyl butyl ammonium bromide (TEBA),16 dimers and trimers of TPA,17,18 amines (e.g., triethanol amime19 and ethylene diamine16), and alcohols (e.g., 1,6-hexanediol20 and tetrabutyl alcohol21). Ryoo and coworkers reported the use of dual-porogenic surfactants containing quaternary ammonium groups to synthesize MFI nanosheets of several unit cell thickness.22 Other groups have also established that under appropriate conditions the surfactant cetyltrimethylammonium (CTA) can act as an OSDA for MFI crystallization.23–25 Prior studies have explored the use of CTA for alternative purposes, including its use as a crystal growth modifier to alter zeolite habit,26 as a mesoporogen,27 as a swelling agent in the preparation of 2-dimensional nanosheets from layered zeolites,28–32 and in post-synthesis treatment to induce mesoporosity.33–36 Few studies have explored the use of CTA strictly as an OSDA in zeolite synthesis as well as methods to optimize the physicochemical properties of ZSM-5 crystals produced by this OSDA. Examples include the work from Okubo and coworkers23 that introduced CTA-directed MFI synthesis, as well as a recent paper by Hensen and coworkers25 that highlighted the role of dual inorganic/organic structure-directing agents (SDAs). Interestingly, molecular analogues of CTA, such as tetramethylammonium (TMA) and its structural derivatives, do not direct the formation of MFI, but act as OSDAs for other zeolite structures (e.g., CAN, ERI, GIS, GME, LTA, LTN, MAZ, PHI, and SOD).37–42 This suggests that the hydrophobic tail of CTA (Scheme 1) is instrumental in its role as a structure-directing agent for MFI.
Alkali and alkaline earth metals are common inorganic SDAs in zeolite synthesis43 and are also found in a majority of natural zeolites.44 Inorganic SDAs function as extra-framework cations and have the ability to increase the rate of crystallization. For instance, Davis and coworkers observed a seven-fold increase in the rate of MTW crystallization in the presence of alkali metals.45 Prior studies have categorized the effects of inorganic SDAs on the basis of their ability to either promote or disrupt hydrogen bonding of water molecules around the cation, with subsequent displacement by (alumino)silicate species leading to the formation of nuclei.46 Notably, Li and Na ions are referred to as structure formers, while K, Rb, and Cs are structure breakers owing to their large ionic radius. In general, the rate of crystallization is reduced or enhanced in the presence of structure breakers or formers, respectively;47 however, it is not well understood how or why certain inorganic SDAs selectively promote the formation of a particular zeolite framework type, and how cations work in concert with organics to alter the kinetics of zeolite crystallization.
Herein, we investigate the effects of dual inorganic and organic SDAs on the synthesis of ZSM-5 through integrated experimental and molecular modeling studies. Comparisons are made using CTA and TPA as organic SDAs in combination with various alkali metals as the inorganic SDAs. Our findings reveal that the selection of specific organic/inorganic SDA combinations has a direct impact on the kinetics of MFI crystallization. Moreover, our findings indicate that SDA combinations influence the physicochemical properties of ZSM-5, which includes crystal size, morphology, and the number and/or spatial distribution of aluminum in the MFI framework. Time-resolved analysis of zeolite nucleation and crystal growth indicate a synergistic effect of organic and inorganic cations on MFI formation.
Methods
Materials
The following chemicals were purchased from Sigma-Aldrich (St. Louis, MO): LUDOX AS-30 (30 wt% suspension in water), LUDOX AS-40 (40 wt% suspension in water), tetraethylorthosilicate (TEOS, 98%), potassium hydroxide (85% pellets), aluminum sulfate hydrate (98%, 14–18 H2O, calculated as 18 H2O), hexadecyltrimethylammonium bromide (CTAB, BioXtra, ≥99%), tetrapropylammonium bromide (TPABr, 98%), and tetramethylammonium bromide (TMABr, 98%). Additional reagents used for the synthesis of ZSM-5 include sodium hydroxide (98% pellets, MACRON Fine Chemicals), lithium hydroxide (anhydrous 98%, Alfa Aesar), and cesium hydroxide (50% w/w aq. soln., Alfa Aesar). Deionized (DI) water used in all experiments was purified with an Aqua Solutions RODI-C-12A purification system (18.2 MΩ). All reagents were used as received without further purification.Crystallization of MFI zeolite
ZSM-5 crystals were synthesized from a growth mixture with a molar composition of 2 OSDA![[thin space (1/6-em)]](https://www.rsc.org/images/entities/char_2009.gif) :
:![[thin space (1/6-em)]](https://www.rsc.org/images/entities/char_2009.gif) 11.9 M2O
11.9 M2O![[thin space (1/6-em)]](https://www.rsc.org/images/entities/char_2009.gif) :
:![[thin space (1/6-em)]](https://www.rsc.org/images/entities/char_2009.gif) Al2O3
Al2O3![[thin space (1/6-em)]](https://www.rsc.org/images/entities/char_2009.gif) :
:![[thin space (1/6-em)]](https://www.rsc.org/images/entities/char_2009.gif) 90 SiO2
90 SiO2![[thin space (1/6-em)]](https://www.rsc.org/images/entities/char_2009.gif) :
:![[thin space (1/6-em)]](https://www.rsc.org/images/entities/char_2009.gif) 3588 H2O (OSDA = CTAB or TPABr; M = K and/or Na). Aqueous solutions of potassium hydroxide (0.33 g in 1.44 g of DI water) and aluminum sulfate (0.14 g in 1.44 g of DI water) were mixed with 5.76 g of water, and LUDOX AS-30 solution (3.76 g in 2.13 g of DI water) was added under vigorous stirring. AS-30 was used as the nominal silicon source unless otherwise stated. The resulting mixture was stirred for ca. 20 h at room temperature (referred to as aging). After aging, the OSDA (e.g., 0.1515 g CTAB) was added and the solution was left to stir for another 2 h at room temperature. The growth mixture (ca. 10 g) was then placed in a Teflon lined stainless steel acid digestion bomb (Parr Instruments) and was heated under rotation (30 rpm) and autogenous pressure in a Thermo Fisher Precision Premium 3050 Series gravity oven. The nominal time and temperature for ZSM-5 synthesis was 3 days at 160 °C. For X-ray and microscopy analyses, the particulates in the growth mixture (amorphous and/or crystalline) were isolated as a white powder by centrifugation (Beckman Coulter Avanti® J-E series high-speed centrifuge) at 13
3588 H2O (OSDA = CTAB or TPABr; M = K and/or Na). Aqueous solutions of potassium hydroxide (0.33 g in 1.44 g of DI water) and aluminum sulfate (0.14 g in 1.44 g of DI water) were mixed with 5.76 g of water, and LUDOX AS-30 solution (3.76 g in 2.13 g of DI water) was added under vigorous stirring. AS-30 was used as the nominal silicon source unless otherwise stated. The resulting mixture was stirred for ca. 20 h at room temperature (referred to as aging). After aging, the OSDA (e.g., 0.1515 g CTAB) was added and the solution was left to stir for another 2 h at room temperature. The growth mixture (ca. 10 g) was then placed in a Teflon lined stainless steel acid digestion bomb (Parr Instruments) and was heated under rotation (30 rpm) and autogenous pressure in a Thermo Fisher Precision Premium 3050 Series gravity oven. The nominal time and temperature for ZSM-5 synthesis was 3 days at 160 °C. For X-ray and microscopy analyses, the particulates in the growth mixture (amorphous and/or crystalline) were isolated as a white powder by centrifugation (Beckman Coulter Avanti® J-E series high-speed centrifuge) at 13![[thin space (1/6-em)]](https://www.rsc.org/images/entities/char_2009.gif) 000 rpm for 45 min. The solid was washed with DI water to remove the supernatant and the centrifuge/washing step was repeated a second time. The resulting solid was dried at ambient conditions. During the preparation of microscopy samples, the solid was dispersed in DI water and an aliquot of the suspension was placed on a glass slide and dried overnight. Crystals on the glass slide were transferred to SEM sample holders (Ted Pella) by gently pressing the glass slide on the carbon tape.
000 rpm for 45 min. The solid was washed with DI water to remove the supernatant and the centrifuge/washing step was repeated a second time. The resulting solid was dried at ambient conditions. During the preparation of microscopy samples, the solid was dispersed in DI water and an aliquot of the suspension was placed on a glass slide and dried overnight. Crystals on the glass slide were transferred to SEM sample holders (Ted Pella) by gently pressing the glass slide on the carbon tape.
Materials characterization
Powder X-ray diffraction (XRD) patterns of as made samples were collected on a Siemens D5000 X-ray diffractometer using a Cu Kα source (40 kV, 30 mA). Scanning electron microscopy (SEM) images were obtained with a LEO 1525 FEG system operated at 15 kV and a 5 mm working distance. All SEM samples were coated with a thin carbon layer (ca. 30 nm) prior to imaging. Textural analysis was performed with a Micromeritics ASAP 2020 instrument using N2 as a probe gas for physisorption at an incremental dosing rate of 3 m3 g−1 STP and an analysis bath temperature of 77 K. Prior to analysis, samples were calcined at 550 °C for 6 h under flow of compressed air at 100 cm3 min−1. The surface area was calculated from BET analysis selecting the initial low pressure points with a correlation coefficient greater than 0.999. The weight percentage of occluded organics in ZSM-5 samples were assessed by thermogravimetric analysis (TGA) using a TA instruments Q50 model and N2 as the carrier gas at a flow rate of 100 mL min−1. The temperature was ramped up to 800 °C at the rate of 1 °C min−1 with an isothermal dwell time of 10 min. X-ray photoelectron spectroscopy (XPS) data were collected by a Physical Electronics Model 5700 XPS instrument. A monochromatic Al Kα X-ray source (1486.6 eV) was used with the power of 350 W. All spectra were obtained once reaching a vacuum of 5 × 10⁻⁹ Torr or better. Elemental analysis of samples was conducted by energy dispersive X-ray (EDX) spectroscopy using a JEOL SM-31010/METEK EDAX system at 15 kV and 15 mm working distance. Dynamic light scattering (DLS) measurements were performed on a Brookhaven Instruments BI-200SM machine equipped with a TurboCorr Digital Correlator, a red HeNe laser diode (30 mW, 637 nm), and a decalin bath that was filtered to remove dust. The liquid sample cell was regulated at 25 °C with a Polyscience digital temperature controller. Samples were prepared by diluting zeolite growth mixtures in pre-filtered DI water (0.45 μm nylon syringe filter, Pall Life Sciences) to achieve reasonable scattering counts (>20![[thin space (1/6-em)]](https://www.rsc.org/images/entities/char_2009.gif) 000 count per s). At least three measurements were performed per sample. Autocorrelation functions were collected over a 2 min timeframe and the hydrodynamic diameter DH was analyzed by the method of cumulants to assess particle size distribution. Silica dissolution experiments were performed by adding colloidal silica to metal hydroxide solutions (pH = 12) in the absence of aluminum. Solutions were separated into different vials and heated at specified temperatures in a Julabo ED-5M/B water bath. Vials were removed at periodic times and immersed in ice to cool down to room temperature before performing DLS analysis.
000 count per s). At least three measurements were performed per sample. Autocorrelation functions were collected over a 2 min timeframe and the hydrodynamic diameter DH was analyzed by the method of cumulants to assess particle size distribution. Silica dissolution experiments were performed by adding colloidal silica to metal hydroxide solutions (pH = 12) in the absence of aluminum. Solutions were separated into different vials and heated at specified temperatures in a Julabo ED-5M/B water bath. Vials were removed at periodic times and immersed in ice to cool down to room temperature before performing DLS analysis.
Molecular modeling
Molecular dynamics (MD) simulations were performed with GROMACS 4.6.7 (ref. 48) to identify energetically favorable conformations of the OSDA molecules (i.e., CTA and TPA) within the MFI framework. The structure of MFI was modeled using the atomic positions and lattice parameters from the International Zeolite Association database. Interactions between zeolite framework atoms (Si and O) were described the ClayFF potential,49 whereas TPA and CTA were modeled using the generalized AMBER force field.50 Standard Lorentz–Berthelot combining rules were employed to determine the potential parameters for modeling van der Waals interactions between the SDAs and zeolite framework.51 Van der Waals and real-space Coulombic interactions were truncated using a cutoff of 0.9 nm, and the particle mesh Ewald method51 was used to treat long-range electrostatics. Parameters for the Ewald summation were chosen to ensure a relative error of less than 10−5 in the calculated energy. The equations of motion were integrated using a velocity-Verlet scheme with a 2 fs time step.51 A Bussi–Parrinello velocity-rescaling thermostat52 was used to maintain temperature, and constant pressure conditions were imposed using a Parrinello–Rahman barostat.53 A relaxation time constant of 2 ps was used for both the thermostat and barostat.Energetically favorable conformations for the OSDAs were sampled using a three-step procedure. In the first step, OSDA molecules were inserted into the zeolite framework. To avoid trapping the systems in high-energy conformations, the insertions were performed gradually using an alchemical transformation procedure54 in which the OSDAs were converted from an ideal gas to fully interacting molecules over the course of a 500 ps canonical ensemble MD simulation at 300 K. The details of this procedure follow those described by Kim et al.55 In the second step, the configurational energy of the system (OSDAs + zeolite framework) was minimized using the conjugate gradient algorithm. Minimization was stopped when the maximum pair-wise force fell below a threshold of 5 kJ mol−1 nm−1. Finally, in the third step, the energy-minimized configuration was used to initialize a ns-long isothermal-isobaric ensemble MD simulation at 300 K and 0 bar. The last half of each MD trajectory was used to evaluate the average energy for the system 〈Usys〉 and the stabilization energy56,57Es ≡ 〈Usys〉 − 〈Uzeo〉 − n〈USDA〉, where n is the number of SDA molecules in the system, and 〈USDA〉 and 〈Uzeo〉 are average energies computed for a single SDA molecule and the empty zeolite framework, respectively. Previous computational investigations have shown that Es computed in a similar manner is a good descriptor for identifying novel OSDAs to stabilize otherwise thermodynamically unstable zeolite polymorphs.56,57 For the purpose of this study, Es was used to identify energetically favorable arrangements of OSDAs that enhance the MFI framework stability. The three steps above were repeated to evaluate Es for ∼103 different conformations for each OSDA; favorable conformations with Es < 0 were kept for further analysis.
Results and discussion
MFI synthesis with organic and inorganic ion pairings
Here we investigate various combinations of inorganic and organic ions in ZSM-5 synthesis using two commonly reported SDAs for MFI – tetrapropylammonium (TPA) and Na – and two less commonly reported SDAs – cetyltrimethylammonium (CTA) and K. Beginning with studies of CTA, scanning electron micrographs reveal the formation of ca. 1.3 μm ZSM-5 crystals in the presence of K (Fig. 1A). In the presence of Na we observe ca. 650 nm crystals (Fig. 1B), which is a factor of 3 less than those reported in prior studies of CTA-directed MFI crystallization.23 The ability to produce small ZSM-5 crystals is associated, in part, to the SDA pairings. In addition, our findings indicate that crystal size is attributed to the use of colloidal silica compared to alternative silicon sources, such as tetraethylorthosilicate (TEOS). For instance, we prepared a ZSM-5 growth mixture with the same composition and switched from colloidal silica to TEOS. The resulting crystals (shown in Fig. 11B) were approximately three times larger, which highlights the importance of Si source selection in MFI synthesis.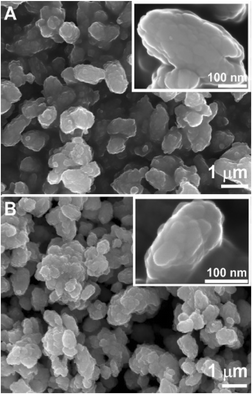 | ||
| Fig. 1 Scanning electron micrographs of ZSM-5 crystals synthesized with CTA as the OSDA in the presence of (A) potassium and (B) sodium cations. | ||
Meng et al. reported that combinations of CTA and K resulted in the formation of MFI, whereas solutions of CTA and Na did not produce crystals under the conditions tested.25 Here, we report that both SDA combinations result in MFI formation, with shorter crystallization times for solutions containing K. Notably, time-resolved powder X-ray diffraction (XRD) analysis of samples containing both CTA and K reveal that crystallization is complete within 17 h of hydrothermal treatment (Fig. 2A). We observed that the combination of CTA and Na results in MFI crystals after longer heating time (ca. 60 h), as shown in Fig. 2B. It should be noted that our experiments were performed at 160 °C compared to 140 °C in the study by Meng et al., which seems to indicate that crystals will form if given sufficient time to nucleate and grow. If true, this suggests that MFI crystallization potentially occurs in solutions containing CTA/Na at lower temperature with adequate heating time (i.e., >10 days at 140 °C).
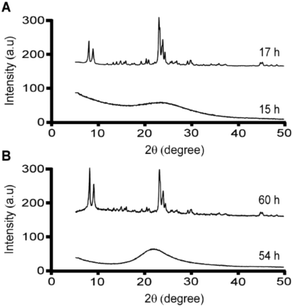 | ||
| Fig. 2 Powder X-ray diffraction patterns of solids extracted from ZSM-5 syntheses (at specified times) using CTA as the OSDA in the presence of (A) potassium and (B) sodium cations. | ||
The synergy observed in the combination of CTA and K is quite unexpected given that K is reported in literature to either slow MFI crystallization or suppress its formation.47 For instance, organic-free syntheses of ZSM-5 are possible using Na as an inorganic SDA,13 but to our knowledge MFI cannot form in the presence of K as the only SDA. Conversely, K is known to direct the formation of other zeolite frameworks (e.g., LTL, TON, and MER, among others).58–61 A systematic analysis of MFI growth mixtures containing CTA and varying ratios of K and Na reveal that there is a three-fold reduction in the induction time (Fig. 3) when switching from mixtures of CTA with Na to those with K. It should be noted that the reported induction times are an overestimation given that we use the first appearance of Bragg peaks in powder XRD patterns of extracted solids to estimate the onset of nucleation (i.e., peaks in XRD patterns appear once there is ca. 3% crystalline material in the sample).62
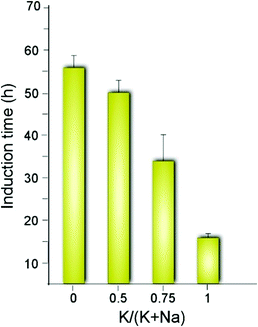 | ||
| Fig. 3 Approximate induction times estimated by the first appearance of Bragg peaks in powder XRD patterns. The x-axis indicates the inorganic SDA content as the molar ratio of potassium relative to the total alkali metal content in each ZSM-5 growth mixture. The corresponding time-elapsed XRD patterns are shown in Fig. S1 of the ESI.† | ||
By comparison we tested ZSM-5 synthesis using combinations of TPA and alkali metals and observed an opposite trend. Crystallization of ZSM-5 in the presence of Na is complete within ca. 24 h of hydrothermal treatment (Fig. S9†), whereas the combination of TPA and K yields a partially amorphous product (Fig. 4A). Scanning electron micrographs of products extracted after 24 h of heating also reveal dramatic differences in crystal morphology, which was not observed in samples prepared with CTA. For instance, growth mixtures containing TPA and K result in the formation of hexagonal crystals (ca. 6 μm) with residual amorphous precursors (Fig. 4A, arrow) clearly visible. SEM images of crystals prepared with TPA and Na reveal an ellipsoidal morphology (Fig. 4B) with smaller size (ca. 3 μm). The increased crystallization time for solutions containing K is qualitatively consistent with reports of MFI synthesis in literature. The ability of K to reduce crystallization time is only observed with CTA; therefore, our findings indicate that organic/inorganic SDA pairings do not follow identical trends, but are dependent upon the selected combination. The molecular mechanism(s) governing the cooperative effects of inorganic/organic SDA combinations is not well understood.
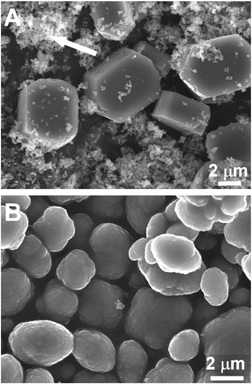 | ||
| Fig. 4 Scanning electron micrographs of ZSM-5 crystals synthesized with TPA as the OSDA. Growth mixtures were heated for 24 h in the presence of (A) potassium and (B) sodium. An arrow indicates the presence of residual amorphous precursors in the TPA/K-MFI sample. Powder XRD patterns of solids extracted from each synthesis are provided in Fig. S9.† | ||
TPA and CTA occlusion in MFI pores
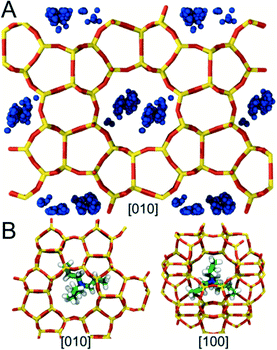
We also used MD to locate regions within the MFI framework where the OSDAs (TPA and CTA) become preferentially occluded during synthesis. Favorable conformations were identified by computing the stabilization energy Es for each OSDA in an MFI framework consisting of 36 unit cells (3 × 3 × 4) (see Methods). Modeling such a large system was necessary to avoid spurious self-interactions when inserting CTA, which is more than 2 nm in length in its fully extended conformation. To minimize the computational cost of the simulations, conformational sampling was performed using only a single OSDA molecule. The results from these simulations, however, were found to be qualitatively consistent with limited sets of calculations performed using higher OSDA loadings (i.e., 1 and 2 OSDAs per unit cell).The simulations predict that TPA preferentially occupies MFI's large pores located at the junctions where the straight and sinusoidal channels in the framework intersect (Fig. 5A). These pores are ∼0.7 nm in diameter, which is similar to the size of TPA (min/max dimensions: ∼0.65/0.91 nm). TPA adopts conformations inside these pores in which its N center sits near the center of the intersection and its bulky propyl groups extend into the adjoining channels (Fig. 5B). These favorable conformations significantly enhance the stability of the MFI framework (Es ∼ −530 kJ mol−1). Further, they are in excellent agreement with the TPA conformations deduced from nuclear magnetic resonance and X-ray diffraction measurements and predicted in other computational studies of MFI.63–66 By contrast, conformations in which the N center of TPA is located inside the straight or sinusoidal channels result in unfavorable steric interactions that destabilize the MFI framework (i.e., Es > 0). Hence, the simulations suggest that TPA is too large to become occluded in other regions within the framework.
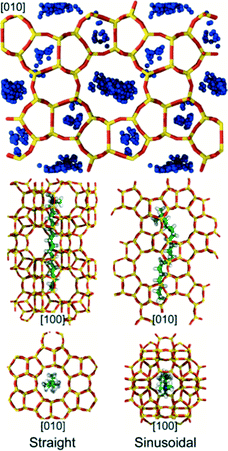
Whereas TPA molecules can only be accommodated in MFI's large pores, there are at least two distinct conformations accessible to CTA, which has a chain-like structure (min/max dimensions: ∼0.3/2.3 nm). In the first conformation, CTA occupies a straight channel with its trimethylammonium head group extending into one of MFI's large pores (Fig. 6). In the second conformation, CTA's backbone bends to allow it to occupy a sinusoidal channel (Fig. 6). While both conformations are favorable (Es ∼ −575 and −500 kJ mol−1, respectively), the former leads to greater framework stability and thus will be energetically preferred. Nevertheless, the similar magnitude of the stabilization energies suggest that CTA may be occluded in both conformations during zeolite synthesis. Although, to our knowledge, no prior computational studies have been performed to examine CTA occlusion in MFI, the first conformation is remarkably similar to those that have been previously posited on the basis of steric considerations.23,24 The second conformation, however, has not been previously hypothesized, which is likely due to the fact that it involves a complex rearrangement of CTA's backbone structure.
Impact of SDA pairings on Si/Al ratio
The inorganic and organic SDAs in this study are both capable of becoming extra-framework cations to counterbalance negatively-charged framework Al sites. The occlusion of TPA cations in MFI can direct Al siting at channel intersections, whereas Na has the capability of directing Al siting in straight and sinusoidal channels.67 It is postulated that Al siting in MFI68 and other frameworks11,69 is biased to particular tetrahedral sites, wherein the choice of organic and/or inorganic cations can alter Al distributions.70 Motivated by past studies of Al distribution, we examined the molar Si/Al ratio (SAR) of ZSM-5 crystals prepared with various SDA pairings (Fig. 7). To study the spatial distribution of Al, we used a combination of electron dispersive X-ray (EDX) spectroscopy and X-ray photoelectron spectroscopy (XPS). The former probes greater depths of particles, thereby assessing the bulk SAR, whereas XPS is a surface-sensitive technique with a shorter penetration depth that assesses the outer rim of zeolite crystals. Numerous studies have reported aluminum zoning in ZSM-5 crystals, which refers to a gradient in SAR (high to low Al content) from the outer rim of the crystal to its interior.71–73 The presence of an Al-rich rim has been observed for ZSM-5 crystals synthesized in the presence of TPA, whereas it is postulated that OSDA-free syntheses lead to a more homogenous Al distribution. This is seemingly true for ZSM-5 crystals prepared with a combination of TPA and K, which is aluminum zoned (Fig. 7). Interestingly, synthesis mixtures containing TPA and Na resulted in the opposite trend: crystals with a Si-rich exterior and a more aluminous interior. Combinations of CTA and alkali metals resulted in more homogenous Al distributions (i.e., similar SAR measurements by XPS and EDX), with a small degree of silicon zoning. It is evident from this study that the judicious selection of SDA combinations has a marked influence on the spatial distribution of Al sites in the MFI framework.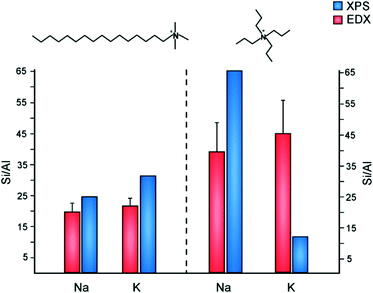 | ||
| Fig. 7 Elemental analysis of ZSM-5 samples using EDX (red) and XPS (blue) to measure the Si/Al molar ratio in the interior and exterior regions of crystals, respectively. ZSM-5 crystals were prepared using CTA (left) and TPA (right) as OSDAs in the presence of either sodium or potassium. It should be noted that prior literature74 states there is higher uncertainty in the Si/Al ratio of samples with low Al content measured by XPS (e.g., the TPA/Na-MFI sample). | ||
As shown in Fig. 7, EDX analysis reveals that the SAR of TPA-MFI crystals is approximately two-times higher than CTA-MFI crystals. This indicates that specific SDA combinations are capable of altering the degree of Al incorporation in framework sites; however, measurements of occluded organic by TGA reveal a relatively constant number of molecules per unit cell (labelled Z) for all SDA combinations: Z = 2.4, 2.2, 2.9, and 2.5 for CTA/K, CTA/Na, TPA/K, and TPA/Na, respectively. The inorganic and organic SDAs compensate the negative charge of framework Al, although it is not evident from our studies how Al is distributed within the straight and sinusoidal pores of the crystal structure (Fig. 8A). Moreover, it is understood that SDAs can stabilize defect sites (i.e., deprotonated siloxy groups), which is not explicitly considered in this discussion.
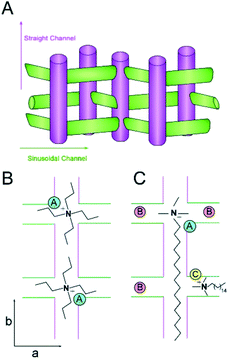 | ||
| Fig. 8 (A) Schematic of the straight and sinusoidal channels of MFI oriented along the b- and a-directions, respectively. (B and C) Idealized packing arrangements of TPA (B) and CTA (C) with equal Z (molecules per unit cell) based on MD simulations (note that these schemes are merely illustrative and the exact Al siting is unknown). The positive charge of the quaternary amine in CTA can balance the negative charge of a single Al heteroatom placed at either the intersection of straight and sinusoidal channels (“A”, blue) or within a channel (“C”, yellow). We propose that the short methyl groups of CTA allow for “B” sites (red) in regions near the CTA head group to be occupied by alkali metals (accommodating as many as three sites in this scheme). Conversely, the amines of two TPA molecules can direct one Al site per intersection. These idealized schematics suggest that CTA-MFI contains as many as 5 Al sites for every 2 sites in TPA-MFI, which is qualitatively consistent with an approximate two-fold difference in the Si/Al ratio (see Fig. 7). | ||
Schematics of SDA occlusion in the pores of MFI are depicted in Fig. 8B and C. In the idealized rending of SDA occupancy, we postulate that TPA places a single Al site at the intersection of straight and sinusoidal channels (i.e., “A” site in Fig. 8B). It could be argued on the basis of steric constraints that the propyl groups of TPA extending into adjoining channels reduce the likelihood of alkali metals occupying Al sites in close proximity of the organic. Conversely, molecular modeling of CTA occlusion in MFI (Fig. 6) revealed an energetic preference for its alignment with the straight channel (analogous to assumptions in prior literature25). This allows for Al siting at channel intersections near the tetraalkylammonium (head) group of CTA (i.e., “A” site in Fig. 8C). We postulate that the short methyl groups of CTA are less prohibitive for alkali metals to direct Al siting in vacancies or in close proximity of the head groups (sites “B” in Fig. 8C). CTA may also direct Al siting within the channels (e.g., illustrated as site “C” for a sinusoidal channel in Fig. 8C). It should be emphasized that the scenarios illustrated in Fig. 8 are merely suggestive, and do not reflect direct evidence of Al siting; however, the hypothesized sequence of Al positions is qualitatively consistent with the nearly two-fold difference in SAR of CTA- and TPA-MFI samples.
Putative effects of SDA pairings on MFI nucleation
Meng et al.25 reported a relatively short timeframe of MFI crystallization in the presence of CTA and K, which they attributed to the kinetics of silica dissolution. This is consistent with studies in literature showing that silica dissolves more rapidly in alkaline solutions of K compared to those of Na.75 Here, we confirmed this phenomenon using solutions similar to those of ZSM-5 synthesis, but in the absence of alumina. Alkaline solutions were prepared with colloidal silica (LUDOX AS-40) using the molar composition 20 SiO2![[thin space (1/6-em)]](https://www.rsc.org/images/entities/char_2009.gif) :
:![[thin space (1/6-em)]](https://www.rsc.org/images/entities/char_2009.gif) 0.2 MOH
0.2 MOH![[thin space (1/6-em)]](https://www.rsc.org/images/entities/char_2009.gif) :
:![[thin space (1/6-em)]](https://www.rsc.org/images/entities/char_2009.gif) 1030 H2O (with M = K and Na). The temporal reduction in the hydrodynamic diameter of silica particles was measured ex situ by dynamic light scattering (DLS) using a previously reported protocol.76 The results for KOH and NaOH are shown in Fig. 9A and S11,† respectively. The hydrodynamic diameter of colloidal silica decreases linearly with time. A monotonic increase in the slope, or rate of dissolution, is observed with an increase in temperature. It was noted that once the silica particles reach ca. 91% of their original size, dissolution ceases and the particle size remains constant (dashed line in Fig. 9A). This indicates that the solution is saturated (i.e., silica solubility).
1030 H2O (with M = K and Na). The temporal reduction in the hydrodynamic diameter of silica particles was measured ex situ by dynamic light scattering (DLS) using a previously reported protocol.76 The results for KOH and NaOH are shown in Fig. 9A and S11,† respectively. The hydrodynamic diameter of colloidal silica decreases linearly with time. A monotonic increase in the slope, or rate of dissolution, is observed with an increase in temperature. It was noted that once the silica particles reach ca. 91% of their original size, dissolution ceases and the particle size remains constant (dashed line in Fig. 9A). This indicates that the solution is saturated (i.e., silica solubility).
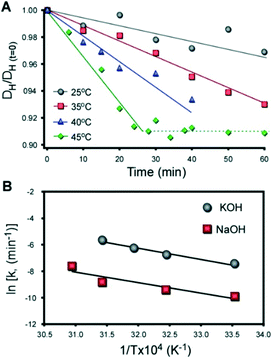 | ||
Fig. 9
Ex situ DLS measurements of silica dissolution in Al-free solutions. (A) Dissolution of colloidal silica (LUDOX AS-40) in an alkaline solution (pH 12) with a molar composition of 20 SiO2![[thin space (1/6-em)]](https://www.rsc.org/images/entities/char_2009.gif) : :![[thin space (1/6-em)]](https://www.rsc.org/images/entities/char_2009.gif) 0.2 KOH 0.2 KOH![[thin space (1/6-em)]](https://www.rsc.org/images/entities/char_2009.gif) : :![[thin space (1/6-em)]](https://www.rsc.org/images/entities/char_2009.gif) 1030 H2O at temperatures between 25 and 45 °C. The average hydrodynamic diameter of silica particles DH scaled by the initial size DH(t=0) (measured at t = 0 min) is plotted as a function of time. Solid lines are linear regression with slopes equaling the kinetic rate of dissolution. The dashed line corresponds to a plateau in particle diameter at solubility. Data for silica dissolution in NaOH is provided in Fig. S11.† (B) Arrhenius plot of silica dissolution in NaOH (red) and KOH (grey). The solids lines are linear regression (R2 = 0.86 and 0.98, respectively). The apparent activation energies of dissolution are EA = 66 and 69 kJ mol−1 for NaOH and KOH, respectively. 1030 H2O at temperatures between 25 and 45 °C. The average hydrodynamic diameter of silica particles DH scaled by the initial size DH(t=0) (measured at t = 0 min) is plotted as a function of time. Solid lines are linear regression with slopes equaling the kinetic rate of dissolution. The dashed line corresponds to a plateau in particle diameter at solubility. Data for silica dissolution in NaOH is provided in Fig. S11.† (B) Arrhenius plot of silica dissolution in NaOH (red) and KOH (grey). The solids lines are linear regression (R2 = 0.86 and 0.98, respectively). The apparent activation energies of dissolution are EA = 66 and 69 kJ mol−1 for NaOH and KOH, respectively. | ||
In synthesis mixtures the presence of alumina forms a shell surrounding silica particles that reduces the rate of dissolution.77 It is also expected that the adsorption of OSDAs would impact precursor dissolution; however, the kinetic data in Fig. 9 indicates that the rate of silica dissolution at the actual synthesis temperature should be 500–1000 times faster (i.e., on the order of seconds). Given that the timescale of zeolite nucleation is on the order of hours, it is reasonable to argue that dissolution is not the rate determining step in MFI crystallization.
An Arrhenius plot in Fig. 9B confirms that silica dissolves more rapidly in KOH compared to NaOH, but the apparent activation energy of dissolution is approximately equal for both alkali metals. We propose that differences in dissolution cannot account for the relatively short time of MFI crystallization by CTA/K. Indeed, if a short induction time was attributed to faster silica dissolution, we would anticipate similar outcomes for growth mixtures containing TPA/K, which we did not observe. The cooperative interactions between organic and inorganic SDAs that lead to significant differences in crystal nucleation and growth times, as well as the final crystal size and morphology, are not well understood. SDA combinations could potentially impact MFI growth by influencing the formation of composite building units, altering the solvation of (alumino)silicate species in solution and/or at crystal interfaces, which can subsequently influence monomer or oligomer addition to growing crystals, or display favorable packing configurations within the pores of MFI crystals. Elucidating the nature of cooperative SDA interactions is a topic that requires further analysis by concerted modeling and experimental efforts to identify their mechanism(s) of action.
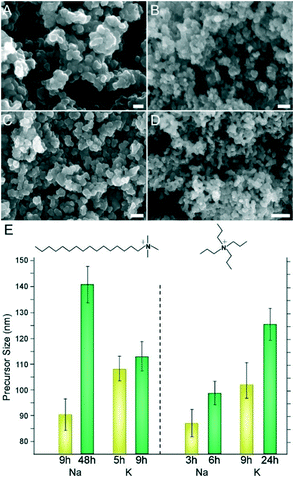
A common characteristic of zeolite growth mixtures is the presence of amorphous precursors, which can range in size from small nanoparticles78,79 to micron-sized agglomerates that are often referred to as worm-like particles (WLPs).26,58,80 During hydrothermal treatment, precursors evolve in size, composition, and/or microstructure, eventually reaching a steady state at a time that generally coincides with the end of the induction period. During crystal growth the population of precursors gradually reduces, and in many instances precursors are implicated in nonclassical pathways of growth, referred to as crystallization by particle attachment (or CPA).81 Prior studies of zeolites, such as zeolite L (LTL), revealed an apparent correlation between the final size of evolved precursors and crystallization time. Notably, the slower the rate of crystallization, the larger the average size of evolved precursors.58 In this study of ZSM-5 we observe similar trends. In Fig. 10 we report the size of precursors at early and later stages of crystallization for all four SDA combinations. When evaluating the differences in precursor size (from smallest to largest), we obtain the following order: TPA/Na < CTA/K < TPA/K < CTA/Na. This sequence matches the order of crystallization time, which is 12, 17, 48, and 60 h, respectively, which indicates that SDA combinations leading to faster crystallization (i.e., TPA/Na and CTA/K) provide less time for precursors to evolve. Similar observations for zeolite LTL have been reported when using modifiers (e.g., peptoids) that inhibit nucleation and allow more time for precursors to evolve.82
A comparison of ZSM-5 induction and crystal growth times are provided in Table 1 for various combinations of inorganic and organic SDAs with the addition of two alkali metals, Li and Cs. The induction time is estimated as the onset of Bragg peaks in powder XRD patterns (Fig. 2, S9, and S10†) where it is recognize that nucleation begins slightly before this point and may continue beyond it based on prior observations in literature.20,58 For estimates of crystal growth times we use a combination of powder XRD patterns and SEM images (Fig. S12†) to confirm that all amorphous precursors have been consumed (which is difficult to determine from XRD alone). Comparison of natural zeolites and prior literature of OSDA-free zeolite synthesis reveals that Li can direct structures such as EDI, ABW, EMT, FAU, and ANA,83 whereas Cs can direct the formation of TON, RHO, CHA, LTA, and ANA.83,84 In this study we found that combinations of CTA with either Li or Cs results in amorphous products. Conversely, MFI crystallization occurs in the presence of TPA with each alkali metal tested. The induction times for syntheses with Li and Cs are ca. 12 h, which is longer than those of Na and K; however, there is a substantial difference in the crystal growth times. Specifically, K and Cs have much longer growth times as compared to Li and Na, which is qualitatively consistent with the structure forming and structure breaking effects observed for different cations reported in literature.46,47
One notable difference between TPA and CTA is the amphiphilic nature of the latter that can lead to micelle formation at sufficiently high concentration. CTA is one of the most extensively studied surfactants, and in the presence of alkali metals it has been reported85 that when introducing Na salts to an aqueous CTAB solution (0.1 M CTAB), the dissociation enthalpy of the salts is an order of magnitude higher than that measured in water. Similar studies for K salts reveal that the relative increase in enthalpy (from water to a CTAB solution) is much less,85 which is inconsistent with the Hofmeister series that is used to explain differences in alkali salt dissociation in water and the potential influence of alkali metals on the critical micelle concentration of surfactants.85 To this end, we performed DLS measurements of CTA dissolved in KOH and NaOH solutions at room temperature (using the exact concentration of MFI synthesis, but without the addition of silica and alumina sources) to test the effect of alkali metals on CTA micellization. The scattering counts of the NaOH mixture was 1.5-times higher than that of KOH at 25 °C, indicating a higher concentration of CTA micelles in the former; however, the counts were insufficient to obtain reliable hydrodynamic diameters. It is also expected that the critical micelle concentration at 160 °C (i.e., the actual synthesis condition) will be different.86 Nevertheless, Na is a more effective promoter of CTA micellization than K, which may offer some insight into the latter's ability to increase the rate of MFI crystallization. If the interaction between organic and inorganic cations is indeed critical, this would also suggest that the effective TPA/Na combination is due to less favorable interactions between TPA and Na ions (relative to the interactions of TPA with other alkali metals).
Generation of mesoporosity by CTA
The most common uses of CTA in zeolite synthesis are associated with its role as a mesoporogen,27,87 as a post-synthesis agent to generate mesoporosity,88 or a swelling agent to generate 2-dimensional zeolites from layered structures.28 To this end, we performed textural analysis of MFI samples prepared with CTA and observed a type IV isotherm (Fig. 11A, i) that indicates the presence of mesoporosity. The t-plot external surface area contribution to the total surface area is 31% (or 139 m2 g−1) of the measured surface area of crystals. The shape of the adsorption/desorption curve suggests that mesopores are likely formed by nanocrystal aggregation, which is qualitatively consistent with SEM images in Fig. 1. Interestingly, when we switch silicon sources from LUDOX AS-30, which was used for all previous syntheses, to TEOS, we observed several notable differences in the crystalline product. Crystals prepared using TEOS exhibit a type 1 isotherm (Fig. 11A, ii) which is a characteristic of microporous materials without evidence of mesoporosity. Nitrogen adsorption measurements reveal that crystals prepared with TEOS have lower surface area (Table S2†). TEOS also leads to a 3-fold increase in crystal size (ca. 3 μm), as shown in Fig. 11B. Moreover, elemental analysis reveals that crystals prepared with TEOS have much higher silicon content (i.e., the SAR increases from 17 to 53). Overall, our parametric examination of MFI crystallization reveals that the physicochemical properties of ZSM-5 crystals can be tailored through the judicious selection of SDA combinations, synthesis conditions, and reagent sources.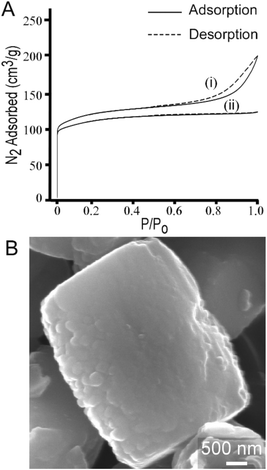 | ||
| Fig. 11 (A) N2 adsorption and desorption isotherms of calcined ZSM-5 crystals synthesized with CTA and Na as the SDAs using two different silica sources: (i) LUDOX AS-30, which results in a type IV isotherm indicating the presence of mesopores and (ii) TEOS, which results in a type I isotherm that is characteristic of microporous materials. Textural analysis of crystals prepared with TPA/alkali combinations exhibit type 1 isotherms (see Table S1 and Fig. S2†). (B) Scanning electron micrograph of a representative ZSM-5 crystal synthesized using TEOS (refer to Fig. S7† for the corresponding powder XRD pattern). Crystals prepared with TEOS are approximately three times larger than those prepared with colloidal silica. | ||
Conclusions
In summary, we have shown that CTA can be an effective SDA for ZSM-5 crystallization based on its ability to generate sub-micron particles in a period of time that is equivalent to more conventional SDAs, such as TPA. We have shown that CTA-directed growth of MFI crystals leads to a more uniform distribution of aluminium throughout the particle, which may be explained by computational simulations showing that CTA can access both straight and sinusoidal channels, unlike TPA that resides strictly at the intersection of the channels.Investigation of organic and inorganic SDA combinations reveals a cooperative effect between two positively-charge species that act as both structure-directing agents and extraframework cations. We observe that pairings of CTA/K and TPA/Na result in the fastest crystallization times, suggesting these combinations have a synergistic effect on ZSM-5 growth that is unique to the selection of SDAs. The ability of dual SDAs to alter the physicochemical properties of zeolite crystallization is a potentially useful approach to rational design. Moreover, the relatively low cost and high market availability of CTA makes it a promising candidate for commercial production of ZSM-5.
Conflicts of interest
The authors declare no competing financial interests.Acknowledgements
J. D. R. and J. C. P. acknowledge financial support from the National Science Foundation (DMREF Award 1629398) and from the Welch Foundation (Awards E-1794 and E-1882, respectively).References
- E. Erdem, N. Karapinar and R. Donat, J. Colloid Interface Sci., 2004, 280, 309–314 CrossRef CAS PubMed.
- Q. Wang, J. Luo, Z. Zhong and A. Borgna, Energy Environ. Sci., 2011, 4, 42–55 CAS.
- C. Martínez and A. Corma, Coord. Chem. Rev., 2011, 255, 1558–1580 CrossRef.
- M. A. Snyder and M. Tsapatsis, Angew. Chem., Int. Ed., 2007, 46, 7560–7573 CrossRef CAS PubMed.
- W. D. Zhang, B. S. Liu, C. Zhu and Y. Tian, Appl. Catal., A, 2005, 292, 138–143 CrossRef CAS.
- C. Fernandez, I. Stan, J. P. Gilson, K. Thomas, A. Vicente, A. Bonilla and J. Perez-Ramirez, Chem. – Eur. J., 2010, 16, 6224–6233 CrossRef CAS PubMed.
- A. Corma, J. Mengual and P. J. Miguel, Appl. Catal., A, 2012, 417, 220–235 CrossRef.
- J. Jae, G. A. Tompsett, A. J. Foster, K. D. Hammond, S. M. Auerbach, R. F. Lobo and G. W. Huber, J. Catal., 2011, 279, 257–268 CrossRef CAS.
- M. Bjorgen, S. Svelle, F. Joensen, J. Nerlov, S. Kolboe, F. Bonino, L. Palumbo, S. Bordiga and U. Olsbye, J. Catal., 2007, 249, 195–207 CrossRef CAS.
- M. Moliner, F. Rey and A. Corma, Angew. Chem., Int. Ed., 2013, 52, 13880–13889 CrossRef CAS PubMed.
- J. R. Di Iorio and R. Gounder, Chem. Mater., 2016, 28, 2236–2247 CrossRef CAS.
- E. Narita, K. Sato, N. Yatabe and T. Okabe, Ind. Eng. Chem. Prod. Res. Dev., 1985, 24, 507–512 CrossRef CAS.
- S. D. Kim, S. H. Noh, J. W. Park and W. J. Kim, Microporous Mesoporous Mater., 2006, 92, 181–188 CrossRef CAS.
- A. I. Lupulescu and J. D. Rimer, Angew. Chem., Int. Ed., 2012, 51, 3345–3349 CrossRef CAS PubMed.
- A. I. Lupulescu, W. Qin and J. D. Rimer, Langmuir, 2016, 32, 11888–11898 CrossRef CAS PubMed.
- N. L. Chauhan, J. Das, R. V. Jasra, P. A. Parikh and Z. V. P. Murthy, Mater. Lett., 2012, 74, 115–117 CrossRef CAS.
- G. Bonilla, I. Díaz, M. Tsapatsis, H.-K. Jeong, Y. Lee and D. G. Vlachos, Chem. Mater., 2004, 16, 5697–5705 CrossRef CAS.
- S. H. Keoh, W. Chaikittisilp, K. Muraoka, R. R. Mukti, A. Shimojima, P. Kumar, M. Tsapatsis and T. Okubo, Chem. Mater., 2016, 28, 8997–9007 CrossRef CAS.
- M. K. Naskar, D. Kundu and M. Chatterjee, J. Am. Ceram. Soc., 2012, 95, 449–452 CrossRef CAS.
- C. Falamaki, M. Edrissi and M. Sohrabi, Zeolites, 1997, 19, 2–5 CrossRef CAS.
- A. Aziz and K. S. Kim, J. Porous Mater., 2015, 22, 1401–1406 CrossRef CAS.
- M. Choi, K. Na, J. Kim, Y. Sakamoto, O. Terasaki and R. Ryoo, Nature, 2009, 461, 246–249 CrossRef CAS PubMed.
- T. Moteki, S. H. Keoh and T. Okubo, Chem. Commun., 2014, 50, 1330–1333 RSC.
- D. Xu, J. Feng and S. Che, Dalton Trans., 2014, 43, 3612–3617 RSC.
- L. Meng, B. Mezari, M. G. Goesten and E. J. M. Hensen, Chem. Mater., 2017, 29, 4091–4096 CrossRef CAS PubMed.
- M. Kumar, H. Luo, Y. Román-Leshkov and J. D. Rimer, J. Am. Chem. Soc., 2015, 137, 13007–13017 CrossRef CAS PubMed.
- Y. Jin, Y. Li, S. Zhao, Z. Lv, Q. Wang, X. Liu and L. Wang, Microporous Mesoporous Mater., 2012, 147, 259–266 CrossRef.
- S. Maheshwari, E. Jordan, S. Kumar, F. S. Bates, R. L. Penn, D. F. Shantz and M. Tsapatsis, J. Am. Chem. Soc., 2008, 130, 1507–1516 CrossRef CAS PubMed.
- K. Varoon, X. Zhang, B. Elyassi, D. D. Brewer, M. Gettel, S. Kumar, J. A. Lee, S. Maheshwari, A. Mittal, C.-Y. Sung, M. Cococcioni, L. F. Francis, A. V. McCormick, K. A. Mkhoyan and M. Tsapatsis, Science, 2011, 334, 72 CrossRef CAS PubMed.
- I. Ogino, M. M. Nigra, S.-J. Hwang, J.-M. Ha, T. Rea, S. I. Zones and A. Katz, J. Am. Chem. Soc., 2011, 133, 3288–3291 CrossRef CAS PubMed.
- L. Xu, X. Ji, S. Li, Z. Zhou, X. Du, J. Sun, F. Deng, S. Che and P. Wu, Chem. Mater., 2016, 28, 4512–4521 CrossRef CAS.
- S. Sabnis, V. A. Tanna, C. Li, J. Zhu, V. Vattipalli, S. S. Nonnenmann, G. Sheng, Z. Lai, H. H. Winter and W. Fan, Chem. Commun., 2017, 53, 7011–7014 RSC.
- J. Garcia-Martinez, M. Johnson, J. Valla, K. Li and J. Y. Ying, Catal. Sci. Technol., 2012, 2, 987–994 CAS.
- I. I. Ivanova and E. E. Knyazeva, Chem. Soc. Rev., 2013, 42, 3671–3688 RSC.
- J. Garcia-Martinez, C. Xiao, K. A. Cychosz, K. Li, W. Wan, X. Zou and M. Thommes, ChemCatChem, 2014, 6, 3110–3115 CrossRef CAS.
- J. Garcia-Martinez, K. Li and G. Krishnaiah, Chem. Commun., 2012, 48, 11841–11843 RSC.
- N. H. Ahn, S. Seo and S. B. Hong, Catal. Sci. Technol., 2016, 6, 2725–2734 CAS.
- J. K. Lee, J. H. Lee, N. H. Ahn, K. H. Cho and S. B. Hong, Chem. Sci., 2016, 7, 5805–5814 RSC.
- M. B. Park, S. H. Ahn, C. P. Nicholas, G. J. Lewis and S. B. Hong, Microporous Mesoporous Mater., 2017, 240, 159–168 CrossRef CAS.
- D. Jo, T. Ryu, G. T. Park, P. S. Kim, C. H. Kim, I. S. Nam and S. B. Hong, ACS Catal., 2016, 6, 2443–2447 CrossRef CAS.
- J. Bae, J. Cho, J. H. Lee, S. M. Seo and S. B. Hong, Angew. Chem., Int. Ed., 2016, 55, 7369–7373 CrossRef CAS PubMed.
- C. S. Blackwell, R. W. Broach, M. G. Gatter, J. S. Holmgren, D. Y. Jan, G. J. Lewis, B. J. Mezza, T. M. Mezza, M. A. Miller, J. G. Moscoso, R. L. Patton, L. M. Rohde, M. W. Schoonover, W. Sinkler, B. A. Wilson and S. T. Wilson, Angew. Chem., Int. Ed., 2003, 42, 1737–1740 CrossRef CAS PubMed.
- M. E. Davis and R. F. Lobo, Chem. Mater., 1992, 4, 756–768 CrossRef CAS.
- S. Wang and Y. Peng, Chem. Eng. J., 2010, 156, 11–24 CrossRef CAS.
- M. Goepper, H. X. Li and M. E. Davis, J. Chem. Soc., Chem. Commun., 1992, 1665–1666, 10.1039/c39920001665.
- Z. Gabelica, N. Blom and E. G. Derouane, Appl. Catal., 1983, 5, 227–248 CrossRef CAS.
- C. Liu, W. Gu, D. Kong and H. Guo, Microporous Mesoporous Mater., 2014, 183, 30–36 CrossRef CAS.
- B. Hess, C. Kutzner, D. van der Spoel and E. Lindahl, J. Chem. Theory Comput., 2008, 4, 435–447 CrossRef CAS PubMed.
- R. T. Cygan, J. J. Liang and A. G. Kalinichev, J. Phys. Chem. B, 2004, 108, 1255–1266 CrossRef CAS.
- J. M. Wang, R. M. Wolf, J. W. Caldwell, P. A. Kollman and D. A. Case, J. Comput. Chem., 2005, 26, 114–114 CrossRef CAS.
- D. Frenkel and B. Smit, Understanding molecular simulation : from algorithms to applications, Academic Press, San Diego, 2nd edn, 2002 Search PubMed.
- G. Bussi, D. Donadio and M. Parrinello, J. Chem. Phys., 2007, 126, 014101 CrossRef PubMed.
- M. Parrinello and A. Rahman, J. Appl. Phys., 1981, 52, 7182–7190 CrossRef CAS.
- M. R. Shirts, D. L. Mobley and J. D. Chodera, Annu. Rep. Comput. Chem., 2007, 41–59 CAS.
- S. B. Kim, J. C. Palmer and P. G. Debenedetti, J. Phys. Chem. B, 2015, 119, 1847–1856 CrossRef CAS PubMed.
- T. M. Davis, A. T. Liu, C. M. Lew, D. Xie, A. I. Benin, S. Elomari, S. I. Zones and M. W. Deem, Chem. Mater., 2016, 28, 708–711 CrossRef CAS.
- R. Pophale, F. Daeyaert and M. W. Deem, J. Mater. Chem. A, 2013, 1, 6750–6760 CAS.
- M. Kumar, R. Li and J. D. Rimer, Chem. Mater., 2016, 28, 1714–1727 CrossRef CAS.
- A. I. Lupulescu, M. Kumar and J. D. Rimer, J. Am. Chem. Soc., 2013, 135, 6608–6617 CrossRef CAS PubMed.
- Y.-H. Seo, E. A. Prasetyanto, N. Jiang, S.-M. Oh and S.-E. Park, Microporous Mesoporous Mater., 2010, 128, 108–114 CrossRef CAS.
- S. Teketel, W. Skistad, S. Benard, U. Olsbye, K. P. Lillerud, P. Beato and S. Svelle, ACS Catal., 2012, 2, 26–37 CrossRef CAS.
- V. P. Valtchev and K. N. Bozhilov, J. Phys. Chem. B, 2004, 108, 15587–15598 CrossRef CAS.
- E. D. Burchart, H. vanKoningsveld and B. vandeGraaf, Microporous Mater., 1997, 8, 215–222 CrossRef.
- Y. Yokomori and S. Idaka, Microporous Mesoporous Mater., 1999, 28, 405–413 CrossRef CAS.
- H. van Koningsveld, H. van Bekkum and J. C. Jansen, Acta Crystallogr., Sect. B: Struct. Sci., 1987, 43, 127–132 CrossRef.
- D. W. Lewis, C. M. Freeman and C. R. A. Catlow, J. Phys. Chem., 1995, 99, 11194–11202 CrossRef CAS.
- T. Yokoi, H. Mochizuki, S. Namba, J. N. Kondo and T. Tatsumi, J. Phys. Chem. C, 2015, 119, 15303–15315 CAS.
- T. Yokoi, H. Mochizuki, T. Biligetu, Y. Wang and T. Tatsumi, Chem. Lett., 2017, 46, 798–800 CrossRef.
- K. Muraoka, W. Chaikittisilp and T. Okubo, J. Am. Chem. Soc., 2016, 138, 6184–6193 CrossRef CAS PubMed.
- T. Biligetu, Y. Wang, T. Nishitoba, R. Otomo, S. Park, H. Mochizuki, J. N. Kondo, T. Tatsumi and T. Yokoi, J. Catal., 2017, 353, 1–10 CrossRef CAS.
- R. Althoff, B. Schulzdobrick, F. Schuth and K. Unger, Microporous Mater., 1993, 1, 207–218 CrossRef CAS.
- M. Padovan, G. Leofanti, M. Solari and E. Moretti, Zeolites, 1984, 4, 295–299 CrossRef CAS.
- N. Danilina, F. Krumeich, S. A. Castelanelli and J. A. van Bokhoven, J. Phys. Chem. C, 2010, 114, 6640–6645 CAS.
- A. E. Hughes, K. G. Wilshier, B. A. Sexton and P. Smart, J. Catal., 1983, 80, 221–227 CrossRef CAS.
- P. W. J. G. Wijnen, T. P. M. Beelen, J. W. de Haan, C. P. J. Rummens, L. J. M. van de Ven and R. A. van Santen, J. Non-Cryst. Solids, 1989, 109, 85–94 CrossRef CAS.
- M. D. Oleksiak, J. A. Soltis, M. T. Conato, R. L. Penn and J. D. Rimer, Chem. Mater., 2016, 28, 4906–4916 CrossRef CAS.
- R. K. Iler, J. Colloid Interface Sci., 1973, 43, 399–408 CrossRef CAS.
- A. I. Lupulescu and J. D. Rimer, Science, 2014, 344, 729–732 CrossRef CAS PubMed.
- M. Shete, M. Kumar, D. Kim, N. Rangnekar, D. Xu, B. Topuz, K. V. Agrawal, E. Karapetrova, B. Stottrup, S. Al-Thabaiti, S. Basahel, K. Narasimharao, J. D. Rimer and M. Tsapatsis, Angew. Chem., Int. Ed., 2017, 56, 535–539 CrossRef CAS PubMed.
- N. Ren, B. Subotic, J. Bronic, Y. Tang, M. D. Sikiric, T. Misic, V. Svetlicic, S. Bosnar and T. A. Jelic, Chem. Mater., 2012, 24, 1726–1737 CrossRef CAS.
- J. J. De Yoreo, P. Gilbert, N. Sommerdijk, R. L. Penn, S. Whitelam, D. Joester, H. Z. Zhang, J. D. Rimer, A. Navrotsky, J. F. Banfield, A. F. Wallace, F. M. Michel, F. C. Meldrum, H. Colfen and P. M. Dove, Science, 2015, 349, aaa6760 CrossRef PubMed.
- R. Li, A. Smolyakova, G. Maayan and J. D. Rimer, Chem. Mater., 2017 DOI:10.1021/acs.chemmater.7b03798.
- M. D. Oleksiak and J. D. Rimer, Rev. Chem. Eng., 2014, 30, 1–49 CrossRef CAS.
- P. J. Hogan, T. V. Whittam, J. J. Birtill and A. Stewart, Zeolites, 1984, 4, 275–279 CrossRef CAS.
- J. W. Larsen and L. J. Magid, J. Am. Chem. Soc., 1974, 96, 5774–5782 CrossRef CAS.
- A. Modaressi, H. Sifaoui, B. Grzesiak, R. Solimando, U. Domanska and M. Rogalski, Colloids Surf., A, 2007, 296, 104–108 CrossRef CAS.
- A. Sachse and J. García-Martínez, Chem. Mater., 2017, 29, 3827–3853 CrossRef CAS.
- N. Linares, A. Sachse, E. Serrano, A. Grau-Atienza, E. De Oliveira Jardim, J. Silvestre-Albero, M. A. L. Cordeiro, F. Fauth, G. Beobide, O. Castillo and J. García-Martínez, Chem. Mater., 2016, 28, 8971–8979 CrossRef CAS.
Footnotes |
| † Electronic supplementary information (ESI) available. See DOI: 10.1039/c7me00097a |
| ‡ Authors contributed equally. |
| This journal is © The Royal Society of Chemistry 2018 |

