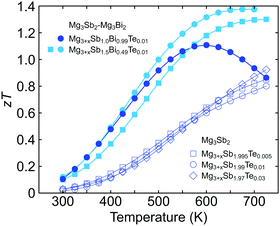
Band engineering in Mg3Sb2 by alloying with Mg3Bi2 for enhanced thermoelectric performance†
Kazuki
Imasato
 a,
Stephen Dongmin
Kang
 ab,
Saneyuki
Ohno‡
 ab and
G. Jeffrey
Snyder
 *a
*a
aDepartment of Materials Science and Engineering, Northwestern University, Evanston, IL 60208, USA. E-mail: jeff.snyder@northwestern.edu
bDepartment of Applied Physics and Materials Science, California Institute of Technology, Pasadena, CA 91125, USA
First published on 20th November 2017
Abstract
Mg3Sb2–Mg3Bi2 alloys show excellent thermoelectric properties. The benefit of alloying has been attributed to the reduction in lattice thermal conductivity. However, Mg3Bi2-alloying may also be expected to significantly change the electronic structure. By comparatively modeling the transport properties of n- and p-type Mg3Sb2–Mg3Bi2 and also Mg3Bi2-alloyed and non-alloyed samples, we elucidate the origin of the highest zT composition where electronic properties account for about 50% of the improvement. We find that Mg3Bi2 alloying increases the weighted mobility while reducing the band gap. The reduced band gap is found not to compromise the thermoelectric performance for a small amount of Mg3Bi2 because the peak zT in unalloyed Mg3Sb2 is at a temperature higher than the stable range for the material. By quantifying the electronic influence of Mg3Bi2 alloying, we model the optimum Mg3Bi2 content for thermoelectrics to be in the range of 20–30%, consistent with the most commonly reported composition Mg3Sb1.5Bi0.5.
Conceptual insightsIn thermoelectrics, band engineering through alloying has been very successful by focusing on the straightforward benefits of band convergence. On the other hand, the engineering of band mass is more complicated as the band mass is typically correlated with changes in the band gap. While charge carriers with small band mass typically have higher weighted mobilities needed for efficient thermoelectrics, the smaller band mass is often associated with a smaller band gap that leads to detrimental bipolar conduction at high temperatures and a lower peak zT. Although a larger band gap may allow a higher peak zT at a higher temperature, at lower temperatures the zT is likely to be lower because of the higher effective mass. The conceptual insight here is that for a material with limited thermal stability the band gap can be reduced to improve zT. This concept highlights the importance to consider the thermal stability and both the n- and p-type weighted mobilities as a prerequisite for band engineering. |
Introduction
Thermoelectric materials have the ability to convert heat directly into electricity without any mechanical motion.1,2 Since the main obstacle for wide-use of thermoelectrics is the low conversion efficiency limited by the materials, material research has been focused on developing high efficiency materials.The maximum power and efficiency achievable by a particular thermoelectric material is determined by their figure of merit zT = (S2σ)/κT where S is the Seebeck coefficient, σ is the electrical conductivity, κ is the thermal conductivity and T is the absolute temperature. Strategies to enhance zT can be largely categorized into two different methods. One is by reducing the lattice thermal conductivity, for example, by increasing phonon scattering with alloying.3–8 The other is by changing the electronic structure, i.e. band engineering.9–13
A recently developed new material where both strategies were successfully used to reach a high zT ≈ 1.5 is n-type Mg3+xSb2Bi0.49Te0.01, first reported by Tamaki et al.14 and followed by other groups.15–17 Excess-Mg nominal compositions (x as high as 0.2) were used to synthesize n-type compounds and take advantage of the multi-valley conduction band as predicted by density functional theory (DFT) calculations (Fig. 1).14 The thermodynamic explanation behind this excess-Mg strategy to overcome the persistent p-type behavior18–21 was later clarified by Ohno et al.16 Mg3Bi2-alloying was introduced to reduce the lattice thermal conductivity, because Mg3Sb2 and Mg3Bi2 are expected to form solid solutions. Te doping was used to optimize the carrier concentration.
In previous studies, the role of Bi in enhancing zT has mostly been attributed to Sb–Bi disorder that reduces thermal conductivity by disorder scattering of phonons.14,15,17 However, alloying Mg3Sb2 with Mg3Bi2 also has a significant impact on the electronic structure.14 This influence is readily anticipated by the fact that Mg3Bi2 is a semi-metal while Mg3Sb2 is a semiconductor.18–20,22,23Fig. 1 illustrates the features of the electronic structure that is expected to change with the alloying of Mg3Bi2, based on DFT calculations. In addition to the reduction of the band gap, the band effective mass of individual bands  is also expected to decrease with Mg3Bi2 alloying. Such correlation between
  and Eg is a commonly observed tendency explained with the interaction between the valence and conduction bands.24 Furthermore, the shift of bands due to alloying, in general, could cause band convergence that is beneficial for thermoelectric properties.12 These changes in the electronic structure suggest that there would be an optimum Mg3Bi2 content. More Mg3Bi2 would result in increased mobility due to the lighter
  ; however, a reduced band gap would compromise the peak zT value because of the onset of bipolar conduction being shifted to lower temperatures.25,26 In addition to the competing changes in electronic properties, the lattice thermal conductivity of the compounds will have a minimum when the fraction of Bi and Sb are nearly equal, due to the alloy-scattering of phonons.
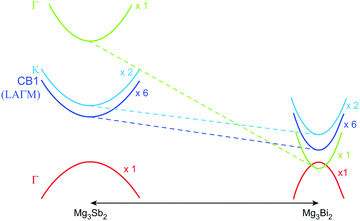 | ||
| Fig. 1 Schematic of changes in the Mg3Sb2 band structure due to Mg3Bi2 alloying. Alloying leads to a smaller band gap, and also a reduced band effective mass which leads to a higher mobility. The valence band in Mg3Sb2 is a single-valley, whereas the conduction band (CB1) is a multi-valley with a degeneracy of six. The minimum of the CB1 band is in the LAΓM plane, but not at a high symmetry point; when CB1 is plotted along the M–L direction, it apparently appears to have a higher minimum energy than the K band.15,23 The true minimum of the CB1 is significantly lower in energy than the K band.14 The dashed lines illustrate how the Vegard's law would predict the bands to shift (with respect to the valence band). The solid-solution behavior of the material is evidenced from diffraction (see ESI†). | ||
Closely related to understanding the bipolar-limited peak zT is the contrasted transport properties of the valence and conduction bands. For example, if the conduction band has a significantly higher weighted mobility than the valence band, the n-type material would have less contribution from minority carriers than for the p-type material (for a given EF). Therefore, quantifying the weighted mobility of the n- and p-type bands is an essential prerequisite for engineering the band structure with an optimum content of Mg3Bi2. The contrasted transport properties of n- and p-type have been understood so far only in a rather qualitative matter.
In this study, by modeling both n- and p-type, and also both Mg3Bi2-alloyed and non-alloyed Mg3Sb2 samples, we illustrate how the DFT-predicted band structure is consistent with the trend of changes in Seebeck effective masses and mobilities seen in transport properties. We then explain how the optimum Mg3Bi2 content balances the benefits from increased weighted mobility and reduced lattice thermal conductivity with the disadvantage of a decreased band gap, which enables us to show the origin of the highest peak zT composition in Mg3+x(Sb,Bi)2−yTey.
Band structure analyzed with  and μ0
A useful metric that relates the band structure to experimental measurements is the Seebeck effective mass  which is extracted by combining thermopower and Hall measurements (Pisarenko plots).26 By comparing
  and the mobility parameter μ0 between n- and p-type, or Mg3Bi2-alloyed and non-alloyed Mg3Sb2 samples, it is possible to infer differences in the band structure. For example, if
  is found larger in the n- than p-type, it would indicate a higher density-of-states in the conduction band. Largely, two distinct cases could lead to such a higher density-of-states: presence of either a heavier band (i.e. a small curvature at the band edge, heavy
  ) or multiple bands (e.g. band-degeneracy). In the case of a heavier band, μ0 would typically be found smaller (assuming that other properties such as the deformation potentials27 are similar). On the other hand, when multi-valley bands are contributing, μ0 is identical to that of just a single valley (in the limit of negligible intervalley scattering). If μ0 is found similar in both n- and p-type despite a large difference in
  , then the difference in density-of-states could be attributed to the presence of multiple bands. Therefore, with μ0 and
  pairs, we can see if the transport properties are consistent with the DFT-predicted band structure.
To obtain  , the reduced Fermi-level η = EF/kBT is first found from the experimental thermopower by solving the following equation (assumes relaxation time τ ∝ E−1/2):28
 | (1) |
 | (2) |
 | (3) |
 increases with carrier concentration (∝ nH2/3) indicating that
  is related to the density-of-states. We use this procedure on a multiple of samples with different doping levels (i.e. different Te content). For samples with the identical type of carriers (n- or p-type) and Mg3Bi2 content,
  appears to be nearly constant (Fig. 2a), indicating that
  is a stable way to characterize the conduction and valence bands.
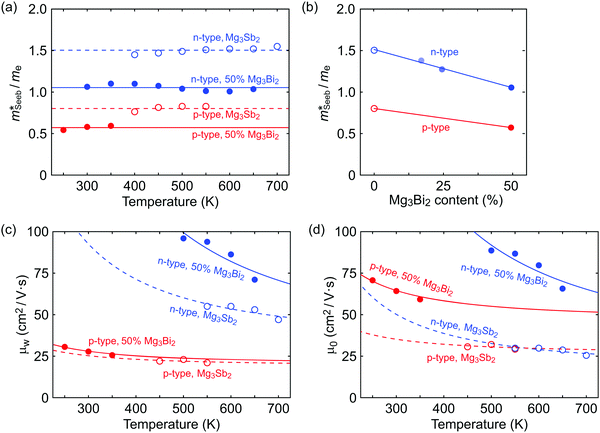 | ||
| Fig. 2 (a and b) Seebeck effective mass of the Mg3Sb2 (open circles) and Mg3Sb2–Mg3Bi2 alloy (filled circles) samples. (c) Weighted mobility and (d) Mobility parameter as a function of temperature. The lines show a fit to the μw ∝ T−3/2 dependency (phonon scattering). All data points are from temperatures where bipolar conduction is not significant, representing the property of majority carriers. For weighted mobility, the low-temperature points where the mobility is grain-boundary limited32,33 was excluded. The p-type Mg3SbBi data were taken from ref. 18. All other data are from the current study. | ||
The mobility parameter μ0 can be extracted from weighted mobility μw, which is an essential parameter for thermoelectrics that determines the magnitude of conductivity for a given reduced Fermi-level:
 | (4) |
 | (5) |
 determined previously (Fig. 2a and b). μ0 is the mobility of a carrier at kBT higher than the band edge.
It is seen that n-type Mg3Sb2 has a larger  than p-type samples (Fig. 2b), while μ0 is similar (Fig. 2d). This is a signature consistent with the multi-valley conduction band and single valley valence band structure (Fig. 1). It is this multi-valley feature of the conduction band that is mostly responsible for the superior μw, and thus the better thermoelectric performance of the n-type. The ratio of the
  between n- and p-type is about 1.9, somewhat smaller than (NV = 6)2/3 = 3.3 which indicates that the
  of the individual conduction pocket could be lighter than the valence band pocket rather than being similar.
The Mg3Bi2 alloying effect is seen by the monotonic decrease in  with increasing Mg3Bi2 content (Fig. 2b), accompanied with an increase in μ0 (Fig. 2d). This trend is seen in both n- and p-type samples, and suggests the band masses are becoming lighter with alloying, as opposed to band convergence which should give a peak in
  .12 Lighter band masses typically give better μw for carriers scattered by phonons, as is indeed observed in Fig. 2c. An increased μw is always beneficial for thermoelectrics (other than that it usually accompanies a reduced band gap), as we can see from the definition of the dimensionless material quality factor B:26,29–31
 | (6) |
Band gap and bipolar effects analyzed with the peak thermopower
Alloying with Mg3Bi2 is expected to reduce the band gap, as can be seen in Fig. 1. The alloying effect on the band gap can be analyzed by the Goldsmid-Sharp gap, together with a correction method. The Goldsmid-Sharp gap EGS is found from the peak thermopower (Smax) with respect to temperature and the temperature at which it occurs (Tmax).| EGS = 2e|Smax|Tmax | (7) |
Using the μw and EGS extracted for both n- and p-type samples with different Mg3Bi2 content, we find the true gap 0.54 eV (±0.05 eV due to uncertainty in Tmax) for Mg3Sb2 and its linear decrease with increasing Mg3Bi2 content in the Mg3+xSb2−yBiy solid solution (Fig. 3a). As expected from the contrast in weighted mobilities, the uncorrected band gap EGS (open circle in Fig. 3a) of n- is much higher than that of the p-type. By using the correction method,34 consistent estimates of the true band gap Eg were obtained. The decreasing trend in the band gap with respect to Mg3Bi2 content extrapolates to a negative gap at pure Mg3Bi2, which is indeed reported to show semi-metallic behavior.18–20,22,23
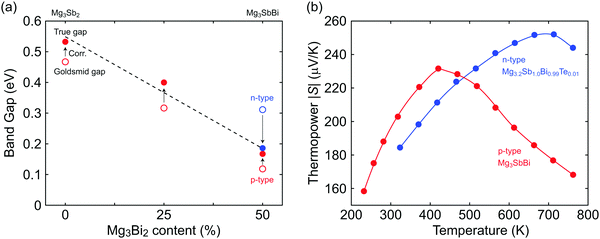 | ||
| Fig. 3 (a) The reduction in band gap due to alloying with Mg3Bi2. Open circles represent the Goldsmid gap estimated by eqn (7). The solid circles are estimations of the true gap by using a correction method that uses the μw ratio between n- and p-type carriers.34 The true gaps individually estimated from n- and p-type samples coincide. Linear interpolation of the trend for the true gap is shown by the dashed line. (b) Thermopower peaks with respect to temperature shown for n- and p-type Mg3SbBi (similar Mg3Bi2 content). The peak thermopower shows a higher value at a higher temperature in n-type, which indicates a higher μw for the n-type carriers. | ||
The advantage of the high contrast in n- and p-type μw's is readily noticeable in the comparison of n- and p-type thermopower curves with respect to temperature (Fig. 3b). Smax and Tmax are higher in n-type, which is beneficial in reaching a higher peak zT, at the expense of lower values in the p-type.
The optimum Mg3Bi2 content for thermoelectrics
Whether a larger band gap, which leads to a higher peak zT at a higher temperature, could be useful depends on the stable temperature range of the material. The maximum operation temperature must be decided to gauge the benefits of widening the band gap.Experimentally it has been noticed that Mg3Sb2 is not stable over long periods above 750 K due to the high vapor pressure of Mg, which leads to a decrease in the solubility of the n-type dopants (i.e. Te) and thus a loss of n-type carriers.16 Therefore, for deciding the optimum Mg3Bi2 content, we assume the maximum operation temperature for Mg3Bi2-alloyed samples to be around 700–750 K, and limit the optimization space to where the peak zT is found below this temperature.
We note that the expected peak zT temperature is above the maximum operation temperature in Mg3Sb2. As shown in Fig. 4, the zT values of Mg3Sb2 samples are still increasing after the maximum operation temperature. A higher zT value would be achievable if the sample were to reach a higher temperature (which is not possible due to stability). Because the peak zT is stability-limited rather than band-gap limited in Mg3Sb2, it is beneficial to reduce the band gap until the peak zT temperature is within the stability range and gain an increased μw. Because of this stability limit, we found that alloying Mg3Bi2 up to 25% is purely beneficial without compromises in any transport properties. Alloying Mg3Bi2 much more than this amount results in a lower zT peak value at a lower temperature as shown by the case of Mg3+xSb1.00Bi0.99Te0.01.
The optimum Mg3Bi2 content is found by collectively considering the impact of Mg3Bi2 alloying on the band-gap, μw and also lattice thermal conductivity. We linearly interpolate μw and Eg with respect to Mg3Bi2 content as an empirical estimation. For lattice thermal conductivity, we describe the approximate trend by using the relation between κL,alloy and κL,pure proposed by Callaway35 and Klemens.36
Here θD is the Debye temperature, Ω is the volume per atom, ν is the average speed of sound, and Γ is the scattering parameter mainly caused by mass fluctuation. Γ can be calculated by the modified Klemens model.5 Then, by combining these data, we calculate the peak zT below 725 K as a function of Mg3Bi2 content (Fig. 5). We find the optimum Mg3Bi2 composition in the range of 20–30% which is indeed close to the experimentally successful composition reported in the literature.14
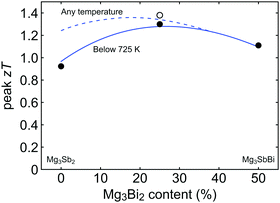 | ||
| Fig. 5 Peak zT as a function of the Mg3Bi2 alloyed with Mg3Sb2. Model calculation for the peak zT below 725 K (stability temperature) is indicated with the solid line, while the peak zT within an unrestricted temperature limit is shown with the dashed line. It is seen that the peak zT is stability-temperature-limited up to 30–40% of Mg3Bi2 content. The optimum is found in the range of 20–30% Mg3Bi2 content. Experimental values are plotted together for comparison (circles). The open circle corresponds to a sample with lower than typical lattice thermal conductivity and thus a higher zT.37 | ||
Conclusion
The electronic structure of Mg3Sb2 and its alloy with Mg3Bi2 was studied by analyzing the transport properties with an effective mass approach. Heavier Seebeck effective mass and larger weighted mobility in n- than p-type were observed, which is a signature of the higher band degeneracy of the conduction band. Mg3Sb2–Mg3Bi2 alloys showed a decrease in Seebeck effective mass and increase in weighted mobility, indicative of a larger curvature in each individual band (lighter band mass). This change accompanied a decrease in the band gap. Since the band gap of the Mg3Sb2 (0.5–0.6 eV) makes the zT peak at a temperature higher than the stability limit, we find the Mg3Bi2-alloying to be electronically beneficial for thermoelectrics despite the reduction in band gap. By empirically modeling the transport property changes due to alloying, we find the optimum Mg3Bi2 content in the range of 20–30%, which is in good agreement with the experimental observation.Experimental method
Pure elemental materials of magnesium turnings (99.98%, Alfa Aesar), antimony shots (99.9999%, Alfa Aesar), bismuth granules (99.997%, Alfa Aesar) and tellurium lumps (99.999%, Alfa Aesar) were loaded according to the nominal composition and sealed into stainless-steel vials with two half inch stainless-steel balls inside the argon-filled glove box. Mechanical reaction was conducted by high energy-ball milling with a high-energy mill (SPEX 8000D) for two hours. The reacted powder was extracted from vials and transferred into a graphite die under argon atmosphere to prevent the oxidization of the materials. Subsequently, induction heating rapid hot press was conducted for 1 hour at 873 K and 45 MPa under argon gas flow to consolidate pellet samples.38 Pressed samples were gradually cooled down to room temperature with no load. The Seebeck coefficient of each sample was measured with Chromel-Nb thermocouples in a two-probe configuration under high vacuum.39 The Hall coefficient and electric resistivity was measured simultaneously using a 4-point probe van der Pauw technique with a 2 T magnetic field under high vacuum. Thermal diffusivity D was measured by using the flash method with a Netzsch LFA 457 under dynamic argon atmosphere. The thermal conductivity κ was calculated by κ = D × Cp × d, where d is the geometrical density and Cp is the heat capacity. Average values of the heat capacity reported in previous studies (Tamaki et al.14 for Mg3Bi2-alloyed samples, Bhardwaj et al.40 for non-alloyed Mg3Sb2 samples) were used for the calculations.Conflicts of interest
There are no conflicts to declare.Acknowledgements
The authors would like to acknowledge support from the U.S. Department of Energy, Office of Science, Basic Energy Sciences through the Solid-State Solar-Thermal Energy Conversion Center (S3TEC), an Energy Frontier Research Center (DE-SC0001299), and also from the NASA Science Mission Directorate's Radioisotope Power Systems Thermoelectric Technology Development program. KI acknowledges support from Funai Foundation for Information Technology.References
- L. E. Bell, Science, 2008, 321, 1457–1461 CrossRef CAS PubMed.
- G. J. Snyder and E. S. Toberer, Nat. Mater., 2008, 7, 105–114 CrossRef CAS PubMed.
- A. Zevalkink, J. Swallow, S. Ohno, U. Aydemir, S. Bux and G. J. Snyder, Dalton Trans., 2014, 43, 15872–15878 RSC.
- H. Wang, A. D. Lalonde, Y. Pei and G. J. Snyder, Adv. Funct. Mater., 2013, 23, 1586–1596 CrossRef CAS.
- J. Yang, G. P. Meisner and L. Chen, Appl. Phys. Lett., 2004, 85, 1140–1142 CrossRef CAS.
- Y. Pei and D. T. Morelli, Appl. Phys. Lett., 2009, 94, 122112 CrossRef.
- E. S. Toberer, A. F. May, B. C. Melot, E. Flage-Larsen and G. J. Snyder, Dalton Trans., 2010, 39, 1046–1054 RSC.
- F. Gascoin, S. Ottensmann, D. Stark, S. M. Haïle and G. J. Snyder, Adv. Funct. Mater., 2005, 15, 1860–1864 CrossRef CAS.
- H. Wang, Z. M. Gibbs, Y. Takagiwa and G. J. Snyder, Energy Environ. Sci., 2014, 7, 804–811 CAS.
- W. Liu, X. Tan, K. Yin, H. Liu, X. Tang, J. Shi, Q. Zhang and C. Uher, Phys. Rev. Lett., 2012, 108, 166601 CrossRef PubMed.
- Y. Pei, X. Shi, A. LaLonde, H. Wang, L. Chen and G. J. Snyder, Nature, 2011, 473, 66–69 CrossRef CAS PubMed.
- H. S. Kim, N. A. Heinz, Z. M. Gibbs, Y. Tang, S. D. Kang and G. J. Snyder, Mater. Today, 2017, 20, 452–459 CrossRef CAS.
- Y. Tang, Z. M. Gibbs, L. a Agapito, G. Li, H.-S. Kim, M. B. Nardelli, S. Curtarolo and G. J. Snyder, Nat. Mater., 2015, 14, 6–12 CrossRef PubMed.
- H. Tamaki, H. K. Sato and T. Kanno, Adv. Mater., 2016, 28, 10182–10187 CrossRef CAS PubMed.
- J. Zhang, L. Song, S. H. Pedersen, H. Yin, L. T. Hung and B. B. Iversen, Nat. Commun., 2017, 8, 13901 CrossRef CAS PubMed.
- S. Ohno, K. Imasato, S. Anand, H. Tamaki, S. D. Kang, P. Gorai, H. K. Sato, E. S. Toberer, T. Kanno and G. J. Snyder, Joule DOI:10.1016/j.joule.2017.11.005.
- J. Shuai, J. Mao, S. Song, Q. Zhu, J. Sun, Y. Wang, R. He, J. Zhou, G. Chen, D. J. Singh, Z. Ren, C. W. Chu, G. Chen and Z. Ren, Energy Environ. Sci., 2017, 10, 799–807 CAS.
- V. Ponnambalam and D. T. Morelli, J. Electron. Mater., 2013, 42, 1307–1312 CrossRef CAS.
- H. X. Xin and X. Y. Qin, J. Phys. D: Appl. Phys., 2006, 39, 5331–5337 CrossRef CAS.
- S. H. Kim, C. M. Kim, Y.-K. Hong, K. I. Sim, J. H. Kim, T. Onimaru, T. Takabatake and M.-H. Jung, Mater. Res. Express, 2015, 2, 55903 CrossRef.
- C. L. Condron, S. M. Kauzlarich, F. Gascoin and G. J. Snyder, J. Solid State Chem., 2006, 179, 2252–2257 CrossRef CAS.
- R. P. Ferrier and D. J. Herrell, J. Non-Cryst. Solids, 1970, 2, 278–283 CrossRef CAS.
- Y. Imai and A. Watanabe, J. Mater. Sci., 2006, 41, 2435–2441 CrossRef CAS.
- W. G. Zeier, A. Zevalkink, Z. M. Gibbs, G. Hautier, M. G. Kanatzidis and G. J. Snyder, Angew. Chem., Int. Ed., 2016, 55, 6826–6841 CrossRef CAS PubMed.
- S. D. Kang, P. Jan-hendrik, U. Aydemir, P. Qiu, C. C. Stoumpos, R. Hanus, M. Anne, X. Shi, L. Chen, M. G. Kanatzidis and G. J. Snyder, Mater. Today Phys., 2017, 1, 7–13 CrossRef.
- S. D. Kang and G. J. Snyder, 2017, arXiv:1710.06896 [cond-mat.mtrl-sci], http://https://arxiv.org/abs/1710.06896.
- J. Bardeen and W. Shockley, Phys. Rev., 1950, 80, 72–80 CrossRef CAS.
- A. F. May and G. J. Snyder, in Materials, Preparation, and Characterization in Thermoelectrics, ed. D. M. Rowe, CRC Press, 2012, pp. 1–18 Search PubMed.
- R. P. Chasmar and R. Stratton, J. Electron. Control, 1959, 7, 52–72 CrossRef CAS.
- S. D. Kang and G. J. Snyder, Nat. Mater., 2016, 16, 252–257 CrossRef PubMed.
- S. Ohno, A. Zevalkink, Y. Takagiwa, S. K. Bux and G. J. Snyder, J. Mater. Chem. A, 2014, 2, 7478–7483 CAS.
- J. J. Kuo, S. D. Kang, K. Imasato, H. Tamaki, S. Ohno, T. Kanno and G. J. Snyder, unpublished.
- T. Kanno, H. Tamaki, S. Hiroki, S. D. Kang, S. Ohno, K. Imasato, J. J. Kuo, G. J. Snyder and Y. Miyazaki, unpublished.
- Z. M. Gibbs, H.-S. Kim, H. Wang and G. J. Snyder, Appl. Phys. Lett., 2015, 106, 22112 CrossRef.
- J. Callaway and H. von Baeyer, Phys. Rev., 1960, 120, 1149–1154 CrossRef CAS.
- P. Klemens, Phys. Rev., 1960, 119, 507–509 CrossRef CAS.
- K. Imasato, S. Ohno, S. D. Kang and G. J. Snyder, unpublished.
- A. D. LaLonde, T. Ikeda and G. J. Snyder, Rev. Sci. Instrum., 2011, 82, 25104 CrossRef PubMed.
- S. Iwanaga, E. S. Toberer, A. Lalonde and G. J. Snyder, Rev. Sci. Instrum., 2011, 82, 63905 CrossRef PubMed.
- A. Bhardwaj and D. K. Misra, RSC Adv., 2014, 4, 34552–34560 RSC.
Footnotes |
| † Electronic supplementary information (ESI) available. See DOI: 10.1039/c7mh00865a |
| ‡ Present address: Institute of Physical Chemistry, Justus-Liebig-University Giessen, Heinrich-Buff-Ring 17, D-35392 Giessen, Germany. |
| This journal is © The Royal Society of Chemistry 2018 |

