Protective effect of selenium supplementation following oxidative stress mediated by glucose on retinal pigment epithelium
Raquel
González de Vega†
 a,
Montserrat
García†
 bc,
María Luisa
Fernández-Sánchez
*a,
Héctor
González-Iglesias
 bc and
Alfredo
Sanz-Medel
 *a
*a
aDepartment of Physical and Analytical Chemistry, Faculty of Chemistry, University of Oviedo, Julian Clavería, 8., 33006 Oviedo, Spain. E-mail: marisafs@uniovi.es; asm@uniovi.es
bInstituto Oftalmológico Fernández-Vega, Oviedo, Spain
cInstituto Universitario Fernández-Vega, Fundación de Investigación Oftalmológica, Universidad de Oviedo, Spain
First published on 9th November 2017
Abstract
There are many conditions that affect the retina. However, diabetic retinopathy (RD) as a complication of Diabetes Mellitus continues to be the leading cause of blindness in working people globally. Diabetic retinopathy is an ocular complication of diabetes that is caused by the deterioration of the blood vessels that supply the retina, which has the consequence that the vision deteriorates irreversibly. The retina, and specifically the retinal pigment epithelium (RPE) is the only neural tissue that is exposed directly and frequently to light, which favors the oxidation of lipids that become extremely toxic to the cells of the retina. The RPE is a natural barrier playing an important role in the absorption of light and reduction of light scatter within the eye. In addition, the retina is the tissue that proportionally consumes more oxygen, which generates a high production of reactive oxygen species (ROS). The retina is particularly sensitive to hyperglycemia and oxidative stress. The eye tissues are enriched in certain antioxidants in the form of metabolic enzymes or small molecules. Since selenium is essential for regulating the activity of the enzymes involved in protection against oxidative stress, providing selenium to the ocular tissues could be useful for the treatment of different ocular pathologies. Thus, the aim of this study is to investigate the potential efficacy of selenium in human RPE against glucose-induced oxidative stress and its implications for GPx activity. Chromatographic techniques based on HPLC-ICP-MS will be applied in combination with isotope pattern deconvolution (IPD) to study the effects of selenium supplementation and hyperglycemia in an in vitro model of RPE cells.
Significance to metallomicsDiabetic retinopathy (RD) is one of the leading causes of blindness in patients with diabetes mellitus, affecting the retina and the retinal pigment epithelium (RPE), which are particularly sensitive to hyperglycemia and oxidative stress. Selenium, an essential trace element regulating the activity of the enzymes involved in the antioxidant response, protects the RPE cells from oxidative stress caused by the presence of glucose. Glucose, i.e., hyperglycemia, decreases the activity of the enzyme glutathione peroxidase, not affecting the selenium levels. However, when selenite is incorporated into the RPE cells acts as a protective agent preventing the protein from losing its activity. |
Introduction
The human eye is a highly specialized organ of photoreception through which light produces changes in specialized retinal nerve cells of the posterior pole, resulting in nerve action potentials relayed to the brain. The retina consists of two primary layers, an inner neurosensory retina and an outer simple epithelium, the retinal pigment epithelium (RPE). The RPE is a continuous monolayer of epithelial cells with physical, optical, metabolic, biochemical and transport functions, playing a pivotal role in the normal visual process.1 The eye, specifically the neurosensory retina and the RPE, is constantly subjected to oxidative stress. This stress has multiple sources, including daily exposure to sunlight and environmental factors.2Oxidative stress, on the other hand, has been implicated in the pathogenesis of eye diseases including cataract, glaucoma, age-related macular degeneration, diabetic retinopathy and retinitis pigmentosa.3 Specifically, during ageing, oxidative damage to retina and RPE cells and inflammatory-mediated processes occur, contributing to the development and progression of diabetic retinopathy (DR), an irreversible and devastating neurodegenerative ocular disease. DR is a slow progressing chronic disease, one of the major microvascular complications affecting the vision, and the leading cause of blindness in young and middle-aged individuals.4 It has been estimated that 80% of the patients with diabetes mellitus (DM) type 2 and 50% of type 1 develop DR in the following fifteen years after diagnosis.5
Retinal cells, including neurosensory retina and RPE, degenerate with the progression of the DR, producing macular edema and blood–retinal barriers disruption, allowing leakage of plasma from small blood vessels into the macula, which results in the swelling of the central retina and loss of central vision.6 RPE defines the selectivity of the outer blood–retinal barrier, and RPE cellular functions are critical for maintaining the health and integrity of photoreceptor cells. Alterations of the RPE are observed in DR, even in early disease. Given the essential functions of RPE, it is important to understand injuries to specific barrier functions of this epithelium and how these injuries might contribute to the development of DR. However, RPE layer modifications and the patho-physiological regulations during DR are not understood.7,8
The main risk factors of DR are hyperglycemia, oxidative stress, hypertension, dyslipidemia, genetics and environmental.9 The retina is particularly sensitive to hyperglycemia and oxidative stress, causing glycation of proteins followed by intermolecular rearrangement and conversion into Amadori products, which crosslinking forms the advanced glycation end products (AGEs).10 Glycemic dysfunction has been associated with increased generation of reactive oxygen and nitrogen species (ROS and RNS).11 Oxidative stress contributes to the formation of AGEs and a dual effect is known since AGEs can increase oxidative stress as well. Possible sources of oxidative stress and damage to proteins in diabetes include free radicals generated by auto-oxidation reactions of sugars and sugar adducts to proteins. The oxidative stress may be amplified by a continuing cycle of metabolic stress, tissue damage and cell death, leading to increased free radical production and compromised free radical inhibitory scavenger systems, which further exacerbates oxidative stress.12 The increased levels of ROS in patients with DR have been speculated to arise, in part, from alterations in the activity of glutathione antioxidant enzymes by the glycation of the protein in vivo.13 High glucose levels induce excessive ROS production,14 promote lipid peroxidation and inhibit cell proliferation.15,16
The inner ocular tissues, i.e., neurosensory retina and RPE, contain a wide range of antioxidant enzymes, including superoxide dismutase, catalase and glutathione peroxidase (GPx). Each of these enzymes requires metal or semi-metals for their activity and function (specifically GPx requires selenium). In patients with DR, high levels of ROS may be due to alterations in the function and activity of anti-oxidant enzymes.9 The antioxidant enzyme GPx losses its activity and antigenicity in patients with diabetes,17 while the enzymes responsible for glutathione redox cycle (GPx and glutathione reductase) and biosynthesis/degradation are compromised. However, there is no information regarding the effect of glycation on the physical and kinetic properties of the enzyme.13
In this work we aim to investigate the role of selenium in the human RPE against oxidative stress induced by glucose and their implications on the eventual activity of GPx. To this end we used an in vitro cell culture model (HRPEsv cell line), representative of the human pigment epithelium, to examine the mechanism(s) regulating selenium GPx activity and glucose effects. We applied analytical and biochemical-based techniques, including elemental mass spectrometry (i.e., ICP-MS), to study the effects of selenium supplementation and hyperglycemia on RPE cells.
Experimental
Instrumentation
Chromatography separation was carried out using a conventional HPLC system from Shimadzu LC-20 AD (Kyoto, Japan) consisting of a high pressure pump dual piston together with a six-way injection valve Model 7125 Rheodyne (Cotati, CA, USA). Size exclusion chromatography (SEC) was performed with a Superdex 75 PC 3.2/30 (Pharmacia Biotech, Uppsala, Sweden).An ICP-MS Agilent 7500ce (Agilent Technologies, Santa Clara, USA) was used as an on-line HPLC detector. The instrument consists of an ICP source with plasma-shield torch, an enclosed octapole ion guide operated in the RF mode, and a quadrupole mass analyzer with a SEM detector. A flow of 4 mL min−1 of hydrogen was used to pressurize the octapole chamber for Se determinations. The sample introduction system consisted of a Meinhard nebulizer with double-pass glass spray chamber cooled to 2 °C. The torch position and ion lens voltage settings were optimized daily for optimum sensitivity with a 10 ng g−1 Li, Co, Y, Tl and Ce multielement mixture in 1% (w/w) HNO3 solution. A solution of 1% (w/w) HNO3 was also used to check the background level caused by polyatomic argon interferences. The optimized HPLC-ICP-MS operating conditions are given in Table 1.
| Plasma conditions | |
|---|---|
| RF power/W | 1500 |
| Plasma gas flow rate/L min−1 | 15 |
| Auxiliary gas flow rate/L min−1 | 1.12 |
| Sampling depth/nm | 5.8 |
| Ion lens setting | Daily optimised |
| Reaction/collision cell parameters | |
|---|---|
| H2 gas/L min−1 | 4 |
| Octapole bias/V | −18 |
| QP bias/V | −16 |
| Data acquisition parameters | |
|---|---|
| Monitored isotopes | 74, 76, 77, 78, 79, 80, 81, 82, 83 |
| Points per peak | 1 |
| Integration time per point | 0.3 |
| Chromatographic conditions | |
|---|---|
| Column | Superdex 75 PC 3.2/30 |
| Injection volume | 20 µL |
| Flow rate | 0.06 mL min−1 |
| Mobile phase | 0.05 mol L−1 ammonium acetate pH 7 |
Materials and reagents
A standard solution of 1000 mg L−1 of Se stabilized in 2–3% (v/v) nitric acid Suprapur® was purchased from Merck (Darmstadt, Germany). Enriched 74Se (99.67 abundance of 74Se) and 77Se (94.33 abundance of 77Se) were obtained from Cambridge Isotope Laboratories as elemental Se powder and dissolved in a minimum volume of sub-boiled nitric acid and then diluted with ultrapure water, as required. The concentration of selenium in these solutions was determined by reverse isotope dilution analysis using a natural abundance certified standard (Merck, Darmstadt, Germany). Protein standard Glutathione Peroxidase from bovine erythrocytes was obtained from Sigma-Aldrich (St. Louis, MO, USA). Tris(hydroxymethyl)-aminomethane and ammonium acetate from Merck (Darmstadt, Germany) were used. Buffer solutions were prepared fresh each day, refrigerated (4 °C) until required and degassed with helium prior to use.Distilled-ionized water (18 MΩ cm) was obtained by Milli Q system (Millipore).
For activity measurements a Glutathione Peroxidase Cellular Activity Assay Kit was used (Sigma-Aldrich). The kit contains: Buffer solution 50 mM Tris HCl, pH 8.0, 0.5 mM EDTA, 5 mM NADPH, 42 mM reduced glutathione and 10 units per mL of glutathione reductase and 70% aqueous solution of tert-butyl hydroperoxide.
For glycation reaction sodium phosphate monobasic and D-glucose were purchased from Sigma Chemical Company (St. Louis, MO).
Microarray analysis of human glutathione peroxidase
A total of 12 eyes from adult normal donors (cadavers), ranging in age from 66 to 80 years old, were used in this study. Eyes were obtained through the National Disease Research Interchange, (Philadelphia, PA). The procedures conformed to the tenets of the Declaration of Helsinki. Each eye was dissected 24 h postmortem into 8 tissues: cornea, trabecular meshwork (TM), iris, lens, ciliary body (CB), retina, retinal pigment epithelium (RPE), and sclera. Total RNA was isolated from each tissue with TRIzol® Reagent (Invitrogen, Carlsbad, CA), and further purified with RNeasy Mini Kit (Qiagen, Hilden, Germany). RNA concentration was determined using a Picodrop microlitre spectrophotometer (Picodrop, Cambridge, UK). The quality of the RNA was verified with a bioanalizer, and samples with RIN (RNA Integrity Numbers) scores above 7.5 were further processed to examine the whole-genome expression profiling using the Illumina BeadChip array platform (HumanHT-12 v4.0 Expression BeadChip Kit) (Illumina, San Diego, CA). cRNA labeling and hybridization to the chip and array data analysis were carried out at the Genome Analysis Platform (CIC bioGUNE, Derio, Spain).Human RPE cell line
A human RPE cell line, HRPEsv, was established from a primary culture of RPE cells obtained from the eyes of a 42-years-old donor (cadaver). The retina was detached from the pigment epithelium and dissected from the optic nerve. The RPE was removed from the interior surface of the globe with repetitive brushing and aspiration with PBS. The cells were centrifuged at 600g for 5 minutes, suspended in 2 mL of supplemented medium [DMEM![[thin space (1/6-em)]](https://www.rsc.org/images/entities/char_2009.gif) :
:![[thin space (1/6-em)]](https://www.rsc.org/images/entities/char_2009.gif) HANK 10
HANK 10![[thin space (1/6-em)]](https://www.rsc.org/images/entities/char_2009.gif) :
:![[thin space (1/6-em)]](https://www.rsc.org/images/entities/char_2009.gif) 1 mixture (Life technologies, CA, USA), supplemented with 5 µg mL−1 insulin, 8.33 ng mL−1 cholera toxin, 245 µg mL−1 adenine, 1.3 ng mL−1 triiodothyronine, 0.4 µg mL−1 hydrocortisone, 100 U mL−1 penicillin, and 0 1 mg mL−1 streptomycin and 10% FBS (Sigma-Aldrich, MO, USA)] and seeded in a 10 cm2 tissue culture plate. Primary cultures were incubated for 25 days at 37 °C in 10% CO2, and thereafter the medium was replaced weekly and infected with wild type SV40 as previously described.18
1 mixture (Life technologies, CA, USA), supplemented with 5 µg mL−1 insulin, 8.33 ng mL−1 cholera toxin, 245 µg mL−1 adenine, 1.3 ng mL−1 triiodothyronine, 0.4 µg mL−1 hydrocortisone, 100 U mL−1 penicillin, and 0 1 mg mL−1 streptomycin and 10% FBS (Sigma-Aldrich, MO, USA)] and seeded in a 10 cm2 tissue culture plate. Primary cultures were incubated for 25 days at 37 °C in 10% CO2, and thereafter the medium was replaced weekly and infected with wild type SV40 as previously described.18
Culture conditions
Culture conditions were established using cell viability assays. The optimal seeding density was determined using the CyQUANT® Cell Proliferation Assay Kit (Invitrogen). The assay used CyQUANT GR dye, which produces a large fluorescence enhancement upon binding to cellular nucleic acids. The fluorescence emission of the dye-nucleic acid complexes correlated linearly with cell number. Fluorescence was measured at the wavelength Ex/Em of 485/535 nm using VICTORTM ×5 Multilabel Plate Reader (PerkinElmer). Cells were seeded in 96-well plates at a density of 10![[thin space (1/6-em)]](https://www.rsc.org/images/entities/char_2009.gif) 000 cells per well. After 48 h, the medium was changed to EX-CELL® Hybridoma medium (Sigma-Aldrich, USA), and after 24 h cells were treated with different concentrations of selenite (0, 0.01, 0.05, 0.07, 0.1, 0.5, 1, and 10 µM), and glucose (0, 0.01, 0.05, 0.1, 10, 50, 100, 1000, 5000, 10
000 cells per well. After 48 h, the medium was changed to EX-CELL® Hybridoma medium (Sigma-Aldrich, USA), and after 24 h cells were treated with different concentrations of selenite (0, 0.01, 0.05, 0.07, 0.1, 0.5, 1, and 10 µM), and glucose (0, 0.01, 0.05, 0.1, 10, 50, 100, 1000, 5000, 10![[thin space (1/6-em)]](https://www.rsc.org/images/entities/char_2009.gif) 000, 20
000, 20![[thin space (1/6-em)]](https://www.rsc.org/images/entities/char_2009.gif) 000, 50
000, 50![[thin space (1/6-em)]](https://www.rsc.org/images/entities/char_2009.gif) 000, 75
000, 75![[thin space (1/6-em)]](https://www.rsc.org/images/entities/char_2009.gif) 000, and 100
000, and 100![[thin space (1/6-em)]](https://www.rsc.org/images/entities/char_2009.gif) 000 µM), in triplicates. The viability of treated cells was measured at 24 h/48 h post assay using CyQUANT cell proliferation kit (Invitrogen) as per manufacturer's instructions.
000 µM), in triplicates. The viability of treated cells was measured at 24 h/48 h post assay using CyQUANT cell proliferation kit (Invitrogen) as per manufacturer's instructions.
Cellular treatments: supplementation with 77Se and glucose
HRPEsv cells were treated independently with either: (i) selenite (77Se, 100 nM) for 24 h or 48 h; (ii) glucose (5 mM or 20 mM) for 24 h or 48 h; (iii) first pre-treated for 24 h with selenite solution (77Se, 100 nM) and after that the culture medium was replaced with medium supplemented with glucose (5 mM or 20 mM) for 24 h or 48 h; (iv) pre-treated for 24 h with selenite (77Se, 100 nM) followed by supplementation with glucose (5 mM or 20 mM) for 24 h (as above), thereafter the medium was removed and the cells were treated with medium supplemented with selenite (77Se, 100 nM) for 24 h; and (v) in the absence of supplements (i.e., control). Each experiment was carried out in triplicate to study the effect of high-glucose concentrations (HG) on the protein oxidation in cultured HRPEsv cells as well as the antioxidant effect of the enriched selenite (77Se), acting as protector against the oxidative stress caused by the presence of glucose.Cell lysis and protein extraction
For the quantification and/or activity analysis it is necessary a previous step consisting on lysis of HRPEsv cells for water-soluble protein extraction by breaking down the membrane of the cell. To this end, cells were collected in PBS buffer, the solution was centrifuged at 200g for 4 min, the supernatant was removed, and the cells were washed and suspended in 1.5 mL of 10 mM Tris–HCl (pH = 7.4) buffer to extract the cytosolic proteins. The solution was ultra-sonicated in three series of 10 kHz for 30 s on ice bath. After a centrifugation of 15![[thin space (1/6-em)]](https://www.rsc.org/images/entities/char_2009.gif) 000g at 4 °C for 10 min, supernatant was collected and stored at −80 °C for further quantification of Se and GPx activity analysis.
000g at 4 °C for 10 min, supernatant was collected and stored at −80 °C for further quantification of Se and GPx activity analysis.
Immunohistochemistry: localization of GPx in RPE cells
Eight isoforms of GPx are expressed in humans (GPx isoforms 1 to 8). The isoform with the higher levels of RNA expression in human RPE cells is the GPx3. We visualized the cellular distribution of GPx3 in the HRPEsv cells under control conditions, after selenite (100 nM 77Se), glucose (20 mM, 24 h), and the pre-treated with selenite (100 nM 77Se) and subsequent treatment with glucose (20 mM, 24 h). HRPEsv cells cultured on coverslips (Menzel-Gläser; Braunschweig, Germany) covered with poly-D-lysine (Sigma Aldrich, USA) were fixed with cold methanol (Merck Darmstadt, Germany) followed by washing 3 times in PBS for 5 min and permeation with 0.05% Tween 20 in PBS for 10 min. To block non-specific sites we used a solution containing 10% goat serum in PBS. The cells were incubated overnight at 4 °C with a rabbit polyclonal antibody to GPx3 (1![[thin space (1/6-em)]](https://www.rsc.org/images/entities/char_2009.gif) :
:![[thin space (1/6-em)]](https://www.rsc.org/images/entities/char_2009.gif) 200 dilution, PA5-22969, Thermo Fisher) rinsed in PBS (3 times for 5 min), and further incubated at room temperature for 1 hour with Alexa 488 anti-mouse (Invitrogen; 1
200 dilution, PA5-22969, Thermo Fisher) rinsed in PBS (3 times for 5 min), and further incubated at room temperature for 1 hour with Alexa 488 anti-mouse (Invitrogen; 1![[thin space (1/6-em)]](https://www.rsc.org/images/entities/char_2009.gif) :
:![[thin space (1/6-em)]](https://www.rsc.org/images/entities/char_2009.gif) 500) followed by washing 3 times in PBS for 5 min. Nuclei were counterstained using 2 µg mL−1 4′6-diamidino-2-phenylindole (DAPI; Invitrogen). After washing in PBS and mounting in a solution of glycerol mounting medium (Dako, Agilent Technologies), the cellular distribution was examined by indirect immunofluorescence using a Leica DM6000 microscope equipped with epifluorescence, a DFC310 Fx Leica camera and the AF6000 advanced fluorescent software (Leica Microsystems CMS GMBH, Germany).
500) followed by washing 3 times in PBS for 5 min. Nuclei were counterstained using 2 µg mL−1 4′6-diamidino-2-phenylindole (DAPI; Invitrogen). After washing in PBS and mounting in a solution of glycerol mounting medium (Dako, Agilent Technologies), the cellular distribution was examined by indirect immunofluorescence using a Leica DM6000 microscope equipped with epifluorescence, a DFC310 Fx Leica camera and the AF6000 advanced fluorescent software (Leica Microsystems CMS GMBH, Germany).
Absolute quantification of Se species
Quantitative selenium speciation, i.e., analysis determination of seleno-species, in the HRPEsv cells was carried out by SEC-ICP-MS following the procedures previously reported by our group.19Quantification of selenium in HRPEsv cell samples was carried out by selenium isotope pattern deconvolution (IPD) analysis.20 The procedure used here has been previously applied in our group to study the endogenous and exogenous selenium in rat urine.21 Determination of natural and exogenous Se in RPE cell line was performed using the proposed IPD-ICP-MS analytical methodology to study natural and/or supplemented selenium distribution in the water-soluble protein fraction of cells. In the application proposed here, selenium of natural isotope abundance is doped, in the cell media, with the same element isotopically enriched in 77Se. Thus, in the samples we will have two different isotope signatures: natural abundance selenium and 77Se-enriched selenium.
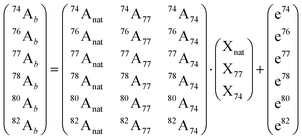
Briefly, the analyzed final samples containing Se of natural abundance (natSe, endogenous) and the metabolic tracer (77Se, exogenous) are spiked with a second enriched selenium isotope for quantification (74Se, quantitative tracer). Then, the selenium abundances are measured in the mixture (xxAb) and they can be related to the isotopic composition of the natural selenium (xxAnat) as well as, the two used enriched tracer (xxA77 and xxA74) using the following matrix equation:
This validated procedure can be applied for quantitative speciation of endogenous and exogenous selenium by post-column isotope dilution analysis (using 74Se as quantitative tracer). As the mass flow of 74Se is known, the mass flows chromatograms for natural abundance selenium species and 77Se can be calculated by applying the IPD procedure to every point of the chromatogram.
Activity measurements
In this work, GPx activity was assayed by slightly modifying the classical method of Paglia and Valentine.23 Briefly, reduced glutathione (GSH) is oxidized to glutathione (GSSG) by an organic peroxide (tert-butyl hydroperoxide, t-Bu-OOH) and GPx as catalyzer. The oxidized glutathione produced is recycled to its reduced state by β-Nicotinamide Adenine Dinucleotide Phosphate Reduced (NADPH) in the presence of glutathione reductase (GR), according to:The oxidation of NADPH to NADP+ is accompanied by a decrease in absorbance at 340 nm (the analytical signal). The decrease rate in the absorbance is directly proportional to the GPx activity in the sample because active GPx concentration is the rate-limiting factor of the coupled reactions.24
The biochemical reaction was performed at 25 °C and pH 8.0 and started by adding tert-butyl hydroperoxide (t-Bu-OOH). This substrate is suitable for this assay since the kinetics of its spontaneous reaction with GSH is low and it is not metabolized by catalase. In this way, the slope of the A340 = f(t) allows to determine the selenium containing glutathione peroxidase activity present. Unless otherwise indicated, all samples were run in triplicate. Activity is expressed in U mL−1 (1 unit of glutathione peroxidase will cause the formation of 1.0 mmol of NADP+ from NADPH per minute at pH 8.0 and 25 °C in the coupled reaction described before).
Glycation reaction
The Maillard reaction or glycation is an intricate set of non-enzymatic reactions that occur between amino groups of proteins and the carboxyl group of reducing sugars or their metabolites.25,26 This reaction was conducted by incubating the HRPEsv cell culture with two concentrations of D-glucose (5 and 20 mM). Normal levels of glucose in blood are around 5 mM and under diabetes conditions up to 20 mM. D-Glucose was the selected glycating agent for two reasons: first, because it high abundant in food and second, because they have been shown to nonenzymatically condense with proteins in vivo altering their structure and/or function.27A typical incubation mixture contained 10 mmol L−1 sodium phosphate buffer at pH 7, and 5 or 20 mmol L−1 of D-glucose (Glu). The reaction mixtures containing the sugar were then placed in the dark for 2 days at 37 °C. An aliquot of the cell media without any sugar was incubated under the similar conditions and was used as control. Cells were collect after 24 h and 48 h and their activity were measured by the method described above.
Results and discussion
Profiling of expression of glutathione peroxidase (GPx) in human ocular tissues
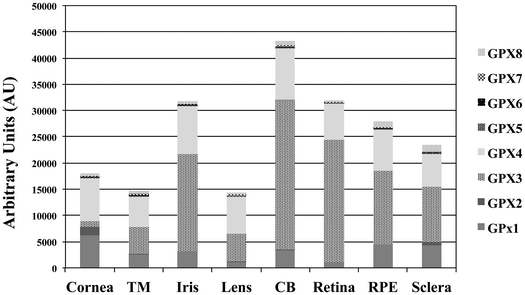
We have examined by microarray analysis the profiling of GPx isoforms determined in a total of 80 samples from dissected human eyes (11 corneas, 9 TMs, 11 irises, 10 lenses, 12 ciliary bodies [CB], 12 retinas, 8 RPEs and 7 scleras). Raw data from each of the microarrays was normalized and the background subtracted. The quantile value for each of the GPx isoforms in every ocular tissue assayed was determined and the mean value is represented as a histogram (Fig. 1). This analysis revealed the detection of multiple GPx isoforms at different abundance and tissue-specificity. Overall, the highest levels of expression of GPx isoforms (GPx1–GPx8) were found in the CB, followed by the retina, iris and RPE. The GPx isoforms are ubiquitously expressed in all the ocular tissues with the exception of GPx5, GP6 and GPx7 and the GPx2 expressions are specific of cornea and sclera. The GPx3 was selected to study its cellular distribution in the in vitro model of RPE cells, considering that this isoform showed the highest levels of expression in the analyzed human RPE tissues.HRPEsv cell culture conditions
Cell viability was determined 24 h and/or 48 h following the addition of selenite and glucose at different concentrations, using CyQUANT cell proliferation kit (see Experimental section). Raw data were converted to reflect cell viability after treatment relative to untreated controls and presented as a percentage. Fig. 2 shows the survival rate of HRPEsv cells for selenite (panel A and B, 24 and 48 h, respectively) and glucose (panels C and D, 24 and 48 h, respectively) and the combination of selenite and glucose. According to Fig. 2 (panels A and B), tested selenite concentrations did not affect the viability of cells, with a survival rate above 80%. The optimal selenite concentration was established in 100 nM. Moreover, the different concentrations of glucose assayed at 24 h and 48 h, did not alter the cellular viability, with a survival rate again above 80% (Fig. 2, panels C and D). The optimal glucose concentrations were established in 5 mM and 20 mM, mimicking normal and hyperglycemic conditions, respectively. The established concentrations of selenite and glucose were used in the subsequent experiments.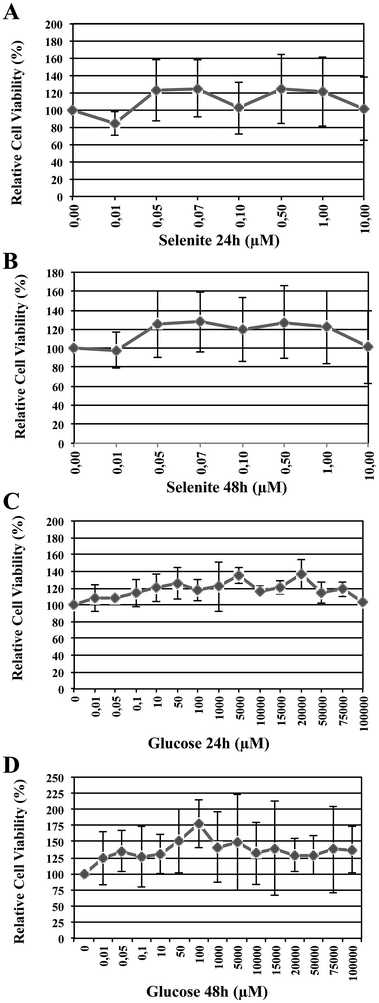 | ||
| Fig. 2 Percentage of relative cell viability depending upon selenite (panels A and B, 24 h and 48 h, respectively) and glucose (panels C and D, 24 and 48 h, respectively) concentrations. | ||
Cellular distribution of GPx in HRPEsv cells
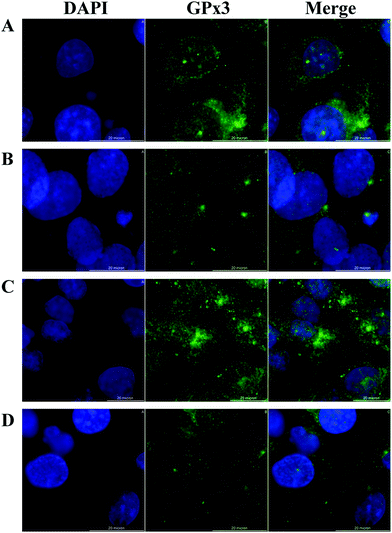
HRPEsv cells exhibited many of the genotypic properties of RPE cells in vivo, including the expression of GPx isoforms (1 to 8). We examined the cellular distribution of GPx3 (expressed at higher levels compared to the others isoforms) in HRPEsv cells by indirect immunofluorescence using GPx3 antibody upon the following treatments: (i) control; (ii) selenite (100 nM; 24 h); (iii) glucose (20 mM; 24 h); (iv) pre-treatment with selenite (100 nM) + glucose (20 mM; 24 h). Fig. 3 (panels A–D) shows the staining of GPx3, detected in the cytoplasm of HRPEsv cells, with no significant differences between the treatments assayed. GPx3 is the predominant GPx in the plasma28 but its cytosolic localization has been previously reported,29,30 which is in agreement with our results. Although Yokoyama et al.31 have reported an increase in the levels of glutathione peroxidase activity in cells after treatment with glucose (33 mM) compared to control, we have not observed changes in the cellular distribution of GPx3 in response to oxidative stress (20 mM glucose), neither of selenite (100 nM), in the RPE in vitro model.Quantification of selenium and selenoproteins levels in HRPEsv cell cultures by SEC-(IPD)-ICP-MS
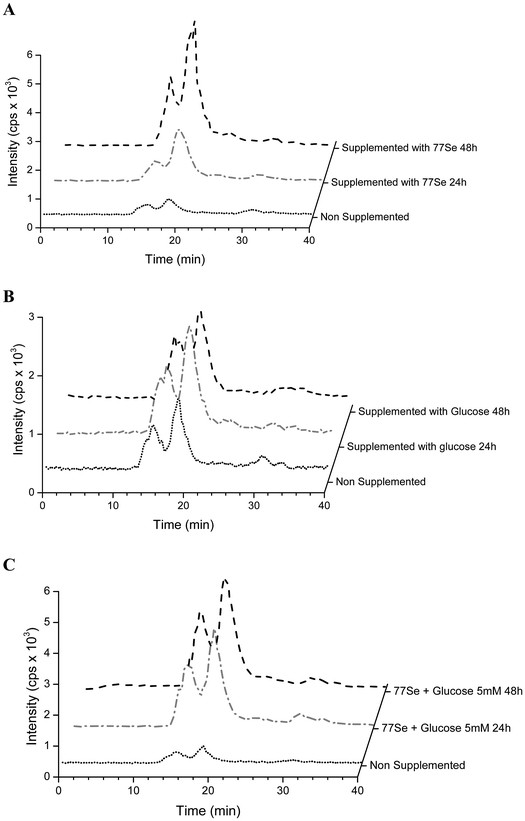
Selenium speciation of non-supplemented and supplemented cytosolic fraction of HRPEsv cells was carried out by (SEC)-ICP-MS. Fig. 4 (panel A) shows the selenium profile of the water-soluble protein fraction obtained for non-supplemented cells, for cells supplemented with selenite (100 nM) during 24 h, and for cells supplemented with selenite (100 nM) during 48 h. The chromatographic separation of proteins from the control and experimental cell lysates revealed the presence of two major selenoproteins characterized by a molecular weight of 120 kDa and 88 kDa, respectively. According to literature and previous studies from our group19 the peak of 88 kDa corresponds to the GPx enzyme. We observed an increased in the selenoprotein concentration at 24 h of treated HRPEsv cells (100 nM selenite), compared to control, and a higher increased at 48 h (100 nM selenite) compared to control and to 24 h treatment. These results indicate that the levels of selenoproteins were dependent on the availability of selenium as a function of time in the culture media. Several authors28 suggested that the presence of selenium in the culture medium yielded changes in the antioxidant system of cells, which results in an increased protein biosynthesis of selenium-dependent proteins. Simultaneously, selenium was determined in HRPEsv cells treated with 5 and 20 mM of glucose, during 24 h and 48 h (see Fig. 4, panel B). As can be seen, selenium levels remained constant in presence of glucose. Finally, panel C of Fig. 3 shows the levels of selenium-bound to proteins in the cytosolic fraction of HRPsv cells pre-treated for 24 h with selenite (77Se, 100 nM), followed by glucose supplementation for 24 and 48 h, respectively. A higher increase in the selenoprotein levels in the treated cells could be observed.Finally the total concentration of Se bound to the two protein fractions under scrutiny was quantified using isotopic pattern deconvolution analysis (IPD-ICP-MS). The obtained analytical results in the water-soluble protein fraction of HRPEsv cells are summarized in Table 2 and Fig. 5. Overall, the presence of glucose in the media does not affect the levels of total selenium, which remains virtually constant. Furthermore, as expected, when selenite is incorporated in the cell media total selenium levels of the cell lysate increased, as compared with the control ones.
| Sample | Se nat (µg g−1) | Se77 exg (µg g−1) | Se tot (µg g−1) | Se tot (µg g−1)/no cells | Activity (U ml−1) |
|---|---|---|---|---|---|
| Control | 86.66 | — | 86.66 | 2.31 × 10⁻⁵ | 0.0931 |
| Control 24 h | 94.35 | — | 94.35 | 3.41 × 10⁻⁵ | 0.0928 |
| Control 48 h | 92.04 | — | 92.04 | 3.03 × 10⁻⁵ | 0.0941 |
| Glucose 5 mM (24 h) | 88.33 | — | 88.33 | 3.36 × 10⁻⁵ | 0.0814 |
| Glucose 5 mM (48 h) | 85.77 | — | 85.77 | 2.10 × 10⁻⁵ | 0.0517 |
| Glucose 20 mM (24 h) | 84.81 | — | 84.81 | 2.63 × 10⁻⁵ | 0.0622 |
| Glucose 20 mM (48 h) | 86.23 | — | 86.23 | 2.91 × 10⁻⁵ | 0.0302 |
| Selenite77 (24 h) | 92.43 | 34.82 | 127.25 | 3.90 × 10⁻⁵ | 0.0986 |
| Selenite77 (48 h) | 87.48 | 39.65 | 127.13 | 3.12 × 10⁻⁵ | 0.1122 |
| Se77 + glucose 5 mM (24 h) | 91.97 | 36.41 | 128.38 | 5.44 × 10⁻⁵ | 0.0762 |
| Se77 + glucose 5 mM (48 h) | 90.65 | 48.63 | 139.28 | 4.13 × 10⁻⁵ | 0.1015 |
| Se77 + glucose 20 mM (24 h) | 87.87 | 32.36 | 120.23 | 3.61 × 10⁻⁵ | 0.0489 |
| Se77 + glucose 20 mM (48 h) | 83.87 | 43.33 | 127.20 | 3.73 × 10⁻⁵ | 0.0883 |
| Se77 + glucose 5 mM (remove after 24 h) | 85.22 | 47.06 | 132.28 | 4.01 × 10⁻⁵ | 0.1034 |
| Se77 + glucose 20 mM (remove after 24 h) | 83.39 | 36.17 | 119.56 | 3.19 × 10⁻⁵ | 0.0861 |
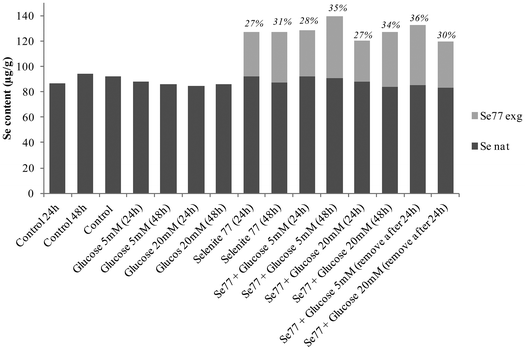 | ||
| Fig. 5 Natural selenium (filled shape) and exogenous tracer 77Se (empty shape) determined in the cytosolic fraction of HRPEsv cells upon different treatments. | ||
Determination of GPx activity
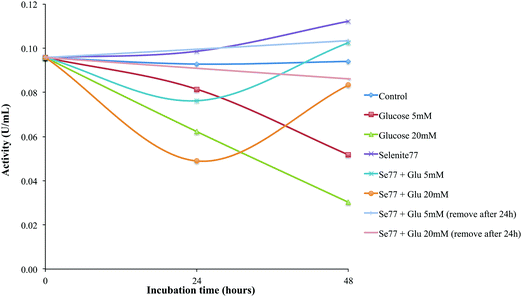
We also studied the effects of selenium supplementation, in the form of selenite, in the protection of HRPEsv cells against oxidative stress mediated by glucose, which is a well-known source of chronic oxidative stress.29 The exposure of proteins in vitro to high sugar concentration, i.e., hyperglycemia, is considered as a useful model to study the alterations occurring during glycation processes. To this end, we carried out the glycation studies of the GPx by the enzymatic method of Paglia and Valentine described above, consisting of an incubation of the HRPEsv cell line with selenite and glucose and subsequent determination of the activity of the protein GPx. To study the antioxidant effect of selenium against the presence of glucose in the media, HRPEsv cells were pre-treated 24 h with enriched selenite (77Se, 100 mM) Fig. 6 shows the shift of GPx activity during the incubation time (24 h and 48 h). As can be seen, the activity of GPx decreases with the longer incubation times in the HRPEsv cells treated with glucose, whereas GPx activity of non-sugar incubated cells (control) remained constant along the incubation period (24 h and 48 h). Conversely, when HRPEsv cells were supplemented with 77Se, the GPx activity increased slightly (since selenite incorporated to the cells would activate the GPx).Strikingly, when HRPEsv cells were pre-treated 24 h with selenite, further removed, and after which supplemented with glucose, we observed a decreased in the GPx activity at 24 h, although this effect was reversed at 48 h reaching GPx activity levels similar to control. These results may indicate that the selenite incorporated in the cell media, because its pre-treatment, acts as a protective agent and prevents chronic oxidative stress effects of glucose from degrading the activity of the GPx protein. Finally, we studied the effects of selenite supplementation following 24 h of glucose-mediated stress. To this end, pre-treated cells (24 h with 77Se) were treated with glucose, which has been removed after 24 h treatment and the media was substituted for media with selenite (77Se). Then, the activity was determined 24 h later. In this particular case, no changes in the activity of GPx were observed during the incubation time, probably because glucose was not able to degrade the activity of the GPx due to the fact that selenite could protect cells from the well known glucose-mediated stress.
Hyperglycemia have detrimental effects on RPE cells by decreasing the activity of Na/k-ATPase, compromising the supply of nutrients to the retina and the removal of metabolic waste products and affecting the RPE barrier function.8 Oxidative stress is increased in the retina in diabetes, but long-term administration of antioxidants, including selenium, inhibited the development of retinopathy in diabetic rats (through the inhibition of NF-κB activation).30 In our study, selenium supplementation in the form of selenite turned out to maintain the activity of GPx (even after chronic oxidative stress mediated by glucose), in RPE cells. This may have very important implications in the management of DR. Since GPx in such conditions remains active under hyperglycemic conditions, the levels of ROS may be stopped or reversed. Therefore, it follows that selenium supplementation may have protective effects on RPE cells from the chronic effects of glucose during DR.
Conclusions
In this work, the effects of selenium supplementation in the protection of the RPE cells from oxidative stress caused by the presence of glucose have been studied. Determination of natural and exogenous Se in RPE cell line was carried out using the proposed IPD-ICP-MS analytical methodology of great potential to investigate natural and/or supplemented selenium distribution in the cells. In view of the observed results, we can conclude that the presence of glucose in the cell media does not seem to affect the selenium levels but the selenoprotein activity. Interestingly, adding glucose in the cell lysate leads to a decrease in the GPx activity, due to the glycation of the enzyme. However, when selenite is incorporated into the HRPEsv cells, it acts as a protective agent preventing the protein from losing its activity.Conflicts of interest
There are no conflicts to declare.Acknowledgements
This work was partially supported by Projects FC-15-GRUPIN14-092 (Principado de Asturias) and MINECO-13-CTQ2013-49032-C2-1 and 2 R (Ministerio de Educación y Ciencia). The Instituto Oftalmológico Fernández-Vega acknowledges financial support from “Fundación Rafael del Pino” (http://www.frdelpino.es), from the “Instituto de Desarrollo Económico del Principado de Asturias” (IDEPA) of “Gobierno del Principado de Asturias” and European FEDER co-financing, through the project PID-1-II-16-071, and from “Fundación María Cristina Masaveu Peterson” (http://www.fundacioncristinamasaveu.com).References
- J. Forrester, A. Dick, P. McMenamin and W. Lee, WB Sauders Company Ltd., London, 1996 Search PubMed.
- Y. Chen, G. Mehta and V. Vasiliou, Ocul. Surf., 2009, 7, 176 CrossRef PubMed.
- O. A. Oduntan and K. P. Mashige, South African Optometrist, 2011, 70, 191 Search PubMed.
- A. W. Stitt, T. M. Curtis, M. Chen, R. J. Medina, G. J. McKay, A. Jenkins, T. A. Gardiner, T. J. Lyons, H. P. Hammes, R. Simó and N. Lois, Prog. Retinal Eye Res., 2016, 51, 156 CrossRef PubMed.
- R. Klein, B. E. K. Klein and S. E. Moss, Arch. Ophthalmol., 1984, 102, 527 CrossRef CAS PubMed.
- D. A. Antonetti, R. Klein and T. W. Gardner, N. Engl. J. Med., 2012, 366, 1227 CrossRef CAS PubMed.
- M. Ponnalagu, M. Subramani, C. Jayadev, R. Shetty and D. Das, Cytokine, 2017, 95, 126 CrossRef CAS PubMed.
- T. Xia and L. J. Rizzolo, Vision Res., 2017, 17, 30037 Search PubMed.
- R. A. Kowluru, A. Kowluru, M. Mishra and B. Kumar, Prog. Retinal Eye Res., 2015, 48, 40 CrossRef CAS PubMed.
- R. Singh, A. Barden, T. Mori and L. Beilin, Diabetologia, 2001, 44, 129 CrossRef CAS PubMed.
- G. B. Arden and S. Sivasprasad, Curr. Diabetes Rev., 2011, 7, 291 CrossRef CAS PubMed.
- J. W. Baynes, Diabetes, 1991, 40, 405 CrossRef CAS PubMed.
- S. Suravajjala, M. Cohenford, L. R. Frost, P. K. Pampati and J. A. Dain, Clin. Chim. Acta, 2013, 5, 170 CrossRef PubMed.
- X. Wang, Z. Wang, J. Z. Liu, J. X. Hu, H. L. Chen, W. L. Li and C. X. Hai, Toxicol. in Vitro, 2011, 25, 839 CrossRef CAS PubMed.
- S. J. Heo, J. Y. Hwang, J. I. Choi, S. H. Lee, P. J. Park, D. H. Kang, C. Oh, D. W. Kim, J. S. Han, Y. J. Jeon, H. J. Kim and I. W. Choi, Food Chem. Toxicol., 2010, 48, 1448 CrossRef CAS PubMed.
- A. K. Jain, G. Lim, M. Langford and S. K. Jain, Free Radical Biol. Med., 2002, 33, 1615 CrossRef CAS PubMed.
- M. E. Rahbani-Nobar, A. Rahimi-Pour, M. Rahbani-Nobar, F. Adi-Beig and S. M. Mirhashemi, Med. J. Islamic World Acad. Sci., 1999, 12, 109 Search PubMed.
- K. K. Jha, S. Banga, V. Palejwala and H. L. Ozer, Exp. Cell Res., 1998, 245, 1 CrossRef CAS PubMed.
- R. González de Vega, M. L. Fernández-Sánchez, H. González Iglesias, M. Coca-Prados and A. Sanz-Medel, Anal. Bioanal. Chem., 2015, 407, 2405 CrossRef PubMed.
- J. A. Rodríguez-Castrillón, M. Moldovan, J. Ruiz Encinara and J. I. García Alonso, J. Anal. At. Spectrom., 2008, 23, 318 RSC.
- H. González Iglesias, M. L. Fernández Sánchez, J. A. Rodríguez-Castrillón, J. I. García Alonso, J. López Sastre and A. Sanz-Medel, J. Anal. At. Spectrom., 2009, 24, 460 RSC.
- H. González Iglesias, M. L. Fernández Sánchez, J. I. García Alonso, J. López Sastre and A. Sanz-Medel, Anal. Bioanal. Chem., 2007, 389, 707 CrossRef PubMed.
- D. E. Paglia and W. Valentine, J. Lab. Clin. Med., 1967, 70, 158 CAS.
- B. Mannervik, Methods Enzymol., 1985, 113, 490 CAS.
- Q. Zhang, J. M. Ames, R. D. Smith, J. W. Baynes and T. O. Metz, J. Proteome Res., 2009, 8, 754 CrossRef CAS PubMed.
- I. Bousova, D. Vukasovic, V. Palicka and J. Drsata, Acta Pharm., 2005, 55, 107 CAS.
- V. Duttan, M. A. Cohenford and J. A. Dain, Anal. Biochem., 2005, 345, 171 CrossRef PubMed.
- M. P. Bansal and T. Kaur, J. Med. Food, 2002, 5, 85 CrossRef CAS PubMed.
- R. P. Robertson, J. Harmon, P. O. Tran and V. Poitout, Diabetes, 2004, 53, 119 CrossRef.
- R. A. Kowluru, P. Koppolu, S. Chakrabarti and S. Chen, Free Radical Res., 2003, 37, 1169 CrossRef CAS PubMed.
- T. Yokoyama, K. Yamane, A. Minamoto, H. Tsukamoto, H. Yamashita, S. Izumi, G. Hoppe, J. E. Sears and H. K. Mishima, Exp. Eye Res., 2006, 83, 602 CrossRef CAS PubMed.
Footnote |
| † These authors contributed equally to this work. |
| This journal is © The Royal Society of Chemistry 2018 |

