A supramolecular peptide polymer from hydrogen-bond and coordination-driven self-assembly†
Xiaomin
Zhu
a,
Rongfeng
Zou
b,
Peng
Sun
 c,
Qi
Wang
*d and
Junchen
Wu
*a
aKey Laboratory for Advanced Materials & Institute of Fine Chemicals, School of Chemistry and Molecular Engineering, East China University of Science and Technology, Shanghai 200237, China. E-mail: jcwu@ecust.edu.cn; Fax: (+86)-21-6425-3674; Tel: (+86)-21-6425-3674
bDivision of Theoretical Chemistry and Biology, School of Biotechnology, Royal Institute of Technology (KTH), AlbaNova University Center, 106 91 Stockholm, Sweden. E-mail: rongfeng@kth.se
cState Key Laboratory of Magnetic Resonance and Atomic and Molecular Physics, Wuhan Institute of Physics and Mathematics, Chinese Academy of Sciences, Wuhan, 430071, China. E-mail: sunpeng@wipm.ac.cn
dCollege of Public Health, Nantong University, 9 Seyuan Road, Nantong, 226019, China. E-mail: yqi.wang@gmail.com
First published on 5th December 2017
Abstract
A terpyridine- and guanine-functionalized peptide was developed that could form different morphologies by self-assembly or coordination with Fe2+ in dimethyl sulfoxide. The self-assembly of the peptide is attributed to the G-quartet formation of a guanine moiety and intermolecular terpyridine π–π stacking. Upon the addition of Fe2+, a Fe2+–(terpyridine)2 complex is formed that turns the square-planar self-assembly to a three-dimensional self-assembly. As a consequence, a variety of interesting morphologies and chemical properties were observed. The self-assembled polymers were studied by nuclear magnetic resonance spectroscopy, ultraviolet-visible and fluorescence spectroscopy, viscosity measurement, circular dichroism, Fourier transform infrared spectroscopy, X-ray diffraction, scanning electron microscopy, transmission electron microscopy, dynamic light scattering, and atomic force microscopy. This external stimuli driven self-assembly of a peptide may be further applied to drug delivery applications.
Introduction
Supramolecular self-assembly has attracted increasing interest in recent decades.1 A significant challenge in molecular self-assembly is the design of molecular building blocks that can undergo spontaneous organization into well-defined and stable macroscopic structures.2 Supramolecular self-assembly through noncovalent interactions, including hydrogen bonding,3,4 π–π stacking,5 hydrophilic and hydrophobic interactions,6 electrostatic interactions,7 and van der Waals forces,8 has potential applications in biology or nanotechnology. The self assembly induced by external stimuli, such as changes in pH,9 metal-ion concentrations,10 light,11 chemical agents12 and host–guest interactions,13 has become a major research field. These assemblies have many unique properties compared to traditional polymers. Thus, they can be applied in novel scaffolds,14,15 drug-delivery systems,16 molecular sensing17 and so on.In order to build an ideal self-assembly system, hydrogen-bond interactions and metal–ligand coordination are the most commonly used routes.18 In biology, G-quartets, which are formed by the hydrogen-bond interactions of four guanosine (G) residues, play an important role in biological activity, especially in nucleic acid telomeres.19,20 The construction of guanine containing peptides is crucial for research into the influence of G-quartets on biological activity. Metal–ligand coordination, such as chelate complexes derived from N-heteroaromatic ligands, has been extensively used in molecular self-assembly. Terpyridine (tpy) has been incorporated into supramolecular building blocks for a variety of applications, such as hydrogels,21,22 collagen23 and so on. Peptide self-assembly is one of the most crucial approaches for fabricating supramolecular biosubstances.24 Peptide polymers have excellent biocompatibility and biodegradable abilities, resulting in their wide usage as biomaterials to overcome the limitations of traditional synthetic materials.25
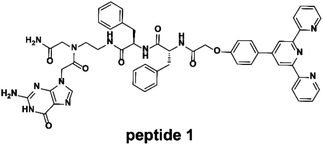
It is a significant challenge to find a simple and effective monomer that can be used to develop a stable supramolecular polymer. Although hydrogen bonding and π–π stacking interactions are good candidates for the formation of polymers, pure H bonding or π–π stacking interactions are easily influenced by the microenvironment, such as the organic solvent26 and temperature.27 On this basis, the Schmuck group added terpyridine to a guanidiniocarbonyl pyrrole carboxylate zwitterion to stabilize its self-assembly using metal–ligand interactions and H bonds.28 On the basis of this research, we report a tpy- and guanine-functionalized peptide 1. Peptide 1 exhibits different morphologies with or without metal ions. Tpy was introduced into peptide 1 as a well-established ligand for coordination with metal ions.29 The functional guanine moiety was designed to form stable G-quartets for self-assembly.30 Inspired by the research of Xu et al.,31,32 we introduced two phenylalanine (Phe) groups into our molecule to increase the aromatic–aromatic interactions,33–36 and together with the chelation of terpyridine with Fe2+ and the stable G-quartet formation of guanine, peptide 1 could be used to obtain a more stable self-assembled structure in diethyl sulfoxide (DMSO). In addition, after the addition of Fe2+, the self-assembly was altered to a three-dimensional spatial approach. This stimuli-responsive polymer may have potential applications in drug-delivery systems or nanosensors.
Experimental
Materials
All solvents were dried and distilled before use. Anhydrous dichloromethane (DCM) and dimethylformamide (DMF) were distilled over CaCl2 and CaH2, respectively. N,N′-Diisopropylethylamine (DIEA) and N-hydroxybenzotriazole (HOBt) were purchased from Suzhou Highfine Biotech Co., Ltd (Jiangsu, China); Fmoc-protected Phe and Fmoc-Aeg-G(Bhoc)-OH were purchased from GL Biochem (Shanghai, China) Ltd. The nuclear magnetic resonance (NMR) spectra were recorded at room temperature with a Brüker AV-800 spectrometer. The 1H NMR spectra and 2D H–H COSY and NOESY NMR spectra were recorded at 800 MHz. The mass spectra were collected on an AB Sciex mass spectrometer. Analytical high-performance liquid chromatography (HPLC) was performed with a C18 column with a 250 mm length and 4.6 mm diameter.Synthesis of peptide 1
Peptide 1 was synthesized as follows: rink amide resin (0.64 mmol g−1, 0.25 mmol, 1 eq.) was added to a peptide synthesis vessel and stirred in DMF (8 mL) for 3 h. Then, piperidine (20% in DMF) was added to the vessel to remove the Fmoc protecting group. After washing with DMF three times, a mixture of activated Fmoc-Aeg-G(Bhoc)-OH (Fmoc-Aeg-G(Bhoc)-OH, 0.75 mmol, 3 eq.; HOBt, 0.75 mmol, 3 eq.; DIEA, 2.5 mmol, 6 eq.) was added to the vessel and shaken for 3 h. This circulation was repeated three times. After another deprotection step and washing, two Fmoc-protected Phe groups were attached to a G-based resin using the same method. Finally, tpy (0.75 mmol, 3 eq.), HOBt (0.75 mmol, 3 eq.) and DIEA (2.5 mmol, 10 eq.) were added to the vessel and shaken for 3 h. The reaction was repeated two times. The cleavage of the product from the resin was achieved by treatment with a mixture of trifluoroacetic acid (TFA)/H2O/triisopropylsilane (95![[thin space (1/6-em)]](https://www.rsc.org/images/entities/char_2009.gif) :
:![[thin space (1/6-em)]](https://www.rsc.org/images/entities/char_2009.gif) 2.5
2.5![[thin space (1/6-em)]](https://www.rsc.org/images/entities/char_2009.gif) :
:![[thin space (1/6-em)]](https://www.rsc.org/images/entities/char_2009.gif) 2.5) for 3 h. The cleavage mixture was collected by filtration and the resin was washed twice with TFA (10 mL). The filtrates were combined and concentrated under vacuum. Then, 20 mL of diethyl ether was added to the peptide. After centrifugation, peptide 1 was purified with HPLC.
2.5) for 3 h. The cleavage mixture was collected by filtration and the resin was washed twice with TFA (10 mL). The filtrates were combined and concentrated under vacuum. Then, 20 mL of diethyl ether was added to the peptide. After centrifugation, peptide 1 was purified with HPLC.
Ultraviolet–visible and fluorescence spectroscopy
All absorption and fluorescence spectra were recorded using an ultraviolet–visible (UV–vis) spectrometer and a VARIAN fluorescence spectrometer at 25 °C, respectively. The samples were excited at λ = 310 nm. The slit widths were set to 5 nm for excitation and emission. The data points were collected at 1 nm increments with a 0.1 s integration period. All spectra were corrected for intensity using the manufacturer-supplied correction factors, and corrected for absorption and background fluorescence by subtracting a blank scan of the DMSO buffer.Viscosity studies
Viscosity measurements were performed at 25 °C in DMSO using a Rotational Rheometer (MARS3, USA). Aliquots of iron(II) chloride (10.0 mM stock solution in DMSO) were added to a solution of peptide 1 with different concentrations in DMSO for 20 min.Circular dichroism spectroscopy
Circular dichroism (CD) spectra were obtained on a JASCO J-815 CD spectropolarimeter (Jasco Inc., Easton, MD, USA). Peptide 1 and the peptide 1–Fe2+ complex were prepared in DMSO (100 μM, 800 μL). The spectra were acquired at 25 °C, averaging three scans between 240 and 370 nm with a 2 nm bandwidth. The scan rate was 100 nm min−1 with a 2 s response time.Infrared spectroscopy
Fourier transform infrared (FTIR) spectra were recorded using an IRPRESTIGE-21 spectrometer (Shimadzu). The samples were ground with KBr before analysis.X-ray diffraction
The X-ray diffraction (XRD) patterns of the samples were obtained using an X-ray diffractometer (Rigaku Ultima IV) operating in reflection mode with CuKa radiation at a scan rate of 0.02 to 2 s−1. The samples were prepared in DMSO (100 mM) and allowed to freeze dry in a freeze dryer (Labconco, USA) before analysis.Scanning electron microscopy
Scanning electron microscopy (SEM) images were acquired with a FEI Nova nanoSEM-600 equipped with a field-emission gun operating at 10 kV. For recording the images, one drop of peptide 1 (100 μM, DMSO) and one drop of the peptide 1–Fe2+ complex (100 μM, DMSO) were transferred onto freshly cleaved micas (50 × 50 mm), and allowed to dry at room temperature for 24 h before the analysis.Transmission electron microscopy
The high-resolution transmission electron microscopy (TEM) images of peptide 1 and the peptide 1–Fe2+ complex were acquired. The samples of peptide 1 and the peptide 1–Fe2+ complex were prepared by placing a few droplets onto a holey carbon-coated grid stained with sodium phosphotungstate (2 wt% aqueous solution) and dried at room temperature for 12 h. The TEM characterization was performed using a JEM-2100 electron microscope (JEOL, Japan).Dynamic light scattering (DLS)
The size distributions of peptide 1 and the peptide 1–Fe2+ complex were determined by using a Nano-ZS (Zetasizer, Malvern) instrument. The samples of peptide 1 and the peptide 1–Fe2+ complex with a concentration of 100 μM were prepared with a total sample volume of 1.0 mL (DMSO, 25 °C), respectively. The peptide 1–Fe2+ complex was measured after the addition of aliquots of iron(II) chloride (20.0 mM stock solution) into a solution of peptide 1 (100 μM) in DMSO.Atomic force microscopy
The nanomorphologies of peptide 1 and the peptide 1–Fe2+ complex were obtained in tapping mode using a NanoDrive controller with an Innova scanning probe microscope (Veeco, Mannheim, Germany) and an N-type silicon cantilever (AC 160TS Olympus, Tokyo, Japan). The scan rate was ∼5 μm s−1. The samples were prepared by spin coating (62 rps) the solutions onto a freshly cleaved mica surface (50 × 50 mm) for 2 min, before allowing them to dry at room temperature for 12 h. The atomic force microscopy (AFM) data were analysed using Gwiddion-2.20 software.Results and discussion
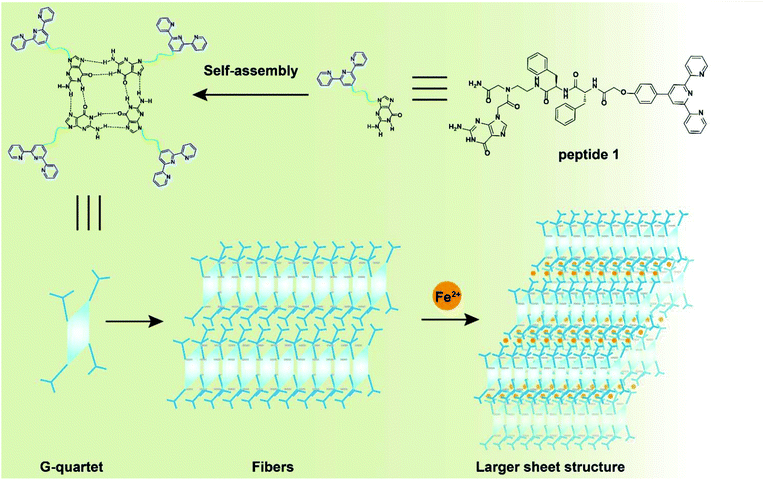
Peptide 1 (Fig. 1) was synthesized using a standard solid-phase peptide method.37 After cleavage from the resin, peptide 1 was purified and dried in a freeze dryer. The overall yield of the product was ∼11.3%. After purification with HPLC, peptide 1 was confirmed with MALDI-TOF mass spectrometry (Fig. S1†) and NMR spectroscopy (Fig. 2 and S2†). The signal at m/z = 968.3 corresponds to peptide 1. With the assistance of 1H NMR, 2D COSY, 2D TOCSY and 2D NOESY NMR experiments, which were recorded at room temperature with a Bruker Avance 800 NMR spectrometer at 800 MHz, we assigned all the proton resonances of peptide 1 (Fig. 2). 1H NMR (800 MHz, DMSO-d6) δ = 11.64 (bs, 1H), 9.66 (bs, 1H), 9.02 (d, J = 7.18 Hz, 2H), 8.94 (s, 1H), 8.94 (d, J = 3.89 Hz, 2H), 8.88 (d, J = 3.68 Hz, 2H), 8.51 (d, J = 8.01 Hz, 1H), 8.42 (m, 2H), 8.41 (m, 1H), 8.24 (dd, 1H), 8.0 (m, 2H), 7.85 (m, 2H), 7.28–7.15 (m, 11H), 7.06 (m, 2H), 4.62 (m, 2H), 4.57 (s, 2H), 4.56 (s, 4H), 4.52 (m, 1H), 4.43 (m, 1H), 3.05–2.83 (m, 6H). The characteristic correlation peaks between amino protons W1, W2 and W3 and alkyl protons X1, X2 and X3 in the COSY and TOCSY spectra indicated that the interlinkage of peptide 1 was correct.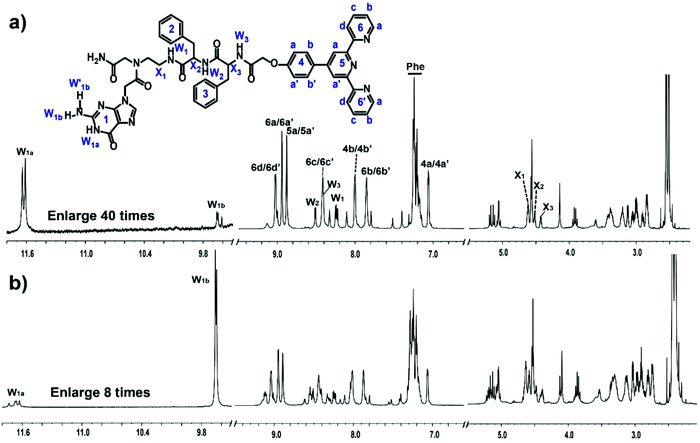 | ||
| Fig. 2 1H NMR spectra of (a) peptide 1 and (b) the peptide 1–Fe2+ complex with a concentration of 10 mM in DMSO-d6. | ||
We deduced that the G-quartets containing self-assembly of peptide 1 formed in DMSO solution according to the results of NMR experiments. The 1H NMR spectral region between δ = 4 and 13 ppm is useful for characterizing G-quartets. In G-quartets, the 1H NMR signal of the imino proton (W1a) is usually downfield to 11–13 ppm due to the formation of H-bonds, and one of the two imino protons of NH2 (W1b) participates in the formation of H-bonds, whose signal usually appears at 9–10 ppm, whereas the other one (W′1b) is in free form with a chemical shift of 6–7 ppm. The splitting of the signal at 11.63 ppm (W1a) and at 9.65 ppm (W1b) in Fig. 2a is indicative of the G-quartet formation,30,38,39 with the signal of the free proton W′1b at 7.21 ppm. Thus, the position and lineshape of the signals of these imino protons suggested G-quartets containing self-assembly of peptide 1. The phase of correlation peaks in the NOESY spectrum also implied some large construction formed. As for small molecules (molecular weight less than 1 kDa), the correlation peaks in the NOESY spectrum are usually negative signals with respect to the diagonal peaks. But the correlation peaks in the NOESY spectrum of peptide 1 are all with positive signals, which were the same as the diagonal peaks of aggregates (Fig. S2†).
After the addition of Fe2+, the 1D and 2D NMR spectra changed significantly. Most of the signals moved about 10 Hz downfield and nearly all resonances assigned in Fig. 2b turned into two sets of peaks, which indicated that further stacking events happened and there were two kinds of peptide 1 coexisting in solution with Fe2+. For imino protons, the intensity of the downfield signal of W1b increased by dozens of times, which suggested that the W1b involved H-bond became much stronger than that in solution without Fe2+. In addition, there were strong correlation peaks between the new coming resonances from the aromatic protons of terpyridine and proton W1b in the NOESY spectrum (Fig. S2†). These results suggested larger and more stable aggregates in solution upon the addition of Fe2+.40
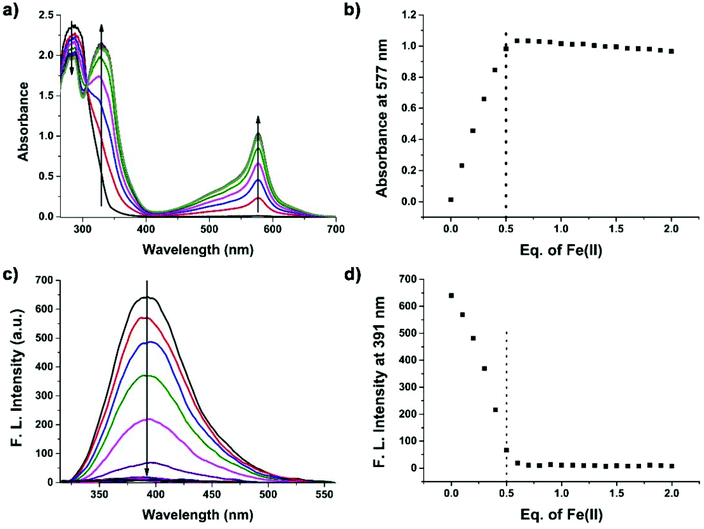
To confirm the formation of supramolecular networks, the reduced viscosity of peptide 1 and its Tpy–Fe2+ complexes were determined. As shown in Fig. 3, compared with peptide 1, the reduced viscosity of the peptide 1–Fe2+ complex went up exponentially with the increasing polymer concentrations, indicating the formation of supramolecular networks.41 The self-assembly process was also monitored with UV-vis spectroscopy and fluorescence titration. Upon the addition of Fe2+, the colour of peptide 1 (100 μM) in DMSO immediately turned to dark blue. The UV absorption spectra showed that the peptide 1–Fe2+ complex exhibited a typical metal-to-ligand charge transfer absorption at 577 nm and a ligand-centred absorption at 320 nm (Fig. 4a and b).42 The isosbestic point at 307 nm indicated that both peptide 1 and the complex existed in the solution. Interestingly, by adding excessive Fe2+, the fluorescence titration spectrum shows a decrease at 391 nm (Fig. 4c and d). This indicated that excessive Fe2+ could effectively quench the fluorescence.
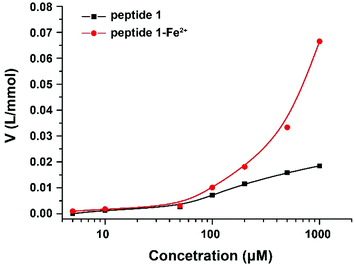 | ||
| Fig. 3 Reduced viscosity of peptide 1 and the peptide 1–Fe2+ complex with increasing concentrations in DMSO. | ||
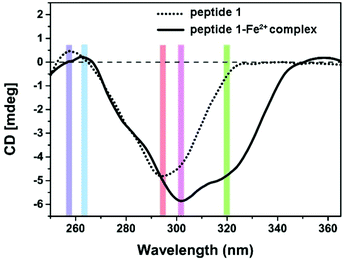
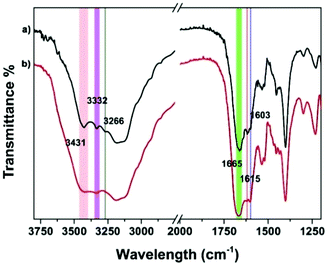
Supramolecular self-assembly could subsequently change the circular dichroism (CD) properties of the aggregates. The mechanism of polymer formation was further investigated by using CD spectra. In DMSO, G-quartet containing assemblies (100 μM) showed a double-signed CD signal in the range of 230–330 nm (Fig. 5). The two opposite signals at 260 nm and 293 nm corresponded to the π–π* transitions and the heteropolar stacking of the guanosine chromophore.43 The broad opposite band at 293 nm suggested that an H-bonding induced G-quartet conformation with heteropolar stacking and D4 symmetry existed in solution. After metal complexation, the signals of CD spectra showed a significant shift. By the addition of 0.5 equiv. of Fe2+ to a solution of peptide 1, the broad negative band shifted from 293 nm to 302 nm which was attributed to the stacked monomers or tetramers,44 whereas the positive band at 250 nm disappeared. Notably, a new band appeared at around 320 nm, which may be attributed to the self-assembly of Tpy–Fe2+ complexes.45 Metal-typ coordination was further verified by Fourier transform infrared spectroscopy (FTIR). As shown in Fig. 6, peptide 1 and its complex have similar peaks. However, the complex showed broad peaks at 3431 cm−1, 3332 cm−1 and 3266 cm−1 which indicated that the N–H vibration in tpy has affected by coordinating with the iron ion.46
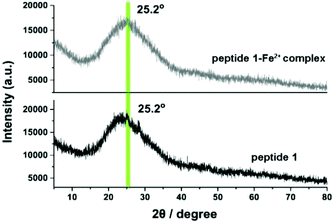
To obtain further information on the internal structure of the aggregated polymers, X-ray powder (XRD) diffraction was performed. The samples for XRD were prepared in DMSO with a concentration of 10 mM. In the XRD measurement, both peptide 1 and the metal–ligand complex showed a broad band at 2θ = 25.2° (Fig. 7). By using the Bragg equation:
| 2d sin θ = λ |
The formation of chain to nano-sheet polymers was also confirmed by scanning electron microscopy (SEM) and transmission electron microscopy (TEM). The SEM images obtained at a concentration of 100 μM showed a solid chain-like structure with a diameter of ca. 40 nm and a length of more than 500 nm (Fig. 8a). A similar structure was also observed on holey carbon film coated copper grid surfaces in the TEM images (Fig. 8b). Dynamic light scattering (DLS) showed that the hydrodynamic radius for the self-assemblies formed by peptide 1 in DMSO was ranging from 500 to 650 nm (Fig. 8c). After the addition of Fe2+, the solid chain-like structure further aggregated into larger sheets (Fig. 8d and e). DLS data displayed that diameters of the self-assemblies of the peptide 1–Fe2+ complex were ranging from 450 to 600 nm in DMSO (Fig. 8f), which is consistent with the findings from electron microscopies.
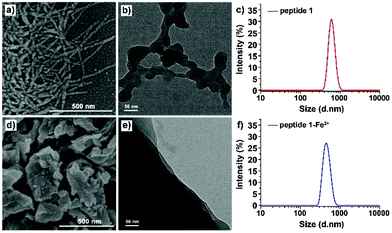 | ||
| Fig. 8 SEM images of (a) peptide 1 and (d) the peptide 1–Fe2+ complex. TEM images of (b) peptide 1 and (e) the peptide 1–Fe2+ complex. DLS data of (c) peptide 1 and (f) the peptide 1–Fe2+ complex. | ||
A closer look at the morphology of two assemblies allowed for gaining further insight into the mechanism of polymer formation. Atomic force microscopy (AFM) was carried out by spin-coating (62 rpm) the corresponding solutions on mica surfaces. AFM images indicated that peptide 1 self-assembled into a nano-fiber with a width of ca. 40 nm and a height of ca. 2 nm (Fig. 9a and b), which is in agreement with the SEM and TEM data (Fig. 8). On the other hand, the metal complex showed a sheet-like structure with a height of ca. 10 nm (Fig. 9c and d). Altogether, microscopy images demonstrated that peptide 1 forms linear, chain-like assemblies; by further coordinating with the iron ion, the assembly further aggregates into larger nano-sheet structures (Fig. 10).
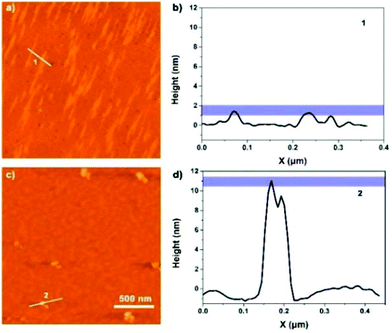 | ||
| Fig. 9 (a) AFM image of peptide 1; (b) height data along 1. (c) AFM image of the peptide 1–Fe2+ complex; (d) height data along 2. | ||
Conclusions
In conclusion, we have developed a small peptide 1 with two binding interactions that self-assembled into a fiber-like supramolecular polymer due to H-bonding and aromatic stacking interactions in DMSO. Upon the addition of Fe2+, the polymer further aggregated into larger flaky nanostructures. Both binding interactions, the formation of a G-quartet and an iron–terpyridine complex, are independent of each other and stable in solution. NMR spectroscopy, viscosity studies, UV/vis spectroscopy, CD, SEM, TEM, DLS and AFM are consistent and fully confirm this assembly mechanism. Thus, this monomer 1 is a potential controllable building block that forms supramolecular polymers in a polar solvent. Such a system might be of interest for the construction of biocompatible, stimuli responsive polymers in bio-medical applications.Conflicts of interest
There are no conflicts to declare.Acknowledgements
We thank the NSFC/China (91529101, 21572057 and 21778017) (91529101 and 21572057) for financial support. Rongfeng Zou thanks the China Scholarship Council (CSC) for financial support.Notes and references
- L. Brunsveld, B. J. B. Folmer, E. W. Meijer and R. P. Sijbesma, Chem. Rev., 2001, 101, 4071–4098 CrossRef CAS PubMed.
- J.-M. Lehn, Science, 2002, 295, 2400–2403 CrossRef CAS PubMed.
- X. Yan, B. Jiang, T. R. Cook, Y. Zhang, J. Li, Y. Yu, F. Huang, H.-B. Yang and P. J. Stang, J. Am. Chem. Soc., 2013, 135, 16813–16816 CrossRef CAS PubMed.
- X. Yan, S. Li, J. B. Pollock, T. R. Cook, J. Chen, Y. Zhang, X. Ji, Y. Yu, F. Huang and P. J. Stang, Proc. Natl. Acad. Sci. U. S. A., 2013, 110, 15585–15590 CrossRef CAS PubMed.
- P. Duan and M. Liu, Langmuir, 2009, 25, 8706–8713 CrossRef CAS PubMed.
- J. D. Hartgerink, Science, 2001, 294, 1684–1688 CrossRef CAS PubMed.
- M. R. Caplan, P. N. Moore, S. Zhang, R. D. Kamm and D. A. Lauffenburger, Biomacromolecules, 2000, 1, 627–631 CrossRef CAS PubMed.
- Y. Lalatonne, J. Richardi and M. P. Pileni, Nat. Mater., 2004, 3, 121–125 CrossRef CAS PubMed.
- H. Dou, M. Jiang, H. Peng, D. Chen and Y. Hong, Angew. Chem., Int. Ed., 2003, 42, 1516–1519 CrossRef CAS PubMed.
- G. Gröger, V. Stepanenko, F. Würthner and C. Schmuck, Chem. Commun., 2009, 698–700 RSC.
- G. Yu, C. Han, Z. Zhang, J. Chen, X. Yan, B. Zheng, S. Liu and F. Huang, J. Am. Chem. Soc., 2012, 134, 8711–8717 CrossRef CAS PubMed.
- Z. Ge, J. Hu, F. Huang and S. Liu, Angew. Chem., Int. Ed., 2009, 48, 1798–1802 CrossRef CAS PubMed.
- Z.-Y. Li, Y. Zhang, C.-W. Zhang, L.-J. Chen, C. Wang, H. Tan, Y. Yu, X. Li and H.-B. Yang, J. Am. Chem. Soc., 2014, 136, 8577–8589 CrossRef CAS PubMed.
- W. Zheng, L.-J. Chen, G. Yang, B. Sun, X. Wang, B. Jiang, G.-Q. Yin, L. Zhang, X. Li, M. Liu, G. Chen and H.-B. Yang, J. Am. Chem. Soc., 2016, 138, 4927–4937 CrossRef CAS PubMed.
- W. Zheng, G. Yang, S.-T. Jiang, N. Shao, G.-Q. Yin, L. Xu, X. Li, G. Chen and H.-B. Yang, Mater. Chem. Front., 2017, 1, 1823–1828 RSC.
- G. Yu, R. Zhao, D. Wu, F. Zhang, L. Shao, J. Zhou, J. Yang, G. Tang, X. Chen and F. Huang, Polym. Chem., 2016, 7, 6178–6188 RSC.
- X. Ji, K. Jie, S. C. Zimmerman and F. Huang, Polym. Chem., 2015, 6, 1912–1917 RSC.
- U. S. Schubert and C. Eschbaumer, Angew. Chem., Int. Ed., 2002, 41, 2892–2926 CrossRef CAS PubMed.
- T. P. Knowles, A. W. Fitzpatrick, S. Meehan, H. R. Mott, M. Vendruscolo, C. M. Dobson and M. E. Welland, Science, 2007, 318, 1900–1903 CrossRef CAS PubMed.
- I. Gadwal, S. De, M. C. Stuparu, S. G. Jang, R. J. Amir and A. Khan, J. Polym. Sci., Part A: Polym. Chem., 2012, 50, 2415–2420 CrossRef CAS.
- S. H. Jung, J. Jeon, H. Kim, J. Jaworski and J. H. Jung, J. Am. Chem. Soc., 2014, 136, 6446–6452 CrossRef CAS PubMed.
- S. Bhowmik, B. N. Ghosh, V. Marjomäki and K. Rissanen, J. Am. Chem. Soc., 2014, 136, 5543–5546 CrossRef CAS PubMed.
- D. E. Przybyla and J. Chmielewski, J. Am. Chem. Soc., 2010, 132, 7866–7867 CrossRef CAS PubMed.
- E. Gazit, Chem. Soc. Rev., 2007, 36, 1263–1269 RSC.
- L. Yu and J. Ding, Chem. Soc. Rev., 2008, 37, 1473–1481 RSC.
- G. A. Jeffrey, An introduction to hydrogen bonding, Oxford University Press, New York, 1997 Search PubMed.
- S. Burattini, B. W. Greenland, D. H. Merino, W. Weng, J. Seppala, H. M. Colquhoun, W. Hayes, M. E. Mackay, I. W. Hamley and S. J. Rowan, J. Am. Chem. Soc., 2010, 132, 12051–12058 CrossRef CAS PubMed.
- G. Gröger, W. Meyer-Zaika, C. Böttcher, F. Gröhn, C. Ruthard and C. Schmuck, J. Am. Chem. Soc., 2011, 133, 8961–8971 CrossRef PubMed.
- M. Ziegler, V. Monney, H. Stoeckli-Evans, A. Von Zelewsky, I. Sasaki, G. Dupic, J.-C. Daran and G. G. Balavoine, J. Chem. Soc., Dalton Trans., 1999, 667–676 RSC.
- L. Meng, K. Liu, S. Mo, Y. Mao and T. Yi, Org. Biomol. Chem., 2013, 11, 1525–1532 CAS.
- J. Li, Y. Kuang, Y. Gao, X. Du, J. Shi and B. Xu, J. Am. Chem. Soc., 2013, 135, 542–545 CrossRef CAS PubMed.
- D. Wu, J. Zhou, J. Shi, X. Du and B. Xu, Chem. Commun., 2014, 50, 1992–1994 RSC.
- J. Zhou, X. Du, N. Yamagata and B. Xu, J. Am. Chem. Soc., 2016, 138, 3813–3823 CrossRef CAS PubMed.
- S. Zhang, Nat. Biotechnol., 2003, 21, 1171–1178 CrossRef CAS PubMed.
- C. G. Pappas, R. Shafi, I. R. Sasselli, H. Siccardi, T. Wang, V. Narang, R. Abzalimov, N. Wijerathne and R. V. Ulijn, Nat. Nanotechnol., 2016, 11, 960–967 CrossRef CAS PubMed.
- Z. A. Arnon, A. Vitalis, A. Levin, T. C. T. Michaels, A. Caflisch, T. P. J. Knowles, L. Adler-Abramovich and E. Gazit, Nat. Commun., 2016, 7, 13190 CrossRef CAS PubMed.
- J. Wu, Y. Zou, C. Li, W. Sicking, I. Piantanida, T. Yi and C. Schmuck, J. Am. Chem. Soc., 2012, 134, 1958–1961 CrossRef CAS PubMed.
- G. Gottarelli, S. Masiero and G. P. Spada, J. Chem. Soc., Chem. Commun., 1995, 2555–2557 RSC.
- D. González-Rodríguez, P. G. A. Janssen, R. Martín-Rapún, I. D. Cat, S. D. Feyter, A. P. H. J. Schenning and E. W. Meijer, J. Am. Chem. Soc., 2010, 132, 4710–4719 CrossRef PubMed.
- D. González-Rodríguez, J. L. J. van Dongen, M. Lutz, A. L. Spek, A. P. H. J. Schenning and E. W. Meijer, Nat. Chem., 2009, 1, 151–155 CrossRef PubMed.
- J. Zhan, M. Zhang, M. Zhou, B. Liu, D. Chen, Y. Liu, Q. Chen, H. Qiu and S. Yin, Macromol. Rapid Commun., 2014, 35, 1424–1429 CrossRef CAS PubMed.
- F. S. Han, M. Higuchi and D. G. Kurth, Adv. Mater., 2007, 19, 3928–3931 CrossRef CAS.
- S. Masiero, R. Trotta, S. Pieraccini, S. De Tito, R. Perone, A. Randazzo and G. P. Spada, Org. Biomol. Chem., 2010, 8, 2683–2692 CAS.
- M. Panda and J. A. Walmsley, J. Phys. Chem. B, 2011, 115, 6377–6383 CrossRef CAS PubMed.
- M. Kimura, M. Sano, T. Muto, K. Hanabusa, H. Shirai and N. Kobayashi, Macromolecules, 1999, 32, 7951–7953 CrossRef CAS.
- I. Yoshikawa, S. Yanagi, Y. Yamaji and K. Araki, Tetrahedron, 2007, 63, 7474–7481 CrossRef CAS.
- X. Wang, L. Zhou, H. Wang, Q. Luo, J. Xu and J. Liu, J. Colloid Interface Sci., 2011, 353, 412–419 CrossRef CAS PubMed.
Footnote |
| † Electronic supplementary information (ESI) available. See DOI: 10.1039/c7py01901g |
| This journal is © The Royal Society of Chemistry 2018 |

