Two types of B-site ordered structures of the double perovskite Y2CrMnO6: experimental identification and first-principles study†
Weipeng
Wang
ab,
Fuyang
Liu
c,
Xuejing
Zhang
ab,
Xi
Shen
a,
Yuan
Yao
 a,
Yanguo
Wang
a,
Banggui
Liu
ab,
Xiaoyang
Liu
a,
Yanguo
Wang
a,
Banggui
Liu
ab,
Xiaoyang
Liu
 *c and
Richeng
Yu
*ab
aBeijing National Laboratory of Condensed Matter Physics, Institute of Physics, Chinese Academy of Sciences, Beijing 100190, P. R. China. E-mail: rcyu@aphy.iphy.ac.cn
bSchool of Physical Sciences, University of Chinese Academy of Sciences, P. R. China
cState Key Laboratory of Inorganic Synthesis and Preparative Chemistry, Jilin University, Changchun 130012, P. R. China. E-mail: liuxy@jlu.edu.cn
First published on 14th November 2017
Abstract
Double perovskite generally exhibits small structure distortion induced by the expansion/contraction and tilting of the BO6 octahedron. It is difficult to precisely determine their structures, particularly the phase with notable pseudo-symmetry structure and two or more phases with slightly different structures. In this paper, the double perovskite Y2CrMnO6 synthesized under high pressure was studied using scanning transmission electron microscopy and first-principles calculations. The new finding is that a rock-salt ordered structure and a layer ordered structure coexist in Y2CrMnO6. Similar to the Cu2+-based compound, this Mn3+-based compound is another new system with layer ordered structure. Unlike the structures of YCrO3 and YMnO3, the ordered structure of Y2CrMnO6 displays half-metal characteristics.
1. Introduction
Single-phase magnetoelectric (ME) material is the most studied multiferroic material, in which ferromagnetic and ferroelectric orders are coexistent.1–4 ME coupling not only contributes abundant physical mechanisms but also offers numerous potential applications in four-state digital information memory, transducers of ME energy conversion, etc.5,6 According to the interaction between these two orders, ME materials can be divided into two types of materials:7 type-I materials, which exhibit very weak ME couplings and possess different origins for the magnetic and ferroelectric polarization; type-II materials, which possess strong coupling interactions and ferroelectric polarizations, generally related to particular magnetic properties.8,9Among the studied type-II ME materials, the perovskite structure materials have received the most attention due to their prominent properties and attractive physical mechanisms.10–12 It has been known that the properties of perovskites such as the electronic structure, magnetic order and ferroelectric polarization are primarily governed by the B-site ions.13,14 For instance, YCrO3 exhibits a monoclinic structure and belongs to the type-I ME material family. It shows weak ferromagnetism below 140 K, stemming from a canted antiferromagnetic order and displays ferroelectricity below 473 K, originating from chromium displacements along the z-direction.15,16 An opposite instance is orthorhombic YMnO3, which belongs to the type-II ME material family.17,18 Neutron diffraction and magnetization measurements on the polycrystalline sample have demonstrated that YMnO3 has a magnetic order below the Néel temperature of 42 K and ferroelectric order below 31 K.19,20 The ferroelectricity is caused by shifts of oxygen ions due to the inverse Dzyaloshinskii–Moriya (DM) interaction.20–23 Further consideration of the exceptional structure and compositional flexibility of the perovskite structure shows that it is possible to tune the properties through substituting the B site ion.14 Unfortunately, this substitution is accompanied by the expansion/contraction and tilting of the BO6 octahedron to accommodate the crystal structure.24 The crucial point in detecting the slight octahedral distortion is to determine the oxygen atom position. Therefore, it is difficult to precisely determine the crystal structure with a tiny distortion of the BO6 octahedron by X-ray diffraction (XRD), neutron diffraction, electron diffraction or synchrotron radiation particularly when heavy elements are present.25,26 If the phase has either a notable pseudo-symmetry structure or two slightly different structures that are coexistent, the traditional measurement methods become incapable.
In this study, we investigate the crystal Y2CrMnO6, which contains B-site ions of Cr3+ and Mn3+. It should be noted that Mn3+ is a Jahn–Teller ion, which can induce octahedral expansion/contraction along a direction, while the Cr3+ ion does not exhibit this effect.27 In addition to the differences in ion radius and electronic structure between these two ions, Y2CrMnO6 should possess structures and properties different from YMnO3 and YCrO3. High angle annular dark field (HAADF) imaging, annular bright field (ABF) imaging, and selected area electron diffraction (SAED) measurements were performed to detect the structure of Y2CrMnO6. Peak pair analysis (PPA) software and Cambridge serial total energy package (CASTEP) method were applied to further analyze these structures. Image simulation technology was also used to examine the proposed structures. Finally, the physical properties were investigated by the first-principles calculations.
2. Experimental section
2.1 Synthesis of single crystal powders of Y2CrMnO6![[thin space (1/6-em)]](https://www.rsc.org/images/entities/h3_char_2009.gif) 28
28
The sample was synthesized by two steps. The YCrO3 (or hexagonal YMnO3) powder was used as a precursor and prepared through the solid state reaction between Y2O3 and Cr2O3 (or Mn2O3) at 1573 K under ambient pressure. Then, the YCrO3 and hexagonal YMnO3 powders were mixed completely and loaded into a platinum capsule with a flux of H2O and KCl. Subsequently, the powders were heated at 1573 K under 6 GPa for 2 h. Finally, the obtained products were quenched to room temperature and washed with distilled water to remove KCl.
2.2 TEM sample preparation
The specimens for transmission electron microscopy (TEM) were prepared by the traditional powder sample preparation method. The synthesized powders were placed into alcohol solution and ground in an agate mortar for about 20 min and then ultrasonically concussed for 20 min. Finally, the mixture was placed onto a copper grid covered with lacey carbon film.2.3 TEM observations
The scanning transmission electron microscopy (STEM) (HAADF and ABF) and SAED were performed on a JEM-ARM200F microscope with double Cs correctors for the condenser lens and objective lens. The available point resolution was better than 0.078 nm at an operating voltage of 200 kV. The acceptance angles were 90–370 mrad for HAADF imaging and 10–20 mrad for ABF imaging. All the images shown in this text were Fourier-filtered to minimize the effect of contrast noise. The filtering had no effect on the measurements.2.4 Theoretical calculations
For Y2CrMnO6, the structure optimization and density of states (DOSs) were both calculated by the method of generalized gradient approximation plus U (GGA + U) in CASTEP.2.5 Characterizations of magnetic properties
The magnetic properties were measured using the superconducting quantum interference device system (SQUID, Quantum Design Inc.).3. Results and discussion
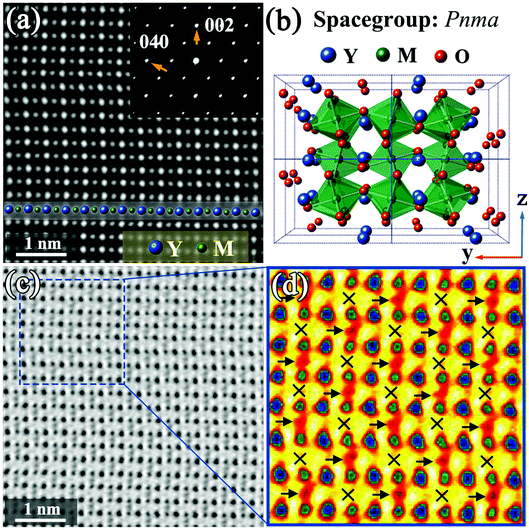
Fig. 1 shows STEM images of a Y2CrMnO6 grain along the [100] direction indexed to the structure of orthorhombic YMnO3. The YMnO3 structure, with a space group of Pnma, is shown in Fig. 1(b). Fig. 1(a) displays an HAADF image, in which the bright dot locations correspond to the atomic columns and the intensity is proportional to Z1.7, where Z is the relative atomic number.29,30 On the basis of the YMnO3 structure, the bright dots can be marked out by the relative atom columns as shown in the inset of Fig. 1(a). The corresponding SAED pattern (inset of Fig. 1(a)) shows diffraction spots similar to those of orthorhombic YMnO3. Moreover, the corresponding ABF image and its colored enlarged portion are displayed in Fig. 1(c) and (d), respectively. According to ABF imaging theory, the dark dot locations represent the atomic columns and the intensity is proportional to Z1/3.31,32 The merit of ABF imaging technology is that the contrast of the image is sensitive to the light atoms, such as lithium and oxygen.33,34 Therefore, it is beneficial to check the structure change induced by these atoms. From Fig. 1(c) and (d), it can be observed that this ABF image presents a fascinating phenomenon, in which the dark points (pointed by the arrows) between the M-site atoms show an alternating arrangement along both the y and z directions. In the orthorhombic YMnO3 with space group Pnma, these points correspond to the double oxygen atomic columns and have equivalent crystallography positions, while the alternative arrangement occurs in Y2CrMnO6. The ordered arrangement in Y2CrMnO6 indicates a crystal structure different from that of YMnO3. Considering the difference in composition between Y2CrMnO6 and YMnO3, it is reasonable to speculate that the order of double oxygen atoms of this type can be induced by M atom ordered structure. Referring to the B-site ion ordered double perovskites, this Y2CrMnO6 structure corresponds to rock-salt ordered structure.14 This is the most common type of B-site ordering in the known double perovskites;35,36 nevertheless, it has not yet been reported in Y2CrMnO6.In order to clearly understand this type of ordered structure, more detailed analyses were performed. The inverse ABF image (IABF) of Fig. 1(c) was chosen for the peak pair analysis (PPA) software37 and the results are shown in Fig. 2(a). A partial image, as shown in Fig. 2(b), was selected for structure analyses and the results are shown in Fig. 2(c–e). The Y–Y distances between adjacent rows are denoted as red circles (Y1–Y2) and black squares (Y2–Y3), and the data demonstrate that these two distances show no evident difference as shown in Fig. 2(c). The distances between M and the nearest Y ions along the y-direction are also shown in Fig. 2(d). It is clear that the distances of YA–M (denoted by the purple stars) are larger than those of M–YB (denoted by dark cyan left triangles) and the corresponding average values are 19.01 (±0.25) and 18.34 (±0.30) pixels, respectively (one pixel denotes 9.6 pm). Fig. 2(e) shows the distances between two nearest Y ions along the z-direction. The measurements for five layers along the z direction are presented, and the numbers along the horizontal direction denote the sequence numbers of Y–Y along the y direction. It is easy to observe that the distance between two Y ions varies in a large–small–large–small… manner along the y-direction in each layer; it shows an opposite trend between the nearest layers, i.e., a smallest distance in one layer corresponds to a largest distance in the two nearest layers and vice versa.
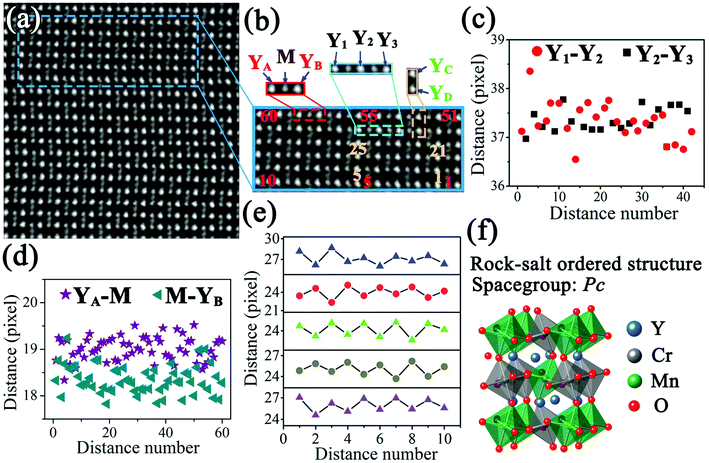 | ||
| Fig. 2 ((a), (b)) IABF images corresponding to Fig. 1(c) and enlarged partial image; ((c)–(e)) distance distributions of the Y1–Y2, Y2–Y3, YA–M, M–YB, YC–YD; according to the experimental condition, one pixel denotes 9.6 pm; (f) rock-salt ordered structure diagram of Y2CrMnO6. | ||
Based on the above discussion, we propose a structural model corresponding to the rock-salt ordered structure with a space-group of Pc (No. 7) (see ESI†) and have modified it by the first-principles method. The modified structure diagram is shown in Fig. 2(f).
Fig. 3(a) displays the HAADF image of another Y2CrMnO6 grain along the [101] direction indexed to the YMnO3 structure as shown in Fig. 3(b). The Y and M atoms are interpreted in Fig. 3(a). It can be observed that the bright spots corresponding to the atomic columns and the inserted SAED pattern are consistent with the scenario of orthorhombic YMnO3 structure. The interesting point is that the corresponding ABF image shown in Fig. 3(c) displays an alternative arrangement of bright and gray belts along the horizontal direction. An enlarged color image is presented in Fig. 3(d). For the space group Pnma, these belts should be equal in width. Therefore, the ordered contrast arrangement signifies that the structure of Y2CrMnO6 is different from that of orthorhombic YMnO3. Further, we exclude it from the rock-salt structure mentioned above through structure analysis and the ABF image simulation.
Fig. 4(a) shows the IABF image corresponding to Fig. 3(c). The intensity profile of the M atoms along the horizontal direction, indicated by dotted yellow lines, is shown by the yellow curve in Fig. 4(a). It is clear that the intensity of the corresponding M atomic columns presents an ordered alternative arrangement in a strong-substrong-strong-substrong… manner. Since the M atoms at the B site are replaced by Cr and Mn ions, it is reasonable to assume that these two intensities can respectively correspond to these two different ions. In order to obtain more detailed structural information, the region marked by the red lines in Fig. 4(a) was chosen as a basic analytical unit. The involved Y and M atoms are marked as M1, M2, Y1, Y2, Y3, Y4, Y5, and Y6.
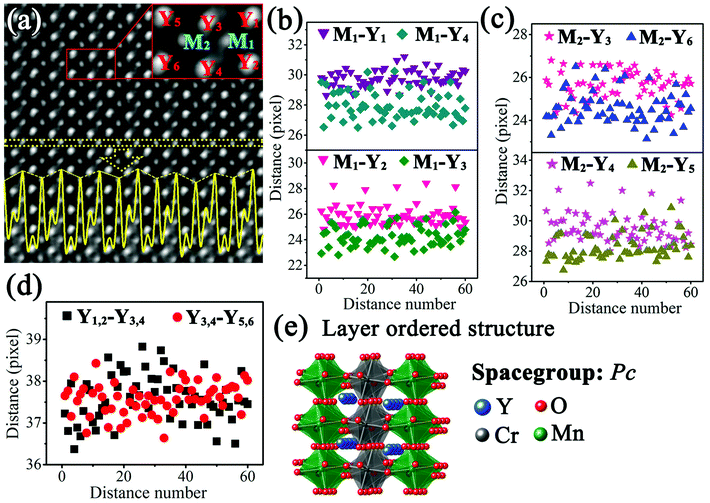 | ||
| Fig. 4 (a) IABF image corresponding to Fig. 3(c) and enlarged part of image; the yellow curve represents the intensity profile of the M atoms; ((b)–(d)) distance distributions of M1–Y1, M1–Y2, M1–Y3, M1–Y4, M2–Y3, M2–Y4, M2–Y5, M2–Y6, Y1,2–Y3,4, Y3,4–Y5,6 (according to the experimental condition, one pixel denotes 9.6 pm); (e) layer ordered structure diagram of Y2CrMnO6. | ||
To understand the formation of this superstructure, the distances of Y–Y and Y–M were studied. Fig. 4(b) shows the distances between M1 atom and its four nearest Y atoms. It is evident that the distances M1–Y1 (purple down-triangle) and M1–Y2 (pink down-triangle) are larger than those of M1–Y4 (dark cyan diamond) and M1–Y3 (olive diamond). The average distances are 29.75 (±0.56) pixels for M1–Y1, 25.94 (±0.83) pixels for M1–M2, 24.26 (±0.81) pixels for M1–Y3, and 27.96 (±0.91) pixels for M1–Y4. The distances between M2 atom and the four nearest Y atoms were also calculated and the results are shown in Fig. 4(c). Similarly, the distances of M2–Y3 (pink star) and M2–Y4 (magenta star) are larger than those of M2–Y6 (blue up-triangle) and M2–Y5 (dark yellow up-triangle). The average values are 25.64 (±0.68) pixels for M2–Y3, 29.55 (±0.98) pixels for M2–Y4, 28.27 (±0.85) pixels for M2–Y5, and 24.57 (±0.76) pixels for M2–Y6. The angles between the lines from M1 and M2 to their own nearest Y atoms were also detected. Fig. 4(d) shows the variations of the distance between the nearest Y rows along the horizontal direction with distance number. These two sets of distances, namely, Y1,2–Y3,4 (blank squares) and Y3,4–Y5,6 (red circles), have no significant difference.
Compared with the structure of orthorhombic YMnO3, the structure of Y2CrMnO6 shows that the M atoms at B-sites present an alternating layered arrangement of Cr and Mn ion along the horizontal direction, while Y atom coordinates remain almost unchanged. This structure is generally called the layer ordered structure of double perovskite14 and has been reported only in the Cu2+-based double perovskites.38–40 In addition, these two kinds of B-site atoms have different displacements along the horizontal direction, namely, 5.89 pm for Mn atoms in gray belts in the ABF image and 3.92 pm for Cr atoms in bright belts. Through careful structural analyses, it can be judged that the Y2CrMnO6 structure of this type is space group monoclinic structure Pc (No. 7) instead of orthorhombic structure Pnma (No. 62). Unfortunately, the chaotic distribution of oxygen atoms along this crystal axis, resulting from the distortion and tilting of the MO6 octahedron, makes it difficult to obtain accurate coordinates of oxygen atoms. Hence, first-principles calculations were carried out to acquire a reasonable crystal structure of Y2CrMnO6. The schematic diagram of the crystal structure is presented in Fig. 4(e) and the detailed crystal structure data are provided in the ESI.†
Since these two types of ordered structures were distinguished by ABF images, it is necessary to perform image simulations to verify the determined crystal structure. The STEM-ABF images were simulated with the xHREM software and results are shown in Fig. 5. The applied parameters were based on the experimental parameters. It is evident that the simulated image of the rock-salt ordered structure shows the alternative arrangement of double oxygen atoms (pointed by the arrows, Fig. 5(a)) and the simulated image of the layer ordered structure shows the alternative arrangement of bright and gray belts (Fig. 5(b)). The SAED patterns and HAADF images were also simulated. All the simulated images were in accordance with the experimental images, indicating the correctness of the proposed structures.
 | ||
| Fig. 5 Simulated ABF images and their enlarged parts of (a) the rock-salt ordered and (b) the layer ordered Y2CrMnO6; colored images show the details of enlarged parts. | ||
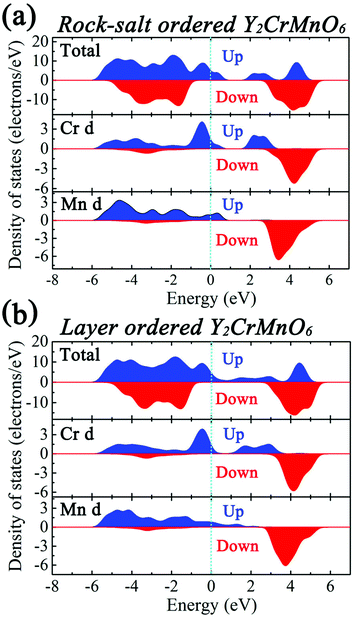
The first-principles calculations were carried out for the different spin configurations for the rock-salt ordered and layer ordered structures of Y2CrMnO6, and the results are shown in Table 1. The arrows represent the spin directions of the transition metal ions. It can be seen that, for either rock-salt ordered or layer ordered structure, the ferromagnetic spin configuration (Cr1↑Cr2↑Mn1↑Mn2↑) exhibits the lowest binding energy and thus is the most stable structure. The ferromagnetic properties of the prepared Y2CrMnO6 sample were also checked by zero field cooled (ZFC), field cooled (FC) and field dependence of magnetization (M–H) and the results are shown in Fig. 6. The ZFC, FC and M–H curves of the Y2CrMnO6 sample clearly infer the ferromagnetic properties. It should be noted that the binding energies for the two ordered structures are almost equal as listed in Table 1; this is a possible reason for coexistence of these two ordered structures. Fig. 7 shows the spin-polarized densities of states (DOSs) of the two ordered structures of Y2CrMnO6. From the total DOSs of the rock salt ordered Y2CrMnO6 (Fig. 7(a)), it can be observed that only the up-spin state exists at the Fermi level, indicating its half-metal properties. Referring to the partial DOSs of 3d electrons of Cr and Mn atoms, both elements contribute the up-spin state. Similar results are also obtained for the layer ordered structure. Therefore, both ordered structures possess half-metal characteristics.
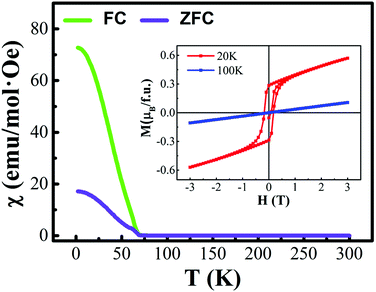 | ||
| Fig. 6 ZFC, FC and M-H curves of Y2CrMnO6; the ZFC and FC were measured in a magnetic field of H = 1000 Oe. | ||
| Y2CrMnO6 | Binding energy (eV f.u.−1) | |
|---|---|---|
| Rock-salt ordered structure | Layer ordered structure | |
| Cr1↑Cr2↑Mn1↑Mn2↑ | −75.373 | −75.366 |
| Cr1↑Cr2↑Mn1↓Mn2↓ | −75.183 | −75.318 |
| Cr1↑Cr2↓Mn1↑Mn2↓ | −75.272 | −75.064 |
| Cr1↑Cr2↓Mn1↓Mn2↑ | −75.289 | −75.025 |
| Cr1↑Cr2↓Mn1↓Mn2↓ | −75.180 | −75.304 |
| Cr1↓Cr2↑Mn1↓Mn2↓ | −75.180 | −75.205 |
| Cr1↓Cr2↓Mn1↑Mn2↓ | −75.173 | −74.825 |
| Cr1↓Cr2↓Mn1↓Mn2↑ | −75.173 | −74.743 |
4. Conclusions
The Y2CrMnO6 synthesized by high pressure method exhibited two types of coexistent ordered structures: rock-salt ordered structure and layer ordered structure. These ordered structures were inferred from ABF images. The ABF image along the [100] axis of the rock-salt ordered structure shows an alternative arrangement of double oxygen atoms along the y- and z-directions, while the ABF image along the [101] axis shows an alternating arrangement of bright and gray belts along the y-direction. Combining PPA software with CASTEP, two possible ordered structures were proposed. All the simulated images show good agreement with experimental ones, verifying the correctness of the suggested structures. The first-principles calculations indicated that these two ordered structures of Y2CrMnO6 both have half-metal characteristics, which are totally different from those of YCrO3 and YMnO3.Conflicts of interest
There are no conflicts to declare.Acknowledgements
This work was supported by the National key research program of China (Grant No. 2016YFA0300701, 2017YFA0206200) and the National Natural Science Foundation of China (Grant No. 11174336, 11374343).References
- W. Eerenstein, N. D. Mathur and J. F. Scott, Nature, 2006, 442, 759–765 CrossRef CAS PubMed.
- M. Fiebig, J. Phys. D: Appl. Phys., 2005, 38, R123–R152 CrossRef CAS.
- C.-W. Nan, M. I. Bichurin, S. Dong, D. Viehland and G. Srinivasan, J. Appl. Phys., 2008, 103, 031101 CrossRef.
- C. A. Vaz, J. Hoffman, C. H. Ahn and R. Ramesh, Adv. Mater., 2010, 22, 2900–2918 CrossRef CAS PubMed.
- J. F. Scott, Nat. Mater., 2007, 6, 256–257 CrossRef CAS PubMed.
- J. G. Wan, Z. Y. Li, Y. Wang, M. Zeng, G. H. Wang and J. M. Liu, Appl. Phys. Lett., 2005, 86, 202504 CrossRef.
- D. I. Khomskii, J. Magn. Magn. Mater., 2006, 306, 1–8 CrossRef CAS.
- Y. Tokura and S. Seki, Adv. Mater., 2010, 22, 1554–1565 CrossRef CAS PubMed.
- H. Murakawa, Y. Onose, S. Miyahara, N. Furukawa and Y. Tokura, Phys. Rev. Lett., 2010, 105, 137202 CrossRef CAS PubMed.
- L. Yan, Y. Yang, Z. Wang, Z. Xing, J. Li and D. Viehland, J. Mater. Sci., 2009, 44, 5080–5094 CrossRef CAS.
- S. Dong and J.-M. Liu, Mod. Phys. Lett. B, 2012, 26, 1230004 CrossRef.
- H. Wu, L. Li, L.-Z. Liang, S. Liang, Y.-Y. Zhu and X.-H. Zhu, J. Eur. Ceram. Soc., 2015, 35, 411–441 CrossRef CAS.
- A. A. Belik, J. Solid State Chem., 2012, 195, 32–40 CrossRef CAS.
- S. Vasala and M. Karppinen, Prog. Solid State Chem., 2015, 43, 1–36 CrossRef CAS.
- K. Ramesha, A. Llobet, T. Proffen, C. R. Serrao and C. N. R. Rao, J. Phys.: Condens. Matter, 2007, 19, 102202 CrossRef.
- C. R. Serrao, A. K. Kundu, S. B. Krupanidhi, U. V. Waghmare and C. N. R. Rao, Phys. Rev. B: Condens. Matter Mater. Phys., 2005, 72, 2201101 CrossRef.
- S. X. Lin, X. G. Fang, A. H. Zhang, X. B. Lu, J. W. Gao, X. S. Gao, M. Zeng and J. M. Liu, J. Appl. Phys., 2014, 116, 163705 CrossRef.
- H. Wadati, J. Okamoto, M. Garganourakis, V. Scagnoli, U. Staub, Y. Yamasaki, H. Nakao, Y. Murakami, M. Mochizuki, M. Nakamura, M. Kawasaki and Y. Tokura, Phys. Rev. Lett., 2012, 108, 047203 CrossRef CAS PubMed.
- B. Lorenz, Y.-Q. Wang and C.-W. Chu, Phys. Rev. B: Condens. Matter Mater. Phys., 2007, 76, 104405 CrossRef.
- J. Kim, S. Jung, M. S. Park, S.-I. Lee, H. D. Drew, H. Cheong, K. H. Kim and E. J. Choi, Phys. Rev. B: Condens. Matter Mater. Phys., 2006, 74, 052406 CrossRef.
- I. A. Sergienko and E. Dagotto, Phys. Rev. B: Condens. Matter Mater. Phys., 2006, 73, 094434 CrossRef.
- D. Okuyama, S. Ishiwata, Y. Takahashi, K. Yamauchi, S. Picozzi, K. Sugimoto, H. Sakai, M. Takata, R. Shimano, Y. Taguchi, T. Arima and Y. Tokura, Phys. Rev. B: Condens. Matter Mater. Phys., 2011, 84, 054440 CrossRef.
- I. A. Sergienko, C. Sen and E. Dagotto, Phys. Rev. Lett., 2006, 97, 227204 CrossRef PubMed.
- J. Fontcuberta, C. R. Physique, 2015, 16, 204–226 CrossRef CAS.
- Q. Zhou, T.-Y. Tan, B. J. Kennedy and J. R. Hester, J. Solid State Chem., 2013, 206, 122–128 CrossRef CAS.
- W. T. Fu, R. J. Götz and D. J. W. Ijdo, J. Solid State Chem., 2010, 183, 419–424 CrossRef CAS.
- N. D. Todorov, M. V. Abrashev, V. G. Ivanov, G. G. Tsutsumanova, V. Marinova, Y. Q. Wang and M. N. Iliev, Phys. Rev. B: Condens. Matter Mater. Phys., 2011, 83, 224303 CrossRef.
- F. Liu, J. Li, Q. Li, Y. Wang, X. Zhao, Y. Hua, C. Wang and X. Liu, Dalton Trans., 2014, 43, 1691–1698 RSC.
- H. R. P. Hartel and C. Dinges, Ultramicroscopy, 1996, 63, 93–114 CrossRef.
- R. F. Loane, E. J. Kirkland and J. Silcox, Acta Crystallogr., Sect. A: Found. Crystallogr., 1988, 44, 912–927 CrossRef.
- S. D. Findlay, N. Shibata, H. Sawada, E. Okunishi, Y. Kondo and Y. Ikuhara, Ultramicroscopy, 2010, 110, 903–923 CrossRef CAS PubMed.
- S. D. Findlay, N. Shibata, H. Sawada, E. Okunishi, Y. Kondo, T. Yamamoto and Y. Ikuhara, Appl. Phys. Lett., 2009, 95, 191913 CrossRef.
- X. He, L. Gu, C. Zhu, Y. Yu, C. Li, Y.-S. Hu, H. Li, S. Tsukimoto, J. Maier, Y. Ikuhara and X. Duan, Mater. Express, 2011, 1, 43–50 CrossRef CAS.
- H. Hojo, T. Mizoguchi, H. Ohta, S. D. Findlay, N. Shibata, T. Yamamoto and Y. Ikuhara, Nano Lett., 2010, 10, 4668–4672 CrossRef CAS PubMed.
- P. K. Dager, C. M. Chanquía, L. Mogni and A. Caneiro, Mater. Lett., 2015, 141, 248–251 CrossRef CAS.
- T. K. Wallace, C. Ritter and A. C. McLaughlin, J. Solid State Chem., 2012, 196, 379–383 CrossRef CAS.
- P. L. Galindo, S. Kret, A. M. Sanchez, J.-Y. Laval, A. Yáñez, J. Pizarro, E. Guerrero, T. Ben and S. I. Molina, Ultramicroscopy, 2007, 107, 1186–1193 CrossRef CAS PubMed.
- Q. Zhou and B. J. Kennedy, J. Phys. Chem. Solids, 2007, 68, 1643–1647 CrossRef CAS.
- S. Vasala, H. Saadaoui, E. Morenzoni, O. Chmaissem, T.-S. Chan, J.-M. Chen, Y.-Y. Hsu, H. Yamauchi and M. Karppinen, Phys. Rev. B: Condens. Matter Mater. Phys., 2014, 89, 134419 CrossRef.
- M. Gateshki, J. M. Igartua and E. Hernandez-bocanegra, J. Phys.: Condens. Matter, 2003, 15, 6199–6217 CrossRef CAS.
Footnote |
| † Electronic supplementary information (ESI) available: The detailed crystal structure data of the rock-salt ordered Y2CrMnO6 and layer ordered Y2CrMnO6. See DOI: 10.1039/c7qi00686a |
| This journal is © the Partner Organisations 2018 |

