Cyclopentadithiophene derivatives: a step towards an understanding of thiophene copolymer excited state deactivation pathways†
João
Pina
 a,
Anika
Eckert
b,
Ullrich
Scherf
 b,
Adelino M.
Galvão
 c and
J. Sérgio
Seixas de Melo
 *a
*a
aCQC, Department of Chemistry, University of Coimbra, P3004-535 Coimbra, Portugal. E-mail: sseixas@ci.uc.pt
bBergische Universitat, Wuppertal, Macromolecular Chemistry Group (buwmakro) and Institute for Polymer Technology, Gauss-Str. 20, D-42097, Wuppertal, Germany
cCentro de Química Estrutural, Instituto Superior Técnico (IST), Universidade de Lisboa, Portugal
First published on 10th November 2017
Abstract
We have carried out the excited state characterization of cyclopentadithiophene (CPDT) and its didodecyl-substituted derivative (C12CPDT) to obtain detailed insights into their photophysical pathways. These are the cis analogues of α,α′-bithiophene (α2), which normally exists in the more stable s-trans geometry. We report absorption, fluorescence, phosphorescence, and triplet-singlet difference spectra, together with quantum yields (fluorescence, phosphorescence and singlet oxygen). Fast time-resolved fluorescence and transient absorption techniques (ps-TCSPC and fs-TA) were used to characterize the initial excited state dynamics of the CPDTs and α2. In general, the two CPDTs show similar spectral and photophysical properties to α2, although phosphorescence is absent in α2 (the trans conformer). From TDDFT calculations it is shown that the large Stokes shift (SS) observed for CPDT and C12CPDT (planar in S0 and S1) is due to a bond length change in the C–C bond connecting the two thiophene units, which decreases from 146 to 137 pm. With α2 this change is accompanied by a change in the dihedral angle (25.5° in S0 to 0.2° in S1).
Introduction
Following the ground-breaking work of Tang and Vanslyke,1,2 the interest in the field of organic materials for organic light-emitting diodes (OLEDs) has continued to rise for more than 30 years.3 One of the ongoing and relevant issues receiving particular attention is how to overcome the problem that 3/4 of the electrically generated energy is dissipated as heat via the formation of triplets.3 This is essentially due to the fact that with the great majority of the systems derived from the most relevant families of conjugated organic polymers (polythiophenes, polyphenylenevinylenes, polyfluorenes) phosphorescence is generally absent. The search for phosphorescent polymers and oligomers, and, in general, small organic molecules with short natural phosphorescent lifetimes, is, therefore, of utmost relevance.The α,α′-bithiophene moiety is a key constituent of many conjugated organic polymers and copolymers, and its conformational behavior, both in the ground and excited state, has received considerable attention, mainly from a theoretical perspective.4–13 The s-trans–gauche structure is generally considered to be the dominant conformation, having a ground state geometry with an ensemble of conformers (with small differences in the barrier widths between them), but with the more stable ones having reported torsion angles for the anti-like conformation varying from 133,14 to 135,15 142.2 and 147,12 146,16,17 15011 and 1607 degrees. The s-cis planar conformer is less stable, although it has been suggested from theory and terahertz spectroscopy to coexist in the gas phase or in cyclohexane solution in 46% concentration,6 with the cis to trans ratio being temperature dependent.13,15
The decay mechanisms, including ultra-fast dynamics, involved in other similar systems (oligomers and polymers of the most representative structures, for example terpyridines, p-phenylene vinynele and fluorene) have been the subject of recent studies.18–20
In CPDT, α2 is forced to adopt the cis conformer. This is investigated experimentally, together with its didodecyl-substituted derivative (C12CPDT), with the aim of rationalizing their properties in the excited state and obtaining insights into the physical chemistry of the system. Although a previous nanosecond laser flash photolysis study has been published on CPDT,21 and includes some spectral and photophysical data, detailed understanding of its excited state properties, and in particular the change between the ground state (GS) and excited state (ES) geometries, demands a comprehensive photophysical study, including the behavior of its alkylated derivative, C12CPDT.
Experimental section
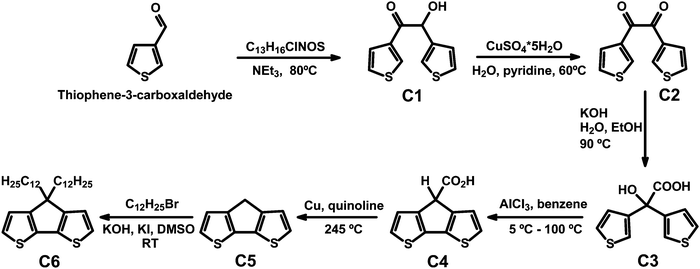
CPDT and C12CPDT were prepared following literature procedures.22–24 In particular CPDT was synthesized using a modified synthetic route first described by Asawapirom et al.22 summarized in Scheme 1.4H-Cyclopenta[1,2-b:5,4-b′]dithiophene (CPDT, C5)
4H-Cyclopenta[1,2-b:5,4-b′]dithiophene-4-carboxylic acid (7.68 g, 34.61 mmol) and copper (1.65 g, 25.89 mmol) were dissolved in freshly distilled quinoline (50 mL). The reaction mixture was heated to 245 °C for 45 minutes. After cooling to room temperature, the suspension was poured into a mixture of ice and hydrochloric acid. After adding diethyl ether, the mixture was filtered off and the filtrate washed with 10% hydrochloric acid, water, and sodium carbonate solution. The organic phase was dried over magnesium sulfate and the solvent was removed under reduced pressure. 4H-Cyclopenta[1,2-b:5,4-b′]dithiophene was purified by silica gel column chromatography (eluent: hexane) to afford the greyish product (4.29 g, 69.6%).1H NMR (400 MHz, C2D2Cl4) δ [ppm] = 7.14 (d, J = 4.9 Hz, 2H, Ar-H), 7.05 (d, J = 4.9 Hz, 2H, Ar-H), 3.48 (s, 2H, Ar2-CH2). 13C NMR (101 MHz, C2D2Cl4) δ [ppm] = 150.1 (Ar-R), 138.8 (Ar-R), 125.0 (Ar-H), 123.4 (Ar-H), 32.2 (Ar2-CH2). GC-MS: m/z [M+] = 178.0.
4,4-Didodecyl-4H-cyclopenta[1,2-b:5,4-b′]dithiophene (C12CPDT, C6)
4H-Cyclopenta[1,2-b:5,4-b′]dithiophene (0.85 g, 4.75 mmol), potassium hydroxide (1.07 g, 18.99 mmol), and potassium iodide (0.03 g, 0.19 mmol) were suspended in dimethyl sulfoxide (30 mL). 1-Bromododecane (2.37 g, 9.53 mmol) was added and the reaction was stirred at room temperature for 14 hours. After adding water, the reaction mixture was poured into brine. The mixture was extracted with diisopropyl ether and the combined organic phase was dried over magnesium sulphate and the solvent was removed under reduced pressure. The desired product was obtained as a yellowish oil (1.21 g, 49.1%) after silica gel column chromatography (eluent: hexane).1H NMR (600 MHz, CDCl3) δ [ppm] = 7.14 (d, J = 4.9 Hz, 2H, Ar-H), 6.93 (d, J = 4.9 Hz, 2H, Ar-H), 1.95–1.74 (m, 4H, C–(CH2)2), 1.43 (dt, J = 14.7, 7.2 Hz, 4H, C–(CH2–CH2)2), 1.38–1.02 (m, 32H, CH2), 0.98–0.92 (m, 4H, CH2–CH3), 0.90–0.87 (m, 6H, CH3). 13C NMR (151 MHz, CDCl3) δ [ppm] = 158.8 (Ar-R), 137.0 (Ar-R), 124.8 (Ar-H), 122.0 (Ar-H), 53.3 (C–(CH2)2), 37.7 (CH2), 32.8 (CH2), 31.8 (CH2), 29.5 (CH2), 29.4 (CH2), 29.3 (CH2), 29.2 (CH2), 28.7 (CH2), 28.01 (CH2), 24.4 (CH2), 22.5 (CH2), 13.9 (CH3). GC-MS: m/z [M+] = 515.4.
All the solvents used were of spectroscopic grade and no further purification was needed.
Photophysical characterization
Absorption and fluorescence spectra were recorded on a Cary 5000 UV-Vis-NIR instrument, equipped with an integrating sphere for solid state diffuse reflectance measurements, and a Horiba-Jobin-Ivon Fluorolog 3-22 fluorimeter, respectively. Phosphorescence measurements were made in methylcyclohexane glasses at 77 K and used the Horiba-Jobin-Ivon Fluorolog 3-22 spectrometer in phosphorescence mode with a pulsed excitation source. All of the fluorescence and phosphorescence spectra were corrected for the wavelength response of the system.Fluorescence quantum yields in solution were measured by the comparative method using α2 (α,α′-bithiophene) in dioxane solution (ϕF = 0.017)25 as a standard, while the phosphorescence quantum yields were determined using benzophenone (ϕPh = 0.84)26 in ethanol solution as a standard. The fluorescence quantum yield for CPDT in the solid state was obtained by the absolute method using a Hamamatsu absolute PL quantum yield spectrometer Quantaurus C11347 (integrating sphere).
Fluorescence decays were measured using a home-built picosecond time correlated single photon counting, TCSPC, apparatus (3 ps time resolution) described elsewhere.27 The fluorescence decays and the instrumental response function (IRF) were collected using a time scale of 1024 (or 4096) channels, until 5 × 10³ counts at maximum were reached. Deconvolution of the fluorescence decay curves was performed using the modulating function method, as implemented by G. Striker in the SAND program, and previously reported in the literature.28
The experimental setup used to obtain the triplet–triplet absorption spectra has been described elsewhere.31
The experimental setup for ultrafast spectroscopic and kinetic measurements consists of a broadband (350–1600 nm) HELIOS pump–probe femtosecond transient absorption spectrometer from Ultrafast Systems, equipped with an amplified femtosecond Spectra-Physics Solstice-100F laser (800 nm central wavelength displaying a pulse width of 128 fs at 1 kHz repetition rate) coupled with a Spectra-Physics TOPAS Prime F optical parametric amplifier (195–22![[thin space (1/6-em)]](https://www.rsc.org/images/entities/char_2009.gif) 000 nm) for pulse pump generation. Probe light in the visible range was generated by passing a small portion of the 800 nm light from the Solstice-100F laser through a computerized optical delay (with a time window up to 8 ns) and focusing in a vertical translating CaF2 crystal to generate a white-light continuum in the 340–750 nm range. All measurements were obtained in a 2 mm quartz cuvette with optical densities lower than 0.3 at the pump excitation wavelength. The instrumental response function of the system was assumed to be equal to that of the pump–probe cross correlation determined from the measurement of the instantaneous stimulated Raman signal from the pure solvent (in a 2 mm cuvette). Typical values for the IRF of the system were found to be better than 250 fs. To avoid photodegradation the solutions were stirred during the experiments or in movement using a motorized translating sample holder. Transient absorption data were analyzed using the Surface Xplorer PRO program from Ultrafast Systems and the global analysis of the data (from which the lifetimes of the observed transients were obtained) was performed using Glotaran software.29
000 nm) for pulse pump generation. Probe light in the visible range was generated by passing a small portion of the 800 nm light from the Solstice-100F laser through a computerized optical delay (with a time window up to 8 ns) and focusing in a vertical translating CaF2 crystal to generate a white-light continuum in the 340–750 nm range. All measurements were obtained in a 2 mm quartz cuvette with optical densities lower than 0.3 at the pump excitation wavelength. The instrumental response function of the system was assumed to be equal to that of the pump–probe cross correlation determined from the measurement of the instantaneous stimulated Raman signal from the pure solvent (in a 2 mm cuvette). Typical values for the IRF of the system were found to be better than 250 fs. To avoid photodegradation the solutions were stirred during the experiments or in movement using a motorized translating sample holder. Transient absorption data were analyzed using the Surface Xplorer PRO program from Ultrafast Systems and the global analysis of the data (from which the lifetimes of the observed transients were obtained) was performed using Glotaran software.29
TDDFT calculations
All calculations were of DFT type and carried out using GAMESS-US30 version R3. A range corrected CAMB3LYP31 functional, with 65% HF exact exchange at long range and 19% at short range, was used in the calculations of both ground- and excited-states. TDDFT calculations, with similar functionals, were used to probe the excited-state potential energy surface (PES).32 The solvent was included using the polarizable continuum model with the solvation model density to add corrections for cavitation, dispersion, and solvent structure. In TDDFT calculation of Franck–Condon (FC) excitations the dielectric constant of the solvent was split into a “bulk” component and a fast component, which is essentially the square of the refractive index. In “adiabatic” conditions only the static dielectric constant is used. Hessians were computed by numerical differentiation of analytically computed first derivatives. A 6-31G** basis set was used in either DFT or TDDFT calculations. An “ROHF” type wavefunction was used in the triplet DFT geometry optimizations to prevent spin contamination. CAMB3LYP slightly overestimates excitations with a 0.98 scale factor applied to the reported values. Excitations were corrected for Zero Point Vibrational Energy by, essentially, the frequency of the relaxing vibrational mode ±0.15 eV.Results and discussion
The structures and acronyms of the compounds investigated, together with that of the parent (trans) α2, are given in Scheme 2.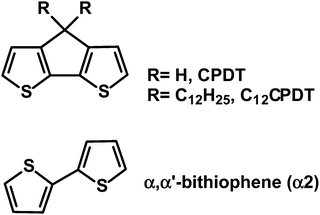 | ||
| Scheme 2 Structures of unsubstituted (CPDT) and didodecyl-substituted cyclopentadithiophene (C12CPDT), together with α,α′-bithiophene (α2) in its trans conformation. | ||
The electronic spectra of α2 have previously been described in various solvents and temperatures, together with those of its naphthalene and cyano derivatives.25,33–35 These consist of broad absorption and emission bands. However, in the subsequent oligothiophenes (with n = 3–7, etc.) although the absorption remains broad and structureless, the emission clearly becomes vibronically resolved.25 The absorption and emission spectra of CPDT and C12CPDT in methylcyclohexane solution are presented in Fig. 1. Similar spectroscopic features were, in general, observed for these compounds with, however, two distinct differences. The first is the red-shift in both the absorption and emission spectra of C12CPDT relative to CPDT; the second is that the spectra of CPDT are vibronically resolved, which is particularly noticeable in the absorption (Fig. 1), and fluorescence excitation spectra (Fig. S1 in ESI†). It is worth noting that the excitation spectra for both compounds match the absorption spectra, clearly confirming the purity of the compounds (Fig. S1, ESI†). The vibronic structure of the absorption spectra of CPDT should be further compared with that of α2. Observation of the absorption spectra of CPDT and of α225,35,36 shows that the former is vibronically resolved whereas the latter is devoid of vibronic resolution. In the case of α2 this was attributed to the existence of an ensemble of conformers at room temperature that, as the temperature was lowered, lead to a bigger average planarity of the existing conformers.25 In the case of CPDT the planar geometry induced by the CH2 bridge connecting the two thiophene units leads to a rigid structure (in the ground S0 state) and therefore to a vibronic structure similar to that observed by α2 at low temperature.25 In the case of C12CPDT a similar pattern (to CPDT) occurs although with a lower vibronic resolution. It is also worth noting that, as will be discussed in light of the TDDTF calculations, CPDT and C12CPDT present equal planar structures in both the ground and first singlet excited states and therefore the differences in the two (S0 and S1) are found in their different bond distances/lengths.
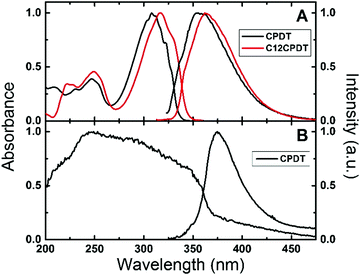 | ||
| Fig. 1 Normalized absorption and fluorescence emission spectra for (A) CPDT and C12CPDT in methylcyclohexane solution and (B) for CPDT in the solid state (powder) at 293 K. | ||
Fig. 1B presents the absorption (obtained by diffuse reflectance) and fluorescence emission spectra for CPDT as a powder in the solid state. A broader absorption was found in the solid state compared with the solution spectra. This broadening and the blue-shift in the absorption maxima (∼248 nm) may suggest the presence of H-aggregates. However, interestingly the fluorescence emission spectra, although red shifted, maintain the spectroscopic features observed in solution, while for CPDT similar fluorescence quantum yields were found in solution (0.010) and in the solid state (0.016), Table 1.
| Compd | λ max (abs) (nm) 293 K | λ max (fluo) (nm) 293 K | λ max (phosph) (nm) 77 K | λ max (T1 → Tn) (nm) 293 K | ϕ F 293 K | τ F (ps) 293 K | ϕ Ph 77K | τ Ph (ms) 77 K | τ T (μs) 293 K | ϕ Δ 293 K |
|---|---|---|---|---|---|---|---|---|---|---|
| a In the case of C12CPDT the fluorescence decays were obtained from a HPLC purified methanol solution. b Data are from ref. 34; photophysical data in benzene (ϕF and τF) and spectral data (wavelength maxima) in dioxane; NE = non-existent. | ||||||||||
| CPDT | 308 | 355 | 610 | 370 | 0.01 | 47 | 0.004 | 5.5 | 26 | 0.27 |
| C12CPDTa | 316 | 363 | 610 | 370 | 0.05 | 166a | 0.004 | 5.9 | 64 | 0.46 |
| α2b | 303 | 362 | NE | 385 | 0.026 | 46 | NE | NE | 27 | 0.96 |
For C12CPDT, it was not possible to obtain absorption or fluorescence spectra in the solid state due to the limited quantity available of this viscous oil-like derivative at 293 K. Table 1 summarizes the spectral and photophysical properties of CPDT and C12CPDT, together with those of the oligomer α2.
The fluorescence decays for CPDT and C12CPDT are presented in Fig. S2 (ESI†). Analysis of the decays of both CPDT and C12CPDT shows that they are, essentially, single exponential.
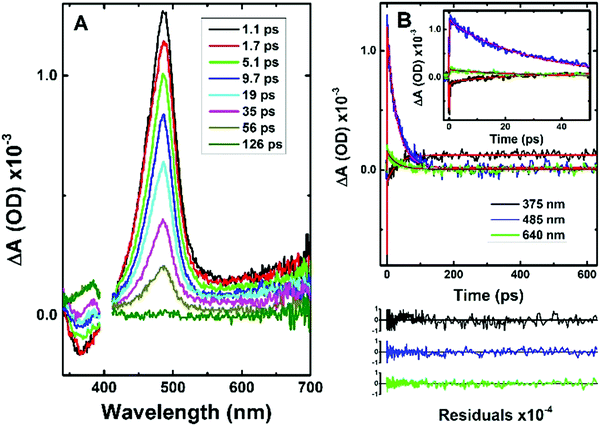
Information from the fluorescence decays is complemented by analysis of femtosecond transient absorption (fs-TA) data. Femtosecond time-resolved transient difference absorption spectra (fs-TA) for CPDT and C12CPDT were obtained with excitation at 310 nm and collection in the 340–750 nm range (Fig. 2 and Fig. S3 in ESI†). The fs-TA spectra for CPDT and C12CPDT present a positive broad transient absorption band in the 410–700 nm region, with maxima at 487 and 497 nm for CPDT and C12CPDT, respectively, that are attributed to the excited singlet state absorption (ESA), and are accompanied by a negative feature at shorter wavelengths, which, from the similarity with the fluorescence emission bands, is attributed to stimulated emission (SE), see Fig. 1. As the delay time increases the ESA band disappears and concomitantly a new band arises with a maximum at 385 nm (Fig. 3 and Fig. S3 in ESI†), which does not decay completely up to the longest delay time measured. The spectroscopic features of this latter band resemble in shape and maxima the transient triplet–triplet absorption spectra obtained by laser flash photolysis at 266 nm of degassed solutions of the two cyclopentadithiophene derivatives (Fig. S4, ESI†) and is, consequently, attributed to the triplet state absorption.
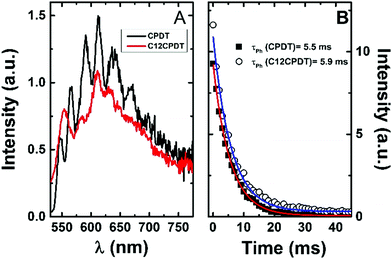 | ||
| Fig. 3 Phosphorescence emission spectra (A) and decays (B) for CPDT and C12CPDT in methylcyclohexane solution at 77 K. | ||
In ns-TA data, similar triplet–triplet absorption spectra and maxima were found for CPDT and C12CPDT, with triplet lifetimes (τT = 26–64 μs), see Fig. S4 (ESI†) and Table 1. A previous report has shown a similar maximum and lifetime following photoexcitation of CPDT and was attributed to the triplet state since efficient sensitization of the β-carotene triplet state through triplet energy transfer was observed.21
The global fit analysis of all the kinetics in the 340–710 nm range (using a sequential model) showed that for CPDT and C12CPDT the experimental traces over the whole spectra-temporal range are well fitted with the sum of three exponentials (see Table 2 together with Fig. 3 and Fig. S3 in ESI†). Initial fast decay transients of 0.98 ps, CPDT, and 0.22 ps, C12CPDT, were seen that are in good agreement with the inertial solvation dynamics times previously reported for Coumarin C153 in dioxane (∼0.35–0.92 ps);37 intermediate decay times of 29 ps for CPDT, and 192 ps for C12CPDT were observed, that in agreement with the fluorescence lifetimes obtained by TCSPC (Table 1 and Fig. S2, ESI†) should be attributed to the singlet excited state deactivation lifetime; finally a long-lived transient (associated with the triplet state) was seen for both compounds. Since the kinetic traces could not be fitted within the monitoring time-window (see Fig. 3 and Fig. S3, ESI†), this time constant was fixed in the analysis to the triplet lifetime obtained by ns-TA (Table 1). The distinct rise of this latter feature (see Fig. 3 and Fig. S3, ESI†), together with the observed negative amplitude values observed in the decay associated spectra (DAS) of the 29 ps (CPDT) and 192 ps (C12CPDT) time constants in the wavelength region where the triplet–triplet absorption occurs (Fig. S5, ESI†), supports the idea that the triplet state is being formed at the expense of the singlet excited state through intersystem crossing.
| Compd | τ 1 (ps) | τ 2 (ps) | τ 3 (μs) |
|---|---|---|---|
| a This transient lifetime was fixed in the global analysis to the triplet lifetime obtained by ns-TA. | |||
| CPDT | 0.98 | 29 | 26 |
| C12CPDT | 0.22 | 192 | 64 |
For comparison, the fs-TA spectra for α2 were also obtained in aerated n-hexadecane solutions (see Fig. S6, ESI†), a solvent in which the solvation dynamics time should be absent or cannot compete with the expected excited state decay time constants. Similar spectroscopic features were found for α2 to those observed for the two cyclopentadithiophene derivatives: ESA band centered at 495 nm together with the SE band and the T1–Tn absorption band at shorter wavelengths. The fs-TA kinetic data for α2 in the 360–680 nm range were well fitted with the sum of three exponentials using a sequential model, Fig. S6 (ESI†). Again, the long-lived transient was fixed in the analysis to the triplet lifetime (27 μs, see Table 1), while the intermediary transient time, 42 ps, is in good agreement with the fluorescence lifetime, 46 ps, and thus is attributed to the oligothiophene quinoidal-type excited state decay. For the α,α′-oligothiophene trimer, α3, the shorter lifetime component observed in the fs-TA data has been attributed to the occurrence of fast conformational relaxation from the less planar Franck–Condon excited state to the relaxed quinoidal-like excited state conformation.38 Detailed analysis of the nature of this fast decay component will be the subject of a forthcoming work.
The triplet state of the cyclopentadithiophene derivatives was further characterized through the determination of the phosphorescence properties. For the cyclopentadithiophene derivatives phosphorescence was observed in frozen methylcyclohexane solution, 77 K, with broad and vibronically structured bands (Fig. 3). This contrasts with the lack of phosphorescence from α2. Indeed, with the oligothiophene series, αns, only the simplest α1 and its corresponding cyano derivative, CNα1, display phosphorescence.25,33 However, the trimer with the central thiophene replaced by a pyrrole ring also presents phosphorescence.39 Similar phosphorescence quantum yields (ϕPh = 0.004) and lifetimes (τPh = 5.5–5.9 ms) were found for the two derivatives, see Table 1. The phosphorescence spectrum of CPDT is in good agreement with that previously reported4,21 and subsequently reproduced with theoretical calculations.4 The vibronic structure of the phosphorescence spectra has been attributed to the rigid structure of the triplet state,21 in line with what was observed for the oligothiophene singlet states, in particular for α2.25 However, it is worth noticing in Fig. 3 the loss of vibronic structure in the case of the C12CPDT, which may indicate a partial departure from planarity in T1.
Singlet oxygen formation quantum yields (ϕΔ) were also obtained following photolysis of aerated methylcyclohexane solutions of the cyclopentadithiophene derivatives. The ϕΔ values were determined by plotting the initial phosphorescence intensity of singlet oxygen (at 1270 nm) as a function of the laser dose and comparing the slope with that obtained with biphenyl in cyclohexane as standard (ϕΔ = 0.73), see Fig. S7 (ESI†). From Table 1 it can be seen that although the singlet oxygen formation yield is higher for the dodecyl-substituted cyclopentaditiophene (ϕΔ = 0.47) than for the unsubstituted CPDT (ϕΔ = 0.27), these values are significantly lower than that reported for α2 in benzene solution (ϕΔ = 0.96).25 Considering that for the unsubstituted α,α′-oligothiophenes the ϕΔ values are a good estimate of the triplet formation quantum yields [displaying unitary singlet oxygen sensitization efficiency yields, SΔ = (ϕΔ/ϕT) ≈ 1],25 in the present work these can be considered as lower limits for the ϕT values. Thus, from the overall set of photophysical data presented in Table 1 the radiationless channels dominate the deactivation of the S1 in CPDT and C12CPDT.
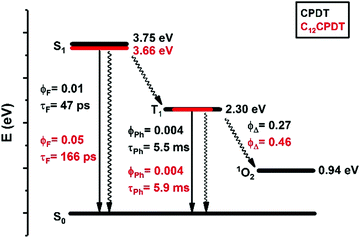
We have studied the spectral and photophysical characteristics of the fused ring CPDT as a model for the cis form of α,α′-bithiophene. In addition, we have studied the C12 derivative, where the alkyl chains increase the solubility of the corresponding copolymers containing these or similar structural units. However, we have also had the aim of investigating the potential changes relative to the parent two structures: (i) CPDT that has a rigid structure in the ground (crystal)40 and excited states and (ii) α2, that is basically rigid (quinoidal-type structure) in S1 (and T1) but that has an increased degree of freedom relative to the C–C central bond connecting the two thiophene units in the ground state. Following this, the detailed spectral and photophysical data of CPDT and C12CPDT are summarized in Scheme 3 in a Jablonski–Perrin diagram and can be further compared with that of α2. In this discussion, we will also consider results from TDFT calculations. The predicted transitions and oscillator strengths obtained from TDDFT calculations are given in Table 3.
| Absorption | Emission | |||||||
|---|---|---|---|---|---|---|---|---|
| Fluorescence | Phosphorescence | |||||||
| Compd | α2 | CPDT | C1CPDT | α2 | CPDT | C1CPDT | CPDT | C1CPDT |
| λ (nm) | 300 | 311 | 318 | 358 | 359 | 365 | 657 | 673 |
| f | 0.509 | 0.443 | 0.390 | |||||
Comparison of the experimental data in Table 1 with the calculated (from TDDFT and DFT) data in Table 3 shows that the absorption wavelength maxima (S0–S1) can be considered basically identical, with a difference of 2–3 nm. Although the predicted triplet emission is overestimated by 50 nm, this translates to just 0.15 eV, well within the expected precision of the CAMB3LYP functional.
Table 4 presents the calculated (TDDFT) bond angles and bond distances for α2, CPDT and C1CPDT. For a schematic view of the structures see Fig. S8 (ESI†).
| S0 | S1 | ||
|---|---|---|---|
| Atoms | Angle/bond distance | Atoms | Angle/bond distance |
| α2 | |||
| 1-3-6-7 | 25.5° | 1-3-6-7 | 0.2° |
| 3-6 | 146 pm | 3-6 | 137 pm |
| 2-4/3-5 | 136 pm | 2-4/3-5 | 142 pm |
| 4-5 | 142 pm | 4-5 | 139 pm |
| CPDT | |||
| 5-3-6-7 | 0.0° | 5-3-6-7 | 0.4° |
| 3-6 | 145 pm | 3-6 | 137 pm |
| 2-4/3-5 | 136 pm | 2-4/3-5 | 142 pm |
| 4-5 | 142 pm | 4-5 | 139 pm |
| C1CPDT | |||
| 5-3-6-7 | 0.0° | 5-3-6-7 | 0.3° |
| 3-6 | 145 pm | 3-6 | 137 pm |
| 2-4/3-5 | 136 pm | 2-4/3-5 | 142 pm |
| 4-5 | 142 pm | 4-5 | 139 pm |
From Fig. 1 and the data in Table 1, it can be seen that the spectral characteristics of CPDT (and C12CPDT) closely resemble those of the α-oligothiophene, α2. The absorption wavelength maximum for α225 in dioxane is 303 nm and the emission is at 362 nm (Δλ = 49 nm), which can be compared with 308 nm and 355 nm (Δλ = 47 nm) for the absorption and emission maxima, respectively, of CPDT in Table 1. This parallel between α2 and CPDT can be extended to the photophysical properties (ϕF and τF), and, in particular, the significant Stokes shift (Fig. 1), which indicates that even in the rigid CPDT, with a methylene bridge linking the two thiophene units, different geometries exist in the ground and singlet excited states.
Indeed, as with α2, in CPDT the geometry in S1 is likely to be associated with a planar quinoidal-like structure. The same is not true, however, for the geometry of the ground state, where it is evident from Table 4 that both CPDT and C12CPDT (here replaced by the dimethyl derivative, C1CPDT) have similar planar geometries in both S0 and S1, whereas for α2 this only happens in S1 since in S0 a torsional angle of ca. 25.5° is predicted for the trans α,α′-bithiophene, α2. For the ground states, with CPDT a planar structure is found in the crystal state,40 while for α2 from both experiment and different levels of calculations dihedral angles from 20° to 47° have been reported (see Introduction section).
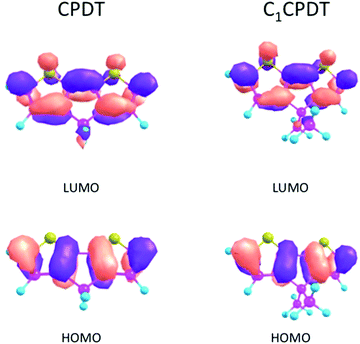
As a consequence, for CPDT and C12CPDT the marked differences between the GS (S0) and ES (S1) states must be found not in the change in their dihedral angles (identical planar structures in both states), but in the change in their bond distances/lengths. This is confirmed in Table 4, where the bond angles and lengths of CPDT and C1CPDT are identical in the GS, but there is a decrease in the length of the central C3–C6 bond (connecting the two thiophene units) from 146–145 pm (S0) to 137 pm (S1) with all three compounds. This indicates a clear change in geometry for all three compounds upon excitation, which explains the huge Stokes shift observed. In previous studies, the large Stokes shifts observed for N-carbazole end-capped oligo-thiophene-phenylenes and planar polyenes, were attributed to bond length reorganization between the ground- and excited-states.41,42 In the present case the decrease in the C4–C5 bond lengths (142 pm in S0 and 139 pm in S1) and the increase in C2-4/C3-5 (136 pm in S0 and 142 pm in S1) also imply a more delocalized nature of the π-electrons in S1 in contrast with a more localized one in S0, which is compatible with the suggested quinoidal-like structure in S1. This can be visualized using the density plots of the HOMO and LUMO orbitals for CPDT and C1CPDT in Fig. 4.
The complete behavior of CPDT and C12CPDT can now be fully understood with the help of the fs-TA data. The tri-exponential analysis of the transient profiles indicates an identical number of species. The longest lifetime in CPDT is clearly associated with the decay of the triplet state, and is in agreement with previous results for this compound.21 Although there are slight differences for the two compounds, they are in the same time range. The intermediate transient lifetimes 29 ps and 192 ps are, from comparison with the fluorescence lifetimes (Tables 1 and 2), associated with the decay of the relaxed S1 state, whereas the initial fast decays can be associated with the solvation dynamics.
It is worth noting the significant increase in the fluorescence lifetime observed going from CPDT, 47 ps, to the C12CPDT derivative, 166 ps. This is mirrored by the increase in the ϕF values, CPDT, ϕF = 0.01, C12CPDT, ϕF = 0.05, and the concomitant decrease in the non-radiative excited state decay processes (kNR = 21.1 ns−1, CPDT, vs. kNR = 5.7 ns−1 for C12CPDT). This can be explained by the overall increase in structural rigidity of the CPDT chromophore induced by the introduction of the alkyl substituents that reduces the excited state radiationless energy losses due to decreased interactions with the solvent molecules. This is also mirrored in the initial fast decay transient value in Table 2, which is reduced from 0.98 ps to 0.22 ps from CPDT to C12CPDT.
In summary, the excited state dynamics of the compounds investigated can be described as follows: upon photoexcitation the initially formed excited state (Franck–Condon state) undergoes fast solvent reorientation to a relaxed excited singlet state, which leads to the formation of the long-lived triplet excited state, and its subsequent decay to the ground state, as the main deactivation pathway in these compounds.
Conclusions
A comprehensive photophysical investigation was carried out of the cis conformer of α,α′-bithiophene (α2) in solution using the fused ring derivative CPDT, and its alkylderivative, C12CPDT. A change from 145 pm (S0) to 137 pm (S1) in the central C–C bond connecting the two thiophene units is responsible for the observed pronounced Stokes shift. In the case of α2 an additional departure from planarity in S0 (with a dihedral angle 25.5°) also accompanies this Stokes shift. The spectral and photophysical properties of the cis (CPDT) conformer parallel those of the trans conformer of α2; in particular nonradiative decay is the main channel responsible for the deactivation of the S1 state. The overall results also show that, except for differences in the phosphorescence behavior, the cis (CPDT) keeps the spectral and photophysical characteristics of the trans α2.Conflicts of interest
There are no conflicts to declare.Acknowledgements
We acknowledge funding by FEDER (Fundo Europeu de Desenvolvimento Regional) through COMPETE (Programa Operacional Factores de Competitividade). The Coimbra Chemistry Centre is supported by the Fundação para a Ciência e a Tecnologia (FCT), Portuguese Agency for Scientific Research, through the programme UID/QUI/UI0313/2013. CQE is also supported by FCT through the project UID/QUI/00100/2013. This work was performed under the project “SunStorage – Harvesting and storage of solar energy”, with reference POCI-01-0145-FEDER-016387, funded by the European Regional Development Fund (ERDF), through COMPETE 2020 – Operational Programme for Competitiveness and Internationalisation (OPCI), and by national funds, through FCT. The FCT is also acknowledged for a post-doctoral grant to J. Pina (ref. SFRH/BPD/108469/2015). The research leading to these results has received funding from Laserlab-Europe (grant agreement no. 284464, EC's Seventh Framework Programme). We also acknowledge MSc Catarina Pinto (UC) for the help with the purification of C12CPDT by HPLC-DAD.References
- C. W. Tang and S. A. Vanslyke, Appl. Phys. Lett., 1987, 51, 913–915 CrossRef CAS.
- C. W. Tang, S. A. Vanslyke and C. H. Chen, J. Appl. Phys., 1989, 65, 3610–3616 CrossRef CAS.
- J. S. Seixas de Melo, H. D. Burrows and J. Pina, in Photochemistry, ed. E. Fasani and A. Albini, The Royal Society of Chemistry, 2016, vol. 43, pp. 83–102 10.1039/9781782622772-00083.
- M. Andrzejak, D. W. Szczepanik and L. Orzel, Phys. Chem. Chem. Phys., 2015, 17, 5328–5337 RSC.
- G. Cinacchi, J. Phys. Chem. A, 2010, 114, 8114–8118 CrossRef CAS PubMed.
- A. M. Fedor, D. G. Allis and T. M. Korter, Vib. Spectrosc., 2009, 49, 124–132 CrossRef CAS.
- W. J. D. Beenken, Chem. Phys., 2008, 349, 250–255 CrossRef CAS.
- M. C. Ruiz Delgado, F. J. Ramírez, V. Hernández, J. Casado, F. Enríquez and J. T. López Navarrete, J. Mol. Struct., 2005, 744–747, 393–401 CrossRef CAS.
- G. Raos, A. Famulari, S. V. Meille, M. C. Gallazzi and G. Allegra, J. Phys. Chem. A, 2004, 108, 691–698 CrossRef CAS.
- G. Raos, A. Famulari and V. Marcon, Chem. Phys. Lett., 2003, 379, 364–372 CrossRef CAS.
- M. Belletête, N. Di Césare, M. Leclerc and G. Durocher, Chem. Phys. Lett., 1996, 250, 31–39 CrossRef.
- E. Orti, P. M. Viruela, J. Sanchezmarin and F. Tomas, J. Phys. Chem., 1995, 99, 4955–4963 CrossRef CAS.
- J. E. Chadwick and B. E. Kohler, J. Phys. Chem., 1994, 98, 3631–3637 CrossRef CAS.
- Y. Kimura, Y. Katano, S. Tanaka, T. Yoshinari, H. Itoh, Y. Kuriyama and S. Nagasaka, Synth. Met., 2010, 160, 1131–1135 CrossRef CAS.
- B. Gombojav, T. Yoshinari, H. Itoh, S. Nagasaka, Y. Kuriyama and K. Koyama, J. Phys. Soc. Jpn., 2004, 73, 3166–3170 CrossRef CAS.
- J. L. Houben, R. Cimiraglia, A. Carpita and M. Ciofalo, J. Mol. Liq., 1994, 61, 189–207 CrossRef CAS.
- V. Hernandez and J. T. L. Navarrete, J. Chem. Phys., 1994, 101, 1369–1377 CrossRef CAS.
- R. Siebert, D. Akimov, M. Schmitt, A. Winter, U. S. Schubert, B. Dietzek and J. Popp, ChemPhysChem, 2009, 10, 910–919 CrossRef CAS PubMed.
- R. E. Di Paolo, J. Seixas de Melo, J. Pina, H. D. Burrows, J. Morgado and A. L. Maçanita, ChemPhysChem, 2007, 8, 2657–2664 CrossRef CAS PubMed.
- J. Pina, J. S. Seixas de Melo, N. Koenen and U. Scherf, J. Phys. Chem. B, 2013, 117, 7370–7380 CrossRef CAS PubMed.
- M. Fujitsuka, T. Sato, F. Sezaki, K. Tanaka, A. Watanabe and O. Ito, J. Chem. Soc., Faraday Trans., 1998, 94, 3331–3337 RSC.
- U. Asawapirom and U. Scherf, Macromol. Rapid Commun., 2001, 22, 746–749 CrossRef CAS.
- R. C. Coffin, J. Peet, J. Rogers and G. C. Bazan, Nat. Chem., 2009, 1, 657–661 CrossRef CAS PubMed.
- S. Ko, R. Mondal, C. Risko, J. K. Lee, S. Hong, M. D. McGehee, J.-L. Brédas and Z. Bao, Macromolecules, 2010, 43, 6685–6698 CrossRef CAS.
- R. S. Becker, J. Seixas de Melo, A. L. Maçanita and F. Elisei, J. Phys. Chem., 1996, 100, 18683–18695 CrossRef CAS.
- M. Montalti, A. Credi, L. Prodi and M. Gandolfi, Handbook of Photochemistry, CRC Presss and Taylor & Francis, Boca Raton, 3rd edn, 2006 Search PubMed.
- J. Pina, J. Seixas de Melo, H. D. Burrows, A. L. Macanita, F. Galbrecht, T. Bunnagel and U. Scherf, Macromolecules, 2009, 42, 1710–1719 CrossRef CAS.
- G. Striker, V. Subramaniam, C. A. M. Seidel and A. Volkmer, J. Phys. Chem. B, 1999, 103, 8612–8617 CrossRef CAS.
- J. J. Snellenburg, S. Laptenok, R. Seger, K. M. Mullen and I. H. M. van Stokkum, J. Stat. Softw., 2012, 49, 22 Search PubMed.
- M. W. Schmidt, K. K. Baldridge, J. A. Boatz, S. T. Elbert, M. S. Gordon, J. H. Jensen, S. Koseki, N. Matsunaga, K. A. Nguyen, S. Su, T. L. Windus, M. Dupuis and J. A. Montgomery, J. Comput. Chem., 1993, 14, 1347–1363 CrossRef CAS.
- T. Yanai, D. P. Tew and N. C. Handy, Chem. Phys. Lett., 2004, 393, 51–57 CrossRef CAS.
- J. Pina, D. Sarmento, M. Accoto, P. L. Gentili, L. Vaccaro, A. Galvão and J. S. Seixas de Melo, J. Phys. Chem. B, 2017, 121, 2308–2318 CrossRef CAS PubMed.
- J. Pina, H. D. Burrows, R. S. Becker, F. B. Dias, A. L. Maçanita and J. Seixas de Melo, J. Phys. Chem. B, 2006, 110, 6499–6505 CrossRef CAS PubMed.
- J. Seixas de Melo, L. M. Silva and M. Kuroda, J. Chem. Phys., 2001, 115, 5625–5636 CrossRef CAS.
- R. S. Becker, J. Seixas de Melo, A. L. Maçanita and F. Elisei, Pure Appl. Chem., 1995, 67, 9 CrossRef CAS.
- J. Seixas de Melo, H. D. Burrows, M. Svensson, M. R. Andersson and A. P. Monkman, J. Chem. Phys., 2003, 118, 1550–1556 CrossRef CAS.
- M. L. Horng, J. A. Gardecki, A. Papazyan and M. Maroncelli, J. Phys. Chem., 1995, 99, 17311–17337 CrossRef CAS.
- J. P. Yang, W. Paa and S. Rentsch, Chem. Phys. Lett., 2000, 320, 665–672 CrossRef CAS.
- J. Seixas de Melo, F. Elisei and R. S. Becker, J. Chem. Phys., 2002, 117, 4428–4435 CrossRef CAS.
- P. B. Koster, F. van Bolhuis and G. J. Visser, Acta Crystallogr., Sect. B: Struct. Sci., 1970, 26, 1932–1939 CrossRef CAS.
- A. Hlel, A. Mabrouk, M. Chemek, I. Ben Khalifa and K. Alimi, Computational Condensed Matter, 2015, 3, 30–40 CrossRef.
- F. Blomgren and S. Larsson, Theor. Chem. Acc., 2003, 110, 165–169 CrossRef CAS.
Footnote |
| † Electronic supplementary information (ESI) available. See DOI: 10.1039/c7qm00440k |
| This journal is © the Partner Organisations 2018 |

