DOI:
10.1039/C8QM00221E
(Research Article)
Mater. Chem. Front., 2018,
2, 1664-1673
Phase-controlled synthesis of bismuth oxide polymorphs for photocatalytic applications†
Received
9th May 2018
, Accepted 29th June 2018
First published on 9th July 2018
Abstract
In this study, bismuth oxide polymorphs (α and β phases) were synthesized using a post-calcination method using Bi2O2CO3 nanoflakes as an intermediate. These samples were characterized by various spectroscopic techniques such as powder X-ray diffraction, Fourier transform infrared spectroscopy, Raman spectroscopy, UV-visible absorption, photoluminescence studies and microscopic analysis (scanning and transmission electron microscopy). The mechanism of the formation of β-Bi2O3 nanoparticles and the α-Bi2O3 coral-like morphology has been proposed. Furthermore, the photocatalytic performance of the bismuth oxide polymorphs was investigated via the degradation of organic dyes (rhodamine B, methylene blue, acid orange 7 and methyl orange) under simulated solar illumination. The results show that the β-Bi2O3 nanoparticles possess superior photocatalytic activity compared to the α-Bi2O3 coral-like morphology for the degradation of these dyes due to a higher photon adsorption (band gap of 2.2 eV for β-Bi2O3 and 2.56 eV for α-Bi2O3). However, the photocatalytic activity of these bismuth oxide polymorphs for the degradation of organic dyes followed the order of Rh B > AO 7 > MB > MO under identical experimental conditions. A plausible mechanism has been proposed for the photocatalytic activity.
Introduction
Over the past few decades, semiconductors (e.g., TiO2, ZnO, Fe2O3, WO3, SnO2, CdS and ZnS) have been studied as photocatalytic materials for energy and environmental applications.1–4 Because these materials have appropriate electronic band structures (absorption edges), they are found to be useful for the conversion of solar energy into clean energy (hydrogen production from water splitting) and degradation of pollutants (dyes, pesticides, pharmaceutical products and gaseous toxins) under light irradiation.5–8 Often, TiO2 is used as a remarkable photocatalyst for energy conversion and environmental remediation due to cost effectiveness, non-toxicity and chemical stability.9,10 However, TiO2 polymorphic phases (anatase, rutile or brookite) possess wide band gaps (≤3–3.2 eV), a disadvantage for utilizing natural sunlight or household indoor illumination (only 4% of UV light).11–13 Doping or combination with other semiconductors has been found to improve the visible light activity of TiO2.11,14,15 Meanwhile, several other materials have been reported as efficient photocatalysts for the degradation of environmental contaminants under natural sunlight/visible-light.16–23 Among them, bismuth containing materials with narrow band gap and positive conduction band potential have shown higher photocatalytic efficiency.13,19–24 Bismuth oxide (Bi2O3) is found to be a good photocatalyst and a good photoanode in a dye sensitized solar cell attributed to a wide band gap of 2.0 to 3.96 eV.10,25–35 Also, it possesses thermoelectric, ferroelectric and multiferroic functionality.36,37 Also, the photoluminescence and photoconductivity properties are useful in optoelectronic devices.37 Bi2O3 has been employed for various applications, for example as a solid support catalyst38,39 in sensors,40,41 and as an anode material in lithium-ion batteries,42 supercapacitors43 and solid oxide fuel cells.44 Bi2O3 has seven polymorph structures, namely: α (monoclinic), β (tetragonal), γ (body-centered cubic), δ (face-centered cubic), ε (orthorhombic), ω (triclinic) and hexagonal phase.45 However, the stable (α) and metastable phases (β and γ) exhibit remarkable photocatalytic properties for environmental remediation under visible-light. Various studies report on the synthesis of Bi2O3: oxidative metal vapour transport deposition,46 hydrothermal synthesis,47 microwave-assisted method,48 precursor-induced (based) synthesis,10,25,26,49,50 gel combustion method35 and other methods.51–53 Among these, precursor based synthesis is a more appropriate method for achieving Bi2O3 polymorphs, due to phase control by calcination temperature.10,54,55 Different Bi2O3 polymorphs were accomplished by using Bi2O2CO3 and bismuth oxalate as precursors.10,25,26,49,50,56 Until now, very few reports are available for synthesizing α and β- Bi2O3 polymorphs using Bi2O2CO3 as a precursor. In this study, we synthesized β-Bi2O3 (tetragonal) and α-Bi2O3 (monoclinic) polymorphs by post-calcination method using Bi2O2CO3 nanoflakes as a novel precursor. Bi2O2CO3 nanoflakes obtained by a modified experimental procedure showed good efficiency towards the degradation of organic dyes.57
Experimental
Materials
All chemicals were of analytical grades and used without further purification. Bismuth(III) nitrate pentahydrate (ACS reagent, 98%), urea (AR Grade, 99%), ethylene glycol (≥99%), rhodamine B (Rh B; 95%), methylene blue (MB), acid orange 7 (AO7: 85%), methyl orange (MO; 85%) and terephthalic acid were purchased from Sigma-Aldrich.
Synthesis of bismuth oxide polymorphs (α and β phases)
A typical synthetic procedure involved the dissolution of 4.85 g of bismuth(III) nitrate pentahydrate in 43 mL of ethylene glycol which was then mixed with 33 mL of urea solution (6.05 mol dm−3) in a 100 mL beaker. Then, the reaction mixture was kept at 110 °C for 18 hours in a vacuum oven. After the completion of the reaction, the white powder (Bi2O2CO3) was collected and washed with distilled water several times and then dried at 80 °C for 4 hours. The white powder was then heated at 350 °C and 400 °C for 2 hours in air at the heating rate of 10 °C to obtain β-Bi2O3 (as bright yellow color) and α-Bi2O3 (as straw yellow color) powders, respectively.
Characterization
The crystal structures and phase identification of the as-synthesized samples were determined by powder X-ray diffraction (XRD) using a Rigaku D/max-2500 diffractometer with a Ni-filtered Cu Kα radiation source (40 kV, 30 mA, λ = 1.5406 Å). The microstructural characteristic bands were recorded using a Fourier transform infrared (FTIR) spectrometer on a KBr pellet with a Nicolet iS50. Laser-Raman spectra of the samples were measured by a SENTERRA Raman microscope. The thermogravimetric analysis (TGA) of Bi2O2CO3 nanoflake decomposition was performed by a model Mettle-Toledo 851e and 822e in the temperature range of 100–600 °C (10 °C min−1) under a dynamic air atmosphere. The morphological features of these samples were investigated with a field emission scanning electron microscope (FESEM model JEOL, JSM-6700F) and transmission electron microscope (TEM model FEI Tecnai G2 F20). The elemental composition of these samples was determined by energy dispersive X-ray spectroscopy (EDS, Oxford Inc.). The surface potential (zeta potential) analysis was performed by using a Zetasizer Nano Zs/ZEN3600, Malvern instrument. UV-visible absorption spectra (diffuse reflectance mode; DRS) of these samples were recorded on an ultraviolet-visible (UV-vis) spectrophotometer (T90+, PG instruments, UK) with an integrating sphere using BaSO4 as a standard. The photoluminescence (PL) spectra of the samples were performed by using the Shimadzu (RF5301PC) spectrofluorometer at an excitation wavelength of 325 nm under ambient conditions. The time resolved PL experiments were performed by pulse laser using a NanoLED, Horiba Scientific Fluoromax 4CP spectrophotometer at a 1 MHz repetition rate with a band pass of 2 nm. The arrival time of photon counts was set as 200 ns and the emission decay was measured. The lifetime was calculated by fitting the data using DAS (data analysis software).
Photoelectrochemical measurements
The electrochemical measurements were performed in a three electrode electrochemical cell consisting of a working electrode, a Pt wire counter electrode and an Ag/AgCl/NaCl (3 mol L−1) reference electrode. A pH 12 NaOH solution containing 0.1 mol L−1 KNO3 was used as the electrolyte. The working electrodes were prepared by using a spray coating technique. For this purpose, 500 μL of 2-propanol solutions containing 20 g L−1 of bismuth oxide samples (α and β-Bi2O3) was sprayed on top of fluoride-doped tin oxide (FTO) conductive glasses heated to 50 °C. The solution was forced through the nozzle at a flow speed of 500 μL s−1 using pressurized air at 2.5 bar. A solar simulator (LOT-Quantum Design GmbH) with a 300 W Xe lamp and an AM 1.5-global filter was employed as the light source. The open circuit potential (OCP) was measured at various light intensities by changing the output power of the Xenon lamp. Furthermore, the photocurrent performances were studied with an AUTOLAB12/FRA2 in a two-electrode system; as-synthesized samples were coated on FTO as a working electrode and platinum (Pt) was used as the counter as well as a reference electrode with polymer gel being used as a solid electrolyte under a xenon illumination source (150 W with standard 85 mW cm−2).
Evaluation of photocatalytic activity
The photocatalytic activities of the bismuth oxide samples (α and β-Bi2O3) were investigated via the degradation of organic dyes (Rh B, MB, AO7 and MO) in aqueous solutions. The experiments were performed under simulated solar illumination (150 W Tungsten halogen lamp) at natural pH under ambient atmospheric conditions as follows: 50 mg of sample was dispersed in a 125 mL borosilicate glass bottle which contained 100 mL of organic dye solution (5 × 10⁻⁵ mol L−1). Prior to illumination, the suspension was magnetically stirred in the dark for 30 min to achieve adsorption/desorption equilibrium between the sample and organic dye molecules. During illumination, 4 mL of solution was collected at regular time intervals from the suspension mixtures and the photocatalyst was filtered by using a PVDF syringe filter (0.45 μm). The photocatalytic activity (degradation efficiency) of the bismuth oxide samples was calculated by measuring the concentration of organic dyes as a function of irradiation time using a UV-visible spectrophotometer. Then, the photocatalytic degradation rate constants (k) were calculated using the first-order rate equation (−ln(C/C0) = kt).
Hydroxyl radical analysis
The detection of hydroxyl radicals during the photocatalytic process was carried out using a photoluminescence technique. For this experiment, 0.1 g of sample (β-Bi2O3) was dispersed in 100 mL of 5 × 10⁻⁴ M terephthalic acid in basic solution (2 × 10⁻³ M of NaOH). Before irradiation, the mixture was magnetically stirred in the dark for 60 minutes and then exposed to solar illumination. At regular time intervals, 5 mL of solution was taken from the mixture and the catalyst was filtered using a PVDF syringe filter (0.45 μm). Then, the PL intensity of filtrate solution was measured using a fluorescence spectrophotometer at an excitation wavelength of 315 nm.
Results and discussion
Formation of α and β bismuth oxide
The formation of Bi2O2CO3 nanoflakes is shown in Scheme 1. The formation of Bi2O2CO3 nanocrystals is shown in reactions (1)–(4).| | | Bi(NO3)3·5H2O + OHCH2CH2OH → Bi(OCH2CH2OH)3 + 5 H2O + 3HNO3 | (1) |
| | | CO(NH2)2 + H2O → 2NH3 + CO2 | (2) |
| | | NH3 + H2O → NH4+ + OH− | (3) |
| | | 2Bi(OCH2CH2OH)3 + CO2+ 12OH− → Bi2O2CO3 + 6(HOCH2CH2OH) + 3H2O + 3O2 | (4) |
The crystal structure and phase purity of the as-synthesized intermediate Bi2O2CO3 were examined by powder X-ray diffraction analysis. All diffraction lines can be indexed to the tetragonal phase with unit cell lattice parameters: a = 3.89 Å and c = 13.63 Å for Bi2O2CO3, which are in good agreement with standard JCPDS card no. 41-1888 (Fig. 1a). Although, the sharp lines at 30.2 (2θ) for (013) indicate that the as-synthesized sample is a single crystal with a crystalline size of about 32 nm. The FTIR spectrum (Fig. 1b) of the Bi2O2CO3 sample shows the symmetric vibrations (ν1) at 1066 cm−1 with a shoulder band at 1460 cm−1 and a sharp band at 1388 cm−1 for anti-symmetric vibration (ν3) of carbonate ions (CO32−). Moreover, the outer-bending (ν2) and inner-plane deformation (ν4) for carbonate ions were at 845 cm−1 and 690 cm−1, respectively. Furthermore, the symmetric vibrations (ν1) and inner-plane deformation (ν4) of carbonate ions are combined vibration bands (ν1 + ν4) observed at 1754 cm−1 and 1734 cm−1, respectively.57–59 However, additional bands at 2424 cm−1 for carbonate ions and 3396 cm−1 for O–H groups of water molecules are also observed on the Bi2O2CO3 surface.13,57 Besides, the Raman bands at 1064 cm−1, 1358 cm−1 and 664 cm−1 for carbonate ion vibrations (ν1, ν3 and ν4) were observed (Fig. 1c), whereas the stretching vibration band at 508 cm−1 for Bi![[double bond, length as m-dash]](https://www.rsc.org/images/entities/char_e001.gif) O with additional bands at 160 cm−1 and 360 cm−1 are attributed to external vibrations during Raman analysis of the Bi2O2CO3 sample.59 The surface morphology of the as-synthesized Bi2O2CO3 sample was studied via FESEM. As shown in Fig. 1d, the FESEM image for the as-synthesized sample had a flake like morphology with a uniform size of about 100–200 nm and tiny thickness of several nanometer length. However, the Bi2O2CO3 morphology of the nanoflakes is quite different from that of Bi2O2CO3 nanoplatelets due to the initial concentrations of bismuth nitrate pentahydrate and concerned reaction conditions.58 Thus, the as-synthesized sample indicates Bi2O2CO3 nanoflakes as a surface morphology. Furthermore, the EDS analysis of the Bi2O2CO3 nanoflakes found the presence of Bi, C, and O elements (Fig. S1. ESI†). So, it could clearly indicate that the Bi2O2CO3 nanoflakes are highly pure. The TGA analysis clearly shows that the Bi2O2CO3 nanoflakes decompose in the temperature range of 300–400 °C to generate Bi2O3 (Fig. 2). The calculated mass loss ≤9% is almost close to the theoretical value of ∼8.9% when Bi2O2CO3 nanoflakes are converted to Bi2O3 during decomposition. Hence, the Bi2O2CO3 nanoflakes were calcined at 350 °C and 400 °C for 2 h to obtain β and α-Bi2O3, respectively.
O with additional bands at 160 cm−1 and 360 cm−1 are attributed to external vibrations during Raman analysis of the Bi2O2CO3 sample.59 The surface morphology of the as-synthesized Bi2O2CO3 sample was studied via FESEM. As shown in Fig. 1d, the FESEM image for the as-synthesized sample had a flake like morphology with a uniform size of about 100–200 nm and tiny thickness of several nanometer length. However, the Bi2O2CO3 morphology of the nanoflakes is quite different from that of Bi2O2CO3 nanoplatelets due to the initial concentrations of bismuth nitrate pentahydrate and concerned reaction conditions.58 Thus, the as-synthesized sample indicates Bi2O2CO3 nanoflakes as a surface morphology. Furthermore, the EDS analysis of the Bi2O2CO3 nanoflakes found the presence of Bi, C, and O elements (Fig. S1. ESI†). So, it could clearly indicate that the Bi2O2CO3 nanoflakes are highly pure. The TGA analysis clearly shows that the Bi2O2CO3 nanoflakes decompose in the temperature range of 300–400 °C to generate Bi2O3 (Fig. 2). The calculated mass loss ≤9% is almost close to the theoretical value of ∼8.9% when Bi2O2CO3 nanoflakes are converted to Bi2O3 during decomposition. Hence, the Bi2O2CO3 nanoflakes were calcined at 350 °C and 400 °C for 2 h to obtain β and α-Bi2O3, respectively.
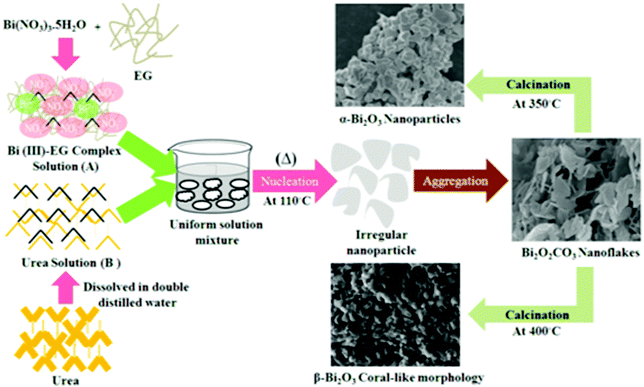 |
| | Scheme 1 Schematic illustration of Bi2O2CO3 nanoflakes and the formation of Bi2O3 polymorphs. | |
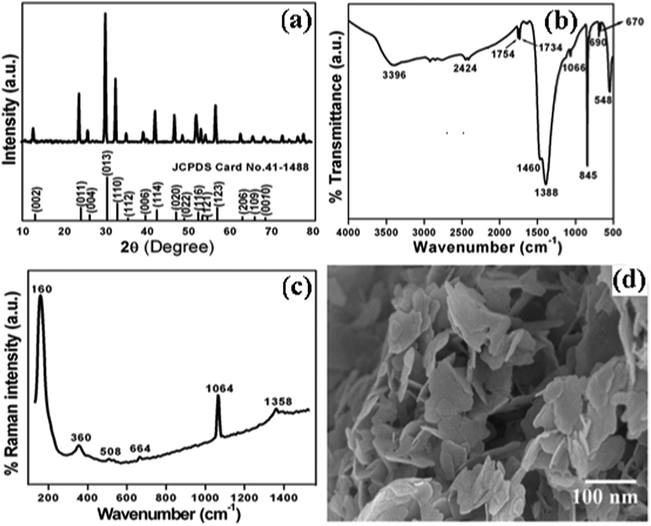 |
| | Fig. 1 (a) Powder XRD pattern, (b) FTIR spectrum, (c) Raman spectrum and (d) FESEM image of Bi2O2CO3. | |
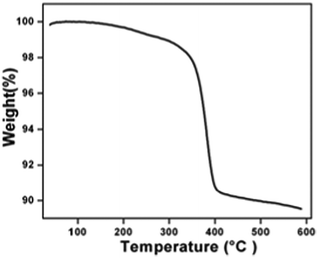 |
| | Fig. 2 TGA results of Bi2O2CO3. | |
Spectroscopic studies of α and β bismuth oxide
The crystallographic phases and polymorphic structures of the as-synthesized Bi2O3 samples were investigated by X-ray diffraction analysis (Fig. 3). The Bi2O2CO3 nanoflakes calcined at 350 °C for 2 h displayed the diffraction lines of (210), (201), (211), (002), (220), (212), (222), (400), (411), (203), (421), (402), (440), (610) and (224) planes at 2θ = 25.7°, 27.9°, 30.3°, 31.7°, 32.7°, 41.3°, 46.2°, 46.9°, 51.3°, 54.2°, 55.5°, 57.7°, 68.5, 74.5° and 75.9°, which can be indexed to a tetragonal phase of β-Bi2O3 with space group P![[4 with combining macron]](https://www.rsc.org/images/entities/char_0034_0304.gif) 21c corresponding to JCPDS card no. 27-0050. While the Bi2O2CO3 nanoflake sample calcined at 400 °C exhibits diffraction lines of (102), (002), (120), (012), (200), (212), (112), (222), (122), (041), (104), (321), (241), (314), (232), (252) and (161) plane at 2θ = 25.6°, 26.8°, 27.3°, 27.9°, 33.1°, 34.9°, 37.5°, 39.9°, 42.2°, 46.2°, 48.5°, 52.2°, 54.6°, 57.7°, 62.3°, 66.7° and 74.3°, which are in good agreement with JCPDS card no. 41-1449 for α-Bi2O3 as a monoclinic phase with space group P21/c. The calculated crystalline size and unit cell lattice parameters of these samples are provided in Table ST1 (ESI†). The crystalline size of α-Bi2O3 changed when compared with β-Bi2O3 due to a phase transition during calcination at high temperature (400 °C). The FTIR spectrum of the β-Bi2O3 and α-Bi2O3 samples is shown in Fig. 4a. Crystalline water molecules are chemisorbed and/or physisorbed on both the samples which show weak vibration bands at 3434–3442 cm−1 and 1640 cm−1.60 Anti-symmetric vibration (ν3) and inner-plane deformation (ν4) for carbonate ions are present in these samples at 1388 cm−1 with 850 cm−1 and 636 cm−1, respectively. Thus, the synthesized β and α-Bi2O3 samples have water molecules and carbonate ions present on the surface during phase transformation from Bi2O2CO3 nanoflakes. A similar observation was reported in a previous study.10 Moreover, the phase lucidity of the as-synthesized Bi2O3 polymorphs was further confirmed by Raman analysis (Fig. 4b). The vibrational bands at 90, 128, 148, 160, 232, 314 and 466 cm−1 for the β-Bi2O3 sample are attributed to a tetragonal phase. Similarly, the vibrational bands at 84, 92, 102, 120, 138, 152, 182, 210, 282, 314, 412, 448 and 530 cm−1 for α-Bi2O3 possess a monoclinic phase with space group P21/c.37,61 Among them, the band at 120 cm−1 could be ascribed to the bismuth vibrational mode and Bi–O scattering at 138 and 152 cm−1 for α-Bi2O3, whereas all others bands are attributed to anharmonicity of the oxygen vibrational mode observed in α-Bi2O3 during Raman analysis.37 Hence, the as-synthesized samples exhibit a highly crystalline Bi2O3 polymorph phase (β and α-Bi2O3).
21c corresponding to JCPDS card no. 27-0050. While the Bi2O2CO3 nanoflake sample calcined at 400 °C exhibits diffraction lines of (102), (002), (120), (012), (200), (212), (112), (222), (122), (041), (104), (321), (241), (314), (232), (252) and (161) plane at 2θ = 25.6°, 26.8°, 27.3°, 27.9°, 33.1°, 34.9°, 37.5°, 39.9°, 42.2°, 46.2°, 48.5°, 52.2°, 54.6°, 57.7°, 62.3°, 66.7° and 74.3°, which are in good agreement with JCPDS card no. 41-1449 for α-Bi2O3 as a monoclinic phase with space group P21/c. The calculated crystalline size and unit cell lattice parameters of these samples are provided in Table ST1 (ESI†). The crystalline size of α-Bi2O3 changed when compared with β-Bi2O3 due to a phase transition during calcination at high temperature (400 °C). The FTIR spectrum of the β-Bi2O3 and α-Bi2O3 samples is shown in Fig. 4a. Crystalline water molecules are chemisorbed and/or physisorbed on both the samples which show weak vibration bands at 3434–3442 cm−1 and 1640 cm−1.60 Anti-symmetric vibration (ν3) and inner-plane deformation (ν4) for carbonate ions are present in these samples at 1388 cm−1 with 850 cm−1 and 636 cm−1, respectively. Thus, the synthesized β and α-Bi2O3 samples have water molecules and carbonate ions present on the surface during phase transformation from Bi2O2CO3 nanoflakes. A similar observation was reported in a previous study.10 Moreover, the phase lucidity of the as-synthesized Bi2O3 polymorphs was further confirmed by Raman analysis (Fig. 4b). The vibrational bands at 90, 128, 148, 160, 232, 314 and 466 cm−1 for the β-Bi2O3 sample are attributed to a tetragonal phase. Similarly, the vibrational bands at 84, 92, 102, 120, 138, 152, 182, 210, 282, 314, 412, 448 and 530 cm−1 for α-Bi2O3 possess a monoclinic phase with space group P21/c.37,61 Among them, the band at 120 cm−1 could be ascribed to the bismuth vibrational mode and Bi–O scattering at 138 and 152 cm−1 for α-Bi2O3, whereas all others bands are attributed to anharmonicity of the oxygen vibrational mode observed in α-Bi2O3 during Raman analysis.37 Hence, the as-synthesized samples exhibit a highly crystalline Bi2O3 polymorph phase (β and α-Bi2O3).
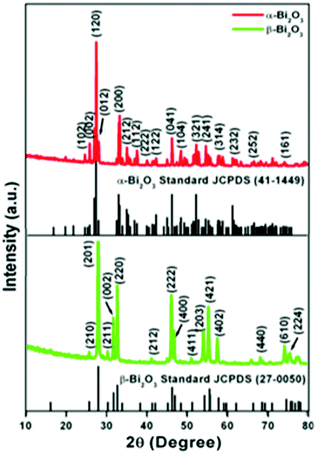 |
| | Fig. 3 Powder XRD patterns of Bi2O3 samples. | |
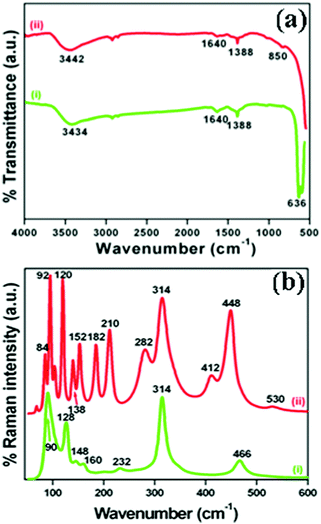 |
| | Fig. 4 (a) FTIR spectrum and (b) Raman spectrum of (i) β-Bi2O3 and (ii) α-Bi2O3 samples. | |
Microscopic studies of α and β bismuth oxide
The surface morphology of the as-synthesized bismuth oxide polymorphs was characterized by FESEM and TEM. Fig. 5a and c show the morphologies of β and α-Bi2O3 samples in low magnification FESEM images, respectively. At a higher magnification, the image of β-Bi2O3 shows an irregular size in the range of 200–300 nm length (Fig. 5b), whereas α-Bi2O3 exhibits a coral-like morphology with a length of several micrometers (Fig. 5d). The changes in crystalline size, shape and morphology of the Bi2O3 polymorphs during the calcinations may proceed via an Ostwald ripening process.10,23
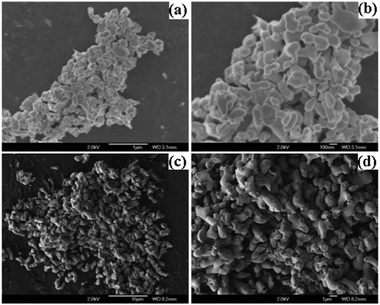 |
| | Fig. 5 (a and b) TEM low and high magnification FESEM images of β-Bi2O3 and (c and d) α-Bi2O3 samples. | |
EDS analysis of β-Bi2O3 shows the presence of Bi and O elements only, which confirms the formation of pure Bi2O3 during calcination (Fig. S2, ESI†). TEM images are also consistent with β-Bi2O3 as a nanoparticle and α-Bi2O3 shows a coral-like morphology (Fig. 6a and b). HRTEM images with corresponding FFT (inset) for β and α-Bi2O3 reveal that the samples are well crystalline in nature (Fig. 6c and d). The β-Bi2O3 nanoparticle has a lattice fringe of d = 0.295 nm for the (211) plane as a tetragonal phase (Fig. 6c), whereas α-Bi2O3 has a lattice fringe of d = 0.332 nm, ascribed to the (111) plane for the monoclinic phase (Fig. 6d).10 Then, the surface potential of the as-synthesized Bi2O3 samples was studied by using a zeta (ζ) potential analyzer. As shown in Fig. S3 (ESI†), the β-Bi2O3 and α-Bi2O3 particles show negative potentials of −13.1 and −12.3 mV in a natural solution (pH = 7), respectively.
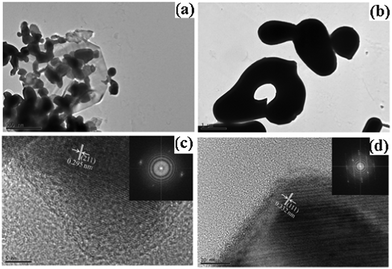 |
| | Fig. 6 (a and b) TEM images and (c and d) HRTEM images of β-Bi2O3 and α-Bi2O3, respectively (inset corresponding FFT). | |
Optical properties of α and β bismuth oxide
The optical absorption characteristics of the as-synthesized Bi2O3 samples were studied by using a UV-vis spectrophotometer (DRS). The absorption spectra are given in Fig. 7a, and the β-Bi2O3 nanoparticles (green line) show a strong absorption in the visible light region when compared to α-Bi2O3 (red line). The optical band gaps (indirect) of these samples were calculated using eqn (5) (inset Fig. 7a),| |  | (5) |
where α is the absorption coefficient, C is a constant, hν is the photon energy and Ebulkg is the band gap. The indirect band gaps were found to be 2.2 eV for β-Bi2O3 and 2.56 eV for α-Bi2O3. However, the indirect band gap of α-Bi2O3 has increased when compared with β-Bi2O3 due to reduced crystalline size and change in polymorphic phase (tetragonal into monoclinic). The EVB and ECB positions of the as-synthesized Bi2O3 samples can be calculated by using eqn (6) and (7) and the results are given in Table ST2 (ESI†) (where X is the absolute electronegativity of Bi2O3 which is 6.23 eV and Ee is the energy of free electrons on the hydrogen scale which is about 4.5 eV).The insights of photo illuminated open circuit potential (OCP) for the bismuth oxide samples (β- and α-Bi2O3) are shown in Fig. 7b and c, respectively. As the light intensity increases, the potential of the semiconductor electrodes (equal to the Fermi level) is shifted to more negative values vs. NHE (Normal Hydrogen Electrode). The data were fitted using exponential decay functions and the asymptotic values (when the power of the light source is approaching infinity) were determined to be −0.01 and 0.01 V vs. NHE at pH 12 for these samples. Considering that the irradiation intensity is sufficiently intense to completely remove the band bending at the surface and the materials do not have fast carrier recombination rates, the values can serve as estimations of the flat band potentials of the semiconductors.62 To convert the data to pH 0, the Nernst equation (eqn (8)) was used,| | | Vfb(pH = 0) = Vfb(pH = 0) + 12 × 0.059 V | (8) |
According to this correction, the flat band potentials of 0.70 and 0.72 V vs. RHE (Reversible Hydrogen Electrode) are observed for α and β-Bi2O3, respectively showing n-type behaviour (electrons near to the conduction band). The PL emission studies of the as-synthesized Bi2O3 samples were carried out with an excitation wavelength of 325 nm (Fig. 7d). The PL spectrum shows a strong emission peak at 469 nm owing to photogenerated carrier recombination.10 The PL intensity of the β-Bi2O3 nanoparticles was distinctly lower when compared with α-Bi2O3 due to a greater extent of photogenerated carrier separation. Lifetime measurements of the photogenerated carriers in the as-synthesized Bi2O3 samples were carried out at an excitation wavelength of 325 nm and emission wavelength of 470 nm. It can be clearly observed that β-Bi2O3 nanoparticles have a longer lifetime (0.49 ns) that of the α-Bi2O3 sample (0.38 ns) (Fig. S4, ESI†). The photocurrent studies reveal that β-Bi2O3 nanoparticles show a higher efficiency (Fig. S5, ESI†).
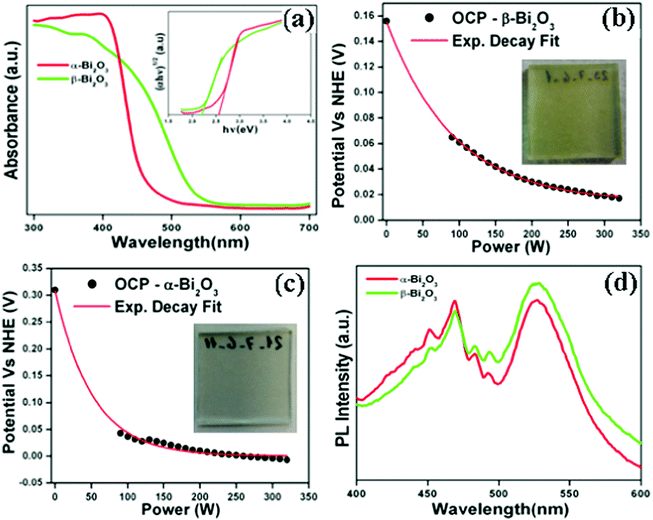 |
| | Fig. 7 (a) DRS absorption (inset-Tauc plot), (b and c) photo illuminated OCP data (inset of corresponding photograph for the working electrode) and (d) PL emission spectrum of Bi2O3 samples. | |
Photocatalytic performances of organic dye degradation and mechanism
The photocatalytic performances of the as-synthesized bismuth oxide polymorphs were studied for the degradation of organic dyes (Rh B, MB, AO 7 and MO) under simulated solar illumination. Fig. S6a and S7a (ESI†) show the UV-vis absorption spectra of Rh B in an aqueous solution using β-Bi2O3 and α-Bi2O3. The characteristic absorption peak at 553 nm corresponding to Rh B is found to decrease during illumination. After 240 minutes, β-Bi2O3 nanoparticles exhibit 92% degradation of Rh B, higher than that observed with α-Bi2O3 (69%). Similarly, the other dyes such as MB (65% for β-Bi2O3 and 54% for α-Bi2O3), AO 7 (83% for β-Bi2O3 and 66% for α-Bi2O3) and MO (63% for β-Bi2O3 and 32% for α-Bi2O3) also show degradation under identical conditions (Fig. S6 and S7, ESI†). Furthermore, the results of the degradation profile are compared with illumination time on bismuth oxide samples (Fig. 8a and b). Then, the photocatalytic degradation kinetics of these dyes are calculated (Fig. 8c and d). The photocatalytic degradation of these dyes shows pseudo-first order kinetics and the rate constant values are provided in Table 1. Here, the photocatalytic degradation kinetics was dissimilar due to the molecular structure of the organic dye molecules and nature of the semiconductor under illumination.
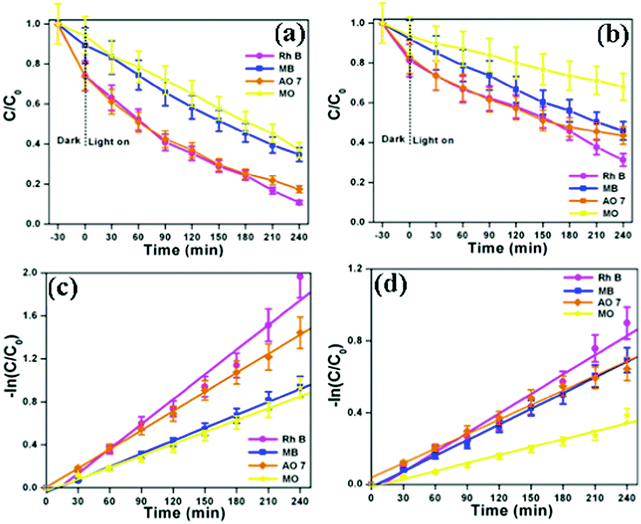 |
| | Fig. 8 (a and b) Photocatalytic degradation curve and (c and d) kinetic plot of β-Bi2O3 and α-Bi2O3, respectively (indicating that the error bars show a standard deviation for the analyses). | |
Table 1 Comparison of the rate constant (k) and relative coefficients (R2) of the degradation of these dyes over the as-synthesized Bi2O3 samples under simulated solar illumination
| Samples |
Rh B |
MB |
AO 7 |
MO |
| Rate constant (min−1) |
R
2 value |
Rate constant (min−1) |
R
2 value |
Rate constant (min−1) |
R
2 value |
Rate constant (min−1) |
R
2 value |
| β-Bi2O3 |
0.0071 |
0.9861 |
0.0041 |
0.9928 |
0.0059 |
0.9996 |
0.0036 |
0.9908 |
| α-Bi2O3 |
0.0035 |
0.9895 |
0.0029 |
0.9975 |
0.0027 |
0.9958 |
0.0013 |
0.9979 |
Furthermore, to understand the photocatalytic processes of the as-synthesized Bi2O3 samples, their band structures were studied and a mechanism is proposed (Scheme 2). The calculated VB and CB values of β-Bi2O3 nanoparticles are located at 2.83 and 0.61 eV (vs. NHE), and at 3.01 and 0.45 eV (vs. NHE) for the α-Bi2O3 sample. However, for both cases, the CB values are more positive than that of O2/O2˙− (−0.28 eV vs. NHE), and the CB values are more positive than that of OH˙/H2O (2.8 eV vs. NHE). Thus, during illumination, photoreduction can occur at the CB (O2 into O2˙−) through the photogenerated electron and the photooxidation ensues at the VB (H2O into OH˙) by the photogenerated holes.
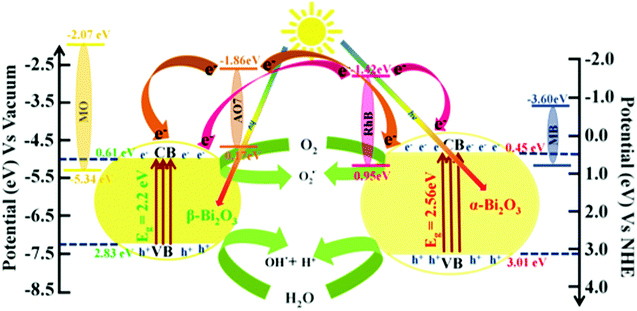 |
| | Scheme 2 Schematic illustration of the band structure and mechanism for the photocatalytic performances of dyes over as-synthesized Bi2O3 samples under simulated solar illumination. | |
The OH˙ radical generation was confirmed using terephthalic acid as a probe. The PL emission spectrum shows emission at 425 nm when the excitation wavelength is at 315 nm, which is characteristic for 2-hydroxy terephthalic acid (Fig. 9). Hence, the involvement of OH˙ radical and O2˙− reactive species in the photocatalytic activity for the dye degradation process could be confirmed (reactions (9)–(11)).
| | | Bi2O3 + hν → Bi2O3 (eCB−) + Bi2O3 (hVB+) | (9) |
| | | O2 + Bi2O3 (eCB−) → Bi2O3 + (O2˙−) | (10) |
| | | H2O + Bi2O3 (hVB+) → Bi2O3 + (OH˙ + H+) | (11) |
On the other hand, Rh B and AO 7 dye molecules contain carboxyl (–COOH) and hydroxyl (–OH) groups. However, these functional groups (dyes) are connected to the surface sites of the as-synthesized bismuth oxide samples (through the surface OH). Thus, they strongly adsorb on the Bi
2O
3 surface, which leads to photosensitization of the dye to dye* under illumination.
63,64 Moreover, the calculated conduction band positions of β-Bi
2O
3 at 0.61 eV (
vs. NHE) and 0.45 eV (
vs. NHE) for the α-Bi
2O
3 sample have a higher energy level offset of Rh B/Bi
2O
3(≥1.87 eV) at the interface which is thermodynamically favorable, whereas in the case of AO 7/Bi
2O
3 the calculated energy level offset at the interface is ≥2.31 eV (conduction band position of Rh B in
Eo = −1.42 eV (
vs. NHE) and
Eo = −1.86 eV (
vs. NHE) for AO 7).
57,64,65 This creates an electron displacement between the dye* and Bi
2O
3, and electron recombination between the dye and Bi
2O
3 which helps towards the photodegradation of Rh B with a higher efficacy compared to AO 7. Furthermore, the photosensitization mechanisms of Rh B and AO 7 dye degradation are expressed for the following
reactions (12)–(16):
| | | Dye (Rh B and AO 7) → Dye* | (12) |
| | | Dye* + Bi2O3 → Dye+ + Bi2O3 (eCB−) | (13) |
| | | Bi2O3 (eCB−) + O2 → O2˙− + Bi2O3 | (14) |
| | | Dye+ + H2O → OH˙ + H+ + Dye | (15) |
| | | (OH˙ + H+) + (O2˙−) + Dye → Degradation products | (16) |
| | | Dye (MB and MO) + (OH˙ + H+) + (O2˙−) → Degradation products | (17) |
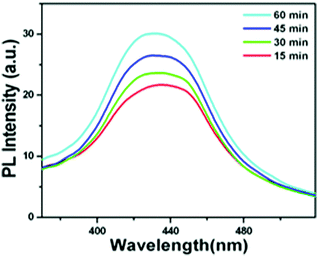 |
| | Fig. 9 PL emission spectrum of terephthalic acid in a basic solution (with β-Bi2O3 nanoparticles under illumination). | |
Whereas, MB and MO do not adsorb on the Bi2O3 surface (no functional group), which illustrates that no photosensitization occurs under illumination (reactions (9)–(11) and (17)) (Fig. S8, ESI†). However, the conduction band position of MB for Eo = −3.60 eV (vs. Vacuum) and MO for Eo = −2.07 eV (vs. NHE) possesses thermodynamically unfavorable electron displacement between the dye and Bi2O3 samples (only oxidation–reduction at VB and CB of semiconductors). In addition, the MB dye (Ar–N–Ar bonds) shows a higher photocatalytic degradation when compared with MO (contains N![[double bond, length as m-dash]](https://www.rsc.org/images/entities/char_e001.gif) N bond) dye due to a smaller size. Then, the MB dye molecule consists of sulfur (
N bond) dye due to a smaller size. Then, the MB dye molecule consists of sulfur (![[double bond, length as m-dash]](https://www.rsc.org/images/entities/char_e001.gif) S+–aromatic) links which enhanced degradation owing to sulfonyl groups placed in the p-benzene ring.66 Therefore, for the photocatalytic efficiency of the as-synthesized Bi2O3 samples we expressed the following order of degradation rate: Rh B > AO 7 > MB > MO under simulated illumination. Furthermore, β-Bi2O3 nanoparticles have a higher photocatalytic activity when compared with the α-Bi2O3 sample which was due to various facts such as band gap, longer recombination lifetime, crystalline size and surface potential etc.
S+–aromatic) links which enhanced degradation owing to sulfonyl groups placed in the p-benzene ring.66 Therefore, for the photocatalytic efficiency of the as-synthesized Bi2O3 samples we expressed the following order of degradation rate: Rh B > AO 7 > MB > MO under simulated illumination. Furthermore, β-Bi2O3 nanoparticles have a higher photocatalytic activity when compared with the α-Bi2O3 sample which was due to various facts such as band gap, longer recombination lifetime, crystalline size and surface potential etc.
Conclusions
In conclusion, we have successfully synthesized Bi2O3 polymorph structures (β-Bi2O3 nanoparticles and α-Bi2O3 coral-like morphology) using a post-calcination method using Bi2O2CO3 nanoflakes as an intermediate. The microscopic (SEM, TEM and EDS) and spectroscopic (powder XRD, FTIR and Raman analysis) data confirmed that the synthesized Bi2O3 polymorphs are in pure phases and highly crystalline in nature. The enhanced photocatalytic activity for the degradation of organic dyes (Rh B, MB, AO 7 and MO) using β-Bi2O3 nanoparticles is attributed to large photon adsorption (band gap 2.2 eV) when compared with α-Bi2O3 (band gap 2.56 eV). Furthermore, the superior degradation of Rh B and AO 7 dyes is demonstrated due to photosensitization during illumination.
Conflicts of interest
There are no conflicts to declare.
Acknowledgements
The research described herein was financially supported by the Department of Science and Technology, India under the Water Technology Initiative scheme (DST/TM/WTI/2k16/258(G)).
References
- M. R. Hoffmann, S. T. Martin, W. Choi and D. W. Bahnemann, Chem. Rev., 1995, 95, 69–96 CrossRef.
- A. Mills and S. L. Hunte, J. Photochem. Photobiol., A, 1997, 108, 1–35 CrossRef.
- D. Chen, M. Sivakumar and A. K. Ray, Dev. Chem. Eng. Miner. Process., 2000, 8, 505–550 CrossRef.
- X. Xu, G. Li and J. C. Yu, Langmuir, 2010, 26, 3031–3039 CrossRef PubMed.
- H. Tong, S. Ouyang, Y. Bi, N. Umezawu, M. Oshikiri and J. Ye, Adv. Mater., 2012, 24, 229–251 CrossRef PubMed.
- X. Chen, S. Shen, L. Guo and S. S. Mao, Chem. Rev., 2010, 110, 6503–6570 CrossRef PubMed.
- R. Vinu and G. Madras, J. Indian Inst. Sci., 2010, 90, 189–230 Search PubMed.
- Z. Ai, Y. Huang, S. Lee and L. Zhang, J. Alloys Compd., 2011, 509, 2044–2049 CrossRef.
- N. Serpone, A. V. Emeline, S. Horikoshi, V. N. Kuznetsov and V. K. Ryabchuk, Photochem. Photobiol. Sci., 2012, 11, 1121–1150 RSC.
- H. Jiang, P. Li, G. Liu, J. Ye and J. Lin, J. Mater. Chem. A, 2015, 3, 5119–5125 RSC.
- D. Reyes-Coronado, G. Rodríguez-Gattorno, M. E. Espinosa-Pesqueira, C. Cab, R. D. Coss and G. Oskam, Nanotechnology, 2008, 19, 145605 CrossRef PubMed.
- M. D. Hernández-Alonso, F. Fresno, S. Suárez and J. M. Coronado, Energy Environ. Sci., 2009, 2, 1231–1257 RSC.
- F. Dong, Y. Sun, M. Fu, W. Ho, S. C. Lee and Z. Wu, Langmuir, 2012, 28, 766–773 CrossRef PubMed.
- W. Ong, L. Tan, S. Chai, S. Yong and A. R. Mohamed, ChemSusChem, 2014, 7, 690–719 CrossRef PubMed.
- G. Liu, L. Wang, H. G. Yang, H. Cheng and G. Q. Lu, J. Mater. Chem., 2010, 20, 831–843 RSC.
- A. K. Sinha, M. Pradhan, S. Sarkar and T. Pal, Environ. Sci. Technol., 2013, 47, 2339–2345 CrossRef PubMed.
- L. Wang, J. Shang, W. Hao, S. Jiang, S. Huang, T. Wang, Z. Sun, Y. Du, S. Dou, T. Xie, D. Wang and J. Wang, Sci. Rep., 2014, 4, 7384 CrossRef PubMed.
- T. Saison, N. Chemin, C. Chanéac, O. Durupthy, V. Ruaux, L. Mariey, F. Maugé, P. Beaunier and J. Jolivet, J. Phys. Chem. C, 2011, 115, 5657–5666 CrossRef.
- J. Di, J. Xia, M. Ji, B. Wang, S. Yin, Q. Zhang, Z. Chen and H. Li, ACS Appl. Mater. Interfaces, 2015, 7, 20111–20123 CrossRef PubMed.
- G. Naresh and T. K. Mandal, ACS Appl. Mater. Interfaces, 2014, 6, 21000–21010 CrossRef PubMed.
- Y. Zheng, F. Duan, M. Chen and Y. Xie, J. Mol. Catal. A: Chem., 2010, 317, 34–40 CrossRef.
- J. Xiong, G. Cheng, Z. Lu, J. Tang, X. Yu and R. Chen, CrystEngComm, 2011, 13, 2381–2390 RSC.
- T. Selvamani and S. Anandan, Mater. Sci. Forum, 2013, 734, 138–185 Search PubMed.
- T. Selvamani, A. M. Asiri, A. O. Al-youbi and S. Anandan, Mater. Sci. Forum, 2013, 764, 169–193 Search PubMed.
- J. Wang, X. Yang, K. Zhao, P. Xu, L. Zong, R. Yu, D. Wang, J. Deng, J. Chen and X. Xing, J. Mater. Chem. A, 2013, 1, 9069–9074 RSC.
- X. Xiao, S. Tu, C. Zheng, H. Zhong, X. Zuo and J. Nan, RSC Adv., 2015, 5, 74977–74985 RSC.
- P. Riente, A. M. Adams, J. Albero, E. Palomares and M. A. Pericás, Angew. Chem., Int. Ed., 2014, 53, 1–5 CrossRef PubMed.
- Y. Lu, Y. Zhao, J. Zhao, Y. Song, Z. Huang, F. Gao, N. Li and Y. Li, Cryst. Growth Des., 2015, 15, 1031–1042 CrossRef.
- R. Chen, Z. Shen, H. Wang, H. Zhou, Y. Liu, D. Ding and T. Chen, J. Alloys Compd., 2011, 509, 2588–2596 CrossRef.
- S. Anandan, G. Lee, P. Chen, C. Fan and J. J. Wu, Ind. Eng. Chem. Res., 2010, 49, 9729–9737 CrossRef.
- Y. Qiu, J. Zhou, J. Cai, W. Xu, Z. You and C. Yin, Chem. Eng. J., 2016, 306, 667–675 CrossRef.
- T. Hashimoto, H. Ohta, H. Nasu and A. Ishihara, Int. J. Hydrogen Energy, 2016, 41, 7388–7392 CrossRef.
- Y. Hu, D. Li, F. Sun, Y. Weng, S. You and Y. Shao, J. Hazard. Mater., 2016, 301, 362–370 CrossRef PubMed.
- M. Jalalah, M. Faisal, H. Bouzid, J. Park, S. A. Al-Sayari and A. A. Ismail, J. Ind. Eng. Chem., 2015, 30, 183–189 CrossRef.
- M. J. J. Fatima, C. V. Niveditha and S. Sindhu, RSC Adv., 2015, 5, 78299–78305 RSC.
- A. L. J. Pereira, J. A. Sans, R. Vilaplana, O. Gomis, F. J. Manjón, P. Rodríguez-Hernández, A. Muňoz, C. Popescu and A. Beltrán, J. Phys. Chem. C, 2014, 118, 23189–23201 CrossRef.
- S. Schmidt, E. T. Kubaski, D. P. Volanti, T. Sequinel, V. D. N. Bezzon, A. Beltrán, S. M. Tebcherani and J. A. Varela, Inorg. Chem., 2015, 54, 10184–10191 CrossRef PubMed.
- T. Lu, Z. Du, J. Liu, H. Ma and J. Xu, Green Chem., 2013, 15, 2215–2221 RSC.
- S. Anusha, B. S. Anandakumar, C. D. Mohan, G. P. Nagabhushana, B. S. Priya, K. S. Rangappa and G. T. Chandrappa, RSC Adv., 2014, 4, 52181–52188 Search PubMed.
- Y. Yu, S. Lu, S. Bao, Q. Sun and S. Liao, Phys. Chem. Chem. Phys., 2016, 18, 1931–1936 RSC.
- M. Khairy, R. O. Kadara, D. K. Kampouris and C. E. Banks, Electroanalysis, 2010, 22, 1455–1459 CrossRef.
- Y. Li, M. A. Trujillo, E. Fu, B. Patterson, L. Fei, Y. Xu, S. Deng, S. Smirnov and H. Luo, J. Mater. Chem. A, 2013, 1, 12123–12127 RSC.
- F. Zheng, G. Li, Y. Qu, Z. Wang, C. Su and Y. Tong, Chem. Commun., 2010, 46, 5021–5023 RSC.
- K. T. Lee, A. A. Lidie, S. Y. Jeon, G. T. Hitz, S. J. Song and E. D. Wachsman, J. Mater. Chem. A, 2013, 1, 6199–6207 RSC.
- H. Deng, W. Hao and H. Xu, Chin. Phys. Lett., 2011, 28, 056101 CrossRef.
- Y. Qiu, M. Yang, H. Fan, Y. Zuo, Y. Shao, Y. Xu, X. Yang and S. Yang, CrystEngComm, 2011, 13, 1843–1850 RSC.
- H. Lu, S. Wang, L. Zhao, B. Dong, Z. Xu and J. Li, RSC Adv., 2012, 2, 3374–3378 RSC.
- Q. Huang, S. Zhang, C. Cai and B. Zhou, Mater. Lett., 2011, 65, 988–990 CrossRef.
- H. Wang, H. Yang and L. Lu, RSC Adv., 2014, 4, 17483–17489 RSC.
- M. Muruganandham, R. Amuha, G. Lee, S. Hsieh, J. J. Wu and M. Sillanpää, J. Phys. Chem. C, 2012, 116, 12906–12915 CrossRef.
- H. Cheng, B. Huang, J. Lu, Z. Wang, B. Xu, X. Qin, X. Zhang and Y. Dai, Phys. Chem. Chem. Phys., 2010, 12, 15468–15475 RSC.
- S. J. A. Moniz, C. S. Blackman, C. J. Carmalt and G. Hyett, J. Mater. Chem., 2010, 20, 7881–7886 RSC.
- F. Wang, Z. Zhao, K. Zhang, F. Dong and Y. Zhou, RSC Adv., 2015, 17, 6098–6102 Search PubMed.
- G. Li, J. Lian, M. Hojamberdiev and W. Que, J. Cluster Sci., 2013, 24, 829–841 CrossRef.
- Y. Yan, Z. Zhou, Y. Cheng, L. Qiu, C. Gao and J. Zhou, J. Alloys Compd., 2014, 605, 102–108 CrossRef.
- L. Huang, G. Li, T. Yan, J. Zheng and L. Li, New J. Chem., 2011, 35, 197–203 RSC.
- H. Cheng, B. Huang, K. Yang, Z. Wang, X. Qin, X. Zhang and Y. Dai, ChemPhysChem, 2010, 11, 2167–2173 CrossRef PubMed.
- T. Selvamani, B. G. S. Raj, S. Anandn, J. J. Wu and M. Ashokkumar, Phys. Chem. Chem. Phys., 2016, 18, 7768–7779 RSC.
- F. Dong, S. C. Lee, Z. Wu, H. Huang, M. Fu, W.-K. Ho, S. Zou and B. Wang, J. Hazard. Mater., 2011, 195, 346–354 CrossRef PubMed.
- S. P. Meshram, P. V. Adhyapak, U. P. Mulik and D. P. Amalnerkar, Chem. Eng. J., 2012, 204–206, 158–168 CrossRef.
- Y. Wang, J. Zhao, Y. Zhu, B. Zhou, X. Zhao and Z. Wang, Colloids Surf., A, 2013, 434, 296–302 CrossRef.
-
Z. Chen, H. N. Dinh and E. Miller, Photoelectrochemical water splitting: standards, experimental methods, and protocols, 2013 Search PubMed.
- K. Vinodgopal, D. E. Wynkoop and P. V. Kamat, Environ. Sci. Technol., 1996, 30, 1660–1666 CrossRef.
- J. Tang, D. Li, Z. Feng, Z. Tan and B. Ou, RSC Adv., 2014, 4, 2151–2154 RSC.
- S. Bassaid, B. Bellal and M. Trari, React. Kinet., Mech. Catal., 2015, 115, 389–400 CrossRef.
- T. Zhao, J. Zai, M. Xu, Q. Zou, Y. Su, K. Wang and X. Qian, CrystEngComm, 2011, 13, 4010–4017 RSC.
Footnote |
| † Electronic supplementary information (ESI) available: Fig. S1–S8: EDS spectra of Bi2O2CO3 nanoflakes and β-Bi2O3 nanoparticles, zeta potential, time-resolved fluorescence spectrum, photocurrent response results of Bi2O3 polymorphs, and photodegradation profiles for organic dyes solutions. Tables T1 and T2: Unit cell parameters, and calculated EVB and ECB from Eg values. See DOI: 10.1039/c8qm00221e |
|
| This journal is © the Partner Organisations 2018 |
Click here to see how this site uses Cookies. View our privacy policy here.  *a,
Luis
Granone
 b,
Detlef W.
Bahnemann
 b and
Muthupandian
Ashokkumar
 c
c
![[double bond, length as m-dash]](https://www.rsc.org/images/entities/char_e001.gif) O with additional bands at 160 cm−1 and 360 cm−1 are attributed to external vibrations during Raman analysis of the Bi2O2CO3 sample.59 The surface morphology of the as-synthesized Bi2O2CO3 sample was studied via FESEM. As shown in Fig. 1d, the FESEM image for the as-synthesized sample had a flake like morphology with a uniform size of about 100–200 nm and tiny thickness of several nanometer length. However, the Bi2O2CO3 morphology of the nanoflakes is quite different from that of Bi2O2CO3 nanoplatelets due to the initial concentrations of bismuth nitrate pentahydrate and concerned reaction conditions.58 Thus, the as-synthesized sample indicates Bi2O2CO3 nanoflakes as a surface morphology. Furthermore, the EDS analysis of the Bi2O2CO3 nanoflakes found the presence of Bi, C, and O elements (Fig. S1. ESI†). So, it could clearly indicate that the Bi2O2CO3 nanoflakes are highly pure. The TGA analysis clearly shows that the Bi2O2CO3 nanoflakes decompose in the temperature range of 300–400 °C to generate Bi2O3 (Fig. 2). The calculated mass loss ≤9% is almost close to the theoretical value of ∼8.9% when Bi2O2CO3 nanoflakes are converted to Bi2O3 during decomposition. Hence, the Bi2O2CO3 nanoflakes were calcined at 350 °C and 400 °C for 2 h to obtain β and α-Bi2O3, respectively.
O with additional bands at 160 cm−1 and 360 cm−1 are attributed to external vibrations during Raman analysis of the Bi2O2CO3 sample.59 The surface morphology of the as-synthesized Bi2O2CO3 sample was studied via FESEM. As shown in Fig. 1d, the FESEM image for the as-synthesized sample had a flake like morphology with a uniform size of about 100–200 nm and tiny thickness of several nanometer length. However, the Bi2O2CO3 morphology of the nanoflakes is quite different from that of Bi2O2CO3 nanoplatelets due to the initial concentrations of bismuth nitrate pentahydrate and concerned reaction conditions.58 Thus, the as-synthesized sample indicates Bi2O2CO3 nanoflakes as a surface morphology. Furthermore, the EDS analysis of the Bi2O2CO3 nanoflakes found the presence of Bi, C, and O elements (Fig. S1. ESI†). So, it could clearly indicate that the Bi2O2CO3 nanoflakes are highly pure. The TGA analysis clearly shows that the Bi2O2CO3 nanoflakes decompose in the temperature range of 300–400 °C to generate Bi2O3 (Fig. 2). The calculated mass loss ≤9% is almost close to the theoretical value of ∼8.9% when Bi2O2CO3 nanoflakes are converted to Bi2O3 during decomposition. Hence, the Bi2O2CO3 nanoflakes were calcined at 350 °C and 400 °C for 2 h to obtain β and α-Bi2O3, respectively.

![[4 with combining macron]](https://www.rsc.org/images/entities/char_0034_0304.gif) 21c corresponding to JCPDS card no. 27-0050. While the Bi2O2CO3 nanoflake sample calcined at 400 °C exhibits diffraction lines of (102), (002), (120), (012), (200), (212), (112), (222), (122), (041), (104), (321), (241), (314), (232), (252) and (161) plane at 2θ = 25.6°, 26.8°, 27.3°, 27.9°, 33.1°, 34.9°, 37.5°, 39.9°, 42.2°, 46.2°, 48.5°, 52.2°, 54.6°, 57.7°, 62.3°, 66.7° and 74.3°, which are in good agreement with JCPDS card no. 41-1449 for α-Bi2O3 as a monoclinic phase with space group P21/c. The calculated crystalline size and unit cell lattice parameters of these samples are provided in Table ST1 (ESI†). The crystalline size of α-Bi2O3 changed when compared with β-Bi2O3 due to a phase transition during calcination at high temperature (400 °C). The FTIR spectrum of the β-Bi2O3 and α-Bi2O3 samples is shown in Fig. 4a. Crystalline water molecules are chemisorbed and/or physisorbed on both the samples which show weak vibration bands at 3434–3442 cm−1 and 1640 cm−1.60 Anti-symmetric vibration (ν3) and inner-plane deformation (ν4) for carbonate ions are present in these samples at 1388 cm−1 with 850 cm−1 and 636 cm−1, respectively. Thus, the synthesized β and α-Bi2O3 samples have water molecules and carbonate ions present on the surface during phase transformation from Bi2O2CO3 nanoflakes. A similar observation was reported in a previous study.10 Moreover, the phase lucidity of the as-synthesized Bi2O3 polymorphs was further confirmed by Raman analysis (Fig. 4b). The vibrational bands at 90, 128, 148, 160, 232, 314 and 466 cm−1 for the β-Bi2O3 sample are attributed to a tetragonal phase. Similarly, the vibrational bands at 84, 92, 102, 120, 138, 152, 182, 210, 282, 314, 412, 448 and 530 cm−1 for α-Bi2O3 possess a monoclinic phase with space group P21/c.37,61 Among them, the band at 120 cm−1 could be ascribed to the bismuth vibrational mode and Bi–O scattering at 138 and 152 cm−1 for α-Bi2O3, whereas all others bands are attributed to anharmonicity of the oxygen vibrational mode observed in α-Bi2O3 during Raman analysis.37 Hence, the as-synthesized samples exhibit a highly crystalline Bi2O3 polymorph phase (β and α-Bi2O3).
21c corresponding to JCPDS card no. 27-0050. While the Bi2O2CO3 nanoflake sample calcined at 400 °C exhibits diffraction lines of (102), (002), (120), (012), (200), (212), (112), (222), (122), (041), (104), (321), (241), (314), (232), (252) and (161) plane at 2θ = 25.6°, 26.8°, 27.3°, 27.9°, 33.1°, 34.9°, 37.5°, 39.9°, 42.2°, 46.2°, 48.5°, 52.2°, 54.6°, 57.7°, 62.3°, 66.7° and 74.3°, which are in good agreement with JCPDS card no. 41-1449 for α-Bi2O3 as a monoclinic phase with space group P21/c. The calculated crystalline size and unit cell lattice parameters of these samples are provided in Table ST1 (ESI†). The crystalline size of α-Bi2O3 changed when compared with β-Bi2O3 due to a phase transition during calcination at high temperature (400 °C). The FTIR spectrum of the β-Bi2O3 and α-Bi2O3 samples is shown in Fig. 4a. Crystalline water molecules are chemisorbed and/or physisorbed on both the samples which show weak vibration bands at 3434–3442 cm−1 and 1640 cm−1.60 Anti-symmetric vibration (ν3) and inner-plane deformation (ν4) for carbonate ions are present in these samples at 1388 cm−1 with 850 cm−1 and 636 cm−1, respectively. Thus, the synthesized β and α-Bi2O3 samples have water molecules and carbonate ions present on the surface during phase transformation from Bi2O2CO3 nanoflakes. A similar observation was reported in a previous study.10 Moreover, the phase lucidity of the as-synthesized Bi2O3 polymorphs was further confirmed by Raman analysis (Fig. 4b). The vibrational bands at 90, 128, 148, 160, 232, 314 and 466 cm−1 for the β-Bi2O3 sample are attributed to a tetragonal phase. Similarly, the vibrational bands at 84, 92, 102, 120, 138, 152, 182, 210, 282, 314, 412, 448 and 530 cm−1 for α-Bi2O3 possess a monoclinic phase with space group P21/c.37,61 Among them, the band at 120 cm−1 could be ascribed to the bismuth vibrational mode and Bi–O scattering at 138 and 152 cm−1 for α-Bi2O3, whereas all others bands are attributed to anharmonicity of the oxygen vibrational mode observed in α-Bi2O3 during Raman analysis.37 Hence, the as-synthesized samples exhibit a highly crystalline Bi2O3 polymorph phase (β and α-Bi2O3).


![[double bond, length as m-dash]](https://www.rsc.org/images/entities/char_e001.gif) N bond) dye due to a smaller size. Then, the MB dye molecule consists of sulfur (
N bond) dye due to a smaller size. Then, the MB dye molecule consists of sulfur (![[double bond, length as m-dash]](https://www.rsc.org/images/entities/char_e001.gif) S+–aromatic) links which enhanced degradation owing to sulfonyl groups placed in the p-benzene ring.66 Therefore, for the photocatalytic efficiency of the as-synthesized Bi2O3 samples we expressed the following order of degradation rate: Rh B > AO 7 > MB > MO under simulated illumination. Furthermore, β-Bi2O3 nanoparticles have a higher photocatalytic activity when compared with the α-Bi2O3 sample which was due to various facts such as band gap, longer recombination lifetime, crystalline size and surface potential etc.
S+–aromatic) links which enhanced degradation owing to sulfonyl groups placed in the p-benzene ring.66 Therefore, for the photocatalytic efficiency of the as-synthesized Bi2O3 samples we expressed the following order of degradation rate: Rh B > AO 7 > MB > MO under simulated illumination. Furthermore, β-Bi2O3 nanoparticles have a higher photocatalytic activity when compared with the α-Bi2O3 sample which was due to various facts such as band gap, longer recombination lifetime, crystalline size and surface potential etc.


