Polyol derived Ni and NiFe alloys for effective shielding of electromagnetic interference†
Kesavapillai Sreedeviamma
Dijith
ab,
Remadevi
Aiswarya
ab,
Mathew
Praveen
a,
Saju
Pillai
 ab and
Kuzhichalil Peethambharan
Surendran
 *ab
*ab
aMaterials Science and Technology Division, CSIR-National Institute for Interdisciplinary Science and Technology, Trivandrum, Kerala, India. E-mail: kpsurendran@niist.res.in; Fax: +91 471 2491712; Tel: +91 471 2515258
bAcademy of Scientific and Innovative Research (AcSIR), New Delhi, India
First published on 31st July 2018
Abstract
Ni and NiFe alloys with different compositions have been successfully synthesized using a simple, surfactant-free polyol method. The morphological analysis demonstrated a uniform spherical nature of the alloys, with size range ∼10–30 nm. A very thin oxide layer was found to form over the alloy nanoparticles (NPs) which is weakly visible in TEM and later confirmed by XPS analysis. The magnetic properties of the Ni and NiFe NPs were measured using a vibrating sample magnetometer (VSM) at room temperature. The saturation magnetization value was found to be lowest in Ni and keeps on increasing with increasing Fe content in the composition. The resistivity, as revealed from I–V characteristics, was shown to be lowest for the permalloy (Ni80Fe20) phase, while the values increase with further increment in the Fe content. The microwave shielding properties of the Ni and its Fe alloy NPs were investigated in the Ku band range. The lower EM wave transmittance with good reflection and absorption coefficients is responsible for the high shielding values. All of the alloys tested in this investigation showed excellent microwave shielding properties ranging from −21 to −41 dB in the entire Ku band, for ∼1 mm thick samples. The lowest EMI shielding range (−21 to −29 dB) was noted for Ni NPs while the highest was observed in the case of permalloy (−30 to −41 dB). The rest of the NiFe combinations show intermediate shielding effectiveness as compared to Ni and permalloy. Certainly, all of the NiFe alloy combinations we tested showed excellent EMI shielding above −30 dB, with significant enhancements in the absorption shielding efficiency. These alloys are good candidates for EMI shielding having the ability to attenuate 99.9% of electromagnetic radiation.
1. Introduction
Electromagnetic interference (EMI) is an inevitable consequence of the revolutionary growth of information technology that has resulted in a huge number of electronic devices integrated into extremely small device spaces. In devices like laptop computers, mobile phones, video games, process control equipment, video recorders, business machines and automotive devices, the interference is often addressed by employing suitable shielding solutions which should be of low cost and environmentally friendly.1 The shielding can be conventionally realized by three mechanisms; absorption, reflection and multiple internal reflections. For microwave attenuation in handheld devices like cell phones, iPads, laptops etc., lightweight EMI solutions comprising graphene and its hybrids are among the most useful candidates.2–4 Recently, a few other 2D conductive materials like MXenes have also been revealed to possess promising EMI shielding efficiency, owing to their high electronic coupling between the layers.5 Nevertheless, the most widely used traditional shielding materials are metal based systems wherein the plane waves can be easily attenuated and the shield thickness requirements decrease as the frequency increases.6 Magnetic shields also work in a similar way, where a thick magnetic material with high permeability (μ ≫ 1) and magnetic loss can create high magnetic field attenuation by providing a low reluctance path for the magnetic field. Here the magnetic shielding material will develop an alternating magnetic field that generates an eddy current on the shield, making a nullifying field in the opposite orientation. For practical cavity resonance damping applications, the magnetic absorbers are found to be ideal since the magnetic field is maximum on the conductive surface where the absorber is placed. In general, for magnetic absorber-based EMI solutions, the shielding effectiveness increases as a function of frequency.Synthetic soft magnetic materials made a pathway for the development of high-density electronic circuits, to operate at high frequencies. They are widely used as magnetic cores in downsized inductors and as electromagnetic noise absorbers.7 The pronounced absorptive nature of magnetic materials like ferrites and metallic alloys has been originated from their effective magnetic and dielectric loss properties.8 These nanomagnetic materials have novel chemical, magnetic, electrical and electromagnetic properties, which are often different from their bulk counterparts because of the smaller sizes and larger specific surface areas. Iron, nickel, cobalt and their alloys are well known soft ferromagnets which exhibit high magnetization and low coercivity, which are widely being applied in EMI shielding and microwave absorption applications.9
Among various soft ferromagnets, permalloy (Ni80Fe20), which possesses extremely high magnetic permeability, low coercive force, and nominal core losses with low remanence, is useful for efficient magnetic shielding applications where ultra-low fields lower than earth's magnetism are needed. Furthermore, its small magnetostriction is beneficial for industrial thin film applications, where variable stresses don’t affect the magnetic characteristics. Various synthesis procedures are available for the synthesis of Ni and NiFe nanoparticles, like mechanical alloying,10 the hydrothermal method,11 the sonochemical method,12 reverse micelle techniques,13 the hydrogen plasma reaction method14etc. Most of these synthesis routes involve the usage of different surfactants, reducing agents, special reaction conditions etc. which further makes the process complex. However, the present study follows a simple polyol method by making use of the polymer polyethylene glycol (PEG) as the solvent cum reducing agent. Polyol-based synthesis is frequently used in the synthesis of magnetic nanoparticles due to the method's control over composition and size of nanoparticles, through the capping effect of glycol-family solvents and nucleating agents.15 Here PEG is playing multiple roles – as a versatile dispersant, high boiling solvent, effective reductant, and also as a stabilizer which controls the particle growth and avoids aggregation of precursors due to steric interactions. Ferromagnetic nanomaterials (Ni, Fe, NiFe alloys etc.) and other metallic nanoparticles are widely synthesized using this polyol method.16–20 It is highlighted in the literature that the polyol process will result in the generation of monodisperse, highly crystalline and uniform sized nanoparticles.21
Herein, we report the synthesis and electric/magnetic/electromagnetic properties of Ni and its alloys with Fe using a simple polyethylene glycol-mediated polyol method, without the need for any inert atmospheres for powder synthesis. The prepared nanoparticles were formed into thin sheets and densified through hydrogen annealing, and were further analyzed for their magnetic and electrical properties and EMI shielding characteristics. The microwave shielding properties of a series of polyol derived nano NiFe alloys (Ni80Fe20, Ni50Fe50, and Ni20Fe80) are being reported for the first time. Using this procedure, we could achieve an impressive shielding performance in NiFe alloys in the range of −30 to −41 dB, even at a lower thickness of 1 mm.
2. Experimental section
The chemicals used, nickel chloride hexahydrate (NiCl2·6H2O) and polyethylene glycol 400 (PEG) were procured from Aldrich, while iron chloride tetrahydrate (FeCl2·4H2O), sodium hydroxide (NaOH) and ethyl alcohol were procured from Merck. All are of analytical grade purity.2.1 Synthesis of NiFe alloy nanoparticles
Nano nickel (Ni) and its alloys with iron (Fe) based on compositions Ni20Fe80, Ni50Fe50 and Ni80Fe20 were prepared by a polyol method.21 The first step involves proper mixing of the precursor salts (FeCl2·4H2O and NiCl2·6H2O) in polyethylene glycol (PEG) dispersing media, in a bath sonicator. Throughout the study, the concentration of precursor in the solution was kept at 0.2 M and the pH was kept in the range of 10 to 11 by adding sodium hydroxide before proceeding to the reduction process. Then the PEG metal salt solution was heated to 200 °C for 30 min, to remove moisture trapped in the mixture. Finally, the mixture was further reflexed at 300 °C for 2 h with constant stirring. The mixture was subsequently washed with water and ethanol to remove the filtrate. The residue after repeated washing was collected and kept in a vacuum oven overnight to get the dry precursor powder. Final annealing (at T = 600 °C) was performed in a tube furnace under a hydrogen atmosphere for 3 h, to yield the phase pure metal and its alloys in nano powder form. A similar polyol procedure was also adopted for the preparation of iron nanoparticles from iron chloride but ended up in an iron oxide (Fe2O3) rich phase and the product showed exaggerated grain growth during hydrogen annealing with micron-sized particles. It is common practice to use a polyol method for the production of iron oxide from a precursor salt,22–25 whereas only a few reports are available on iron nanoparticle synthesis, with modified synthesis procedures. This is because the polyol reduction process, where polyethylene glycol acts as a reductant as well as a surface protecting agent for Ni–Fe compounds, is inefficient to prevent the oxidation of iron. The concentration of oxide phase will depend upon the reducibility of the polyols.2.2 Characterization
The phase formation and crystal structure of the Ni and NiFe alloys were identified by X-ray diffraction analysis using nickel-filtered CuKα radiation (PANalytical X’Pert PRO diffractometer, Netherlands). The microstructures of the annealed samples were analyzed using a scanning electron microscope (SEM) (Jeol Model, JSM 5600LV). The morphology and size of the grains were directly investigated by high-resolution transmission electron microscopy – HR-TEM (FEI Tecnai G2 30S-TWIN, FEI Co., Hillsboro, OR, USA). Energy dispersive spectroscopy was carried out to analyze the elemental composition. The chemical composition was analyzed using X-ray Photoelectron Spectroscopy (XPS) (PHI 500 Versa Probe 2 with Al Kα radiation). The Ni and NiFe alloys were uniaxially pressed (at ∼100 MPa) into rectangular sheets/blocks for electric, magnetic and electromagnetic characterization. These samples were subsequently sintered at 600 °C for 3 h in a H2 atmosphere, in order to improve their densification and mechanical strength. The DC conductivity of the sheet samples was measured using a four probe method from the current and voltage relationships using a current source (Aplab 9710 P) and a nanovoltmeter (Keithley 2182 A). The magnetic properties of the samples were measured using a VSM probe in a physical property measurement system (PPMS, Quantum Design Inc., USA). Here, the magnetic field was varied from −5 T to +5 T at 300 K and the magnetization of the samples was studied. M–T measurements were carried out for a temperature range of 300 K to 900 K at a magnetic field of 200 Oe.The electromagnetic characterisation of the Ni and NiFe alloys was performed at the microwave frequency range, using a rectangular transmission waveguide technique. For this, the dimension of the samples for the Ku-band (12.4–18 GHz) is 15.80 × 7.90 mm. The required level of machining was carried out using a Struers polishing machine (Struers Tegramin – 25) to make the sample suitably fit into the waveguide coupled to a vector network analyser (VNA) (Agilent E5071C). Appropriate calibrations were carried out before the measurement, to eliminate the errors due to directivity, source match, load match, isolation, etc. The magnitude of the complex scattering parameters (S11 and S21) of the machined metallic samples was measured using a vector network analyser. From the measured scattering data, the EMI shielding effectiveness (EMI SE), absorption shielding effectiveness (SEA) and reflection shielding effectiveness (SER) were calculated.
3. Results and discussion
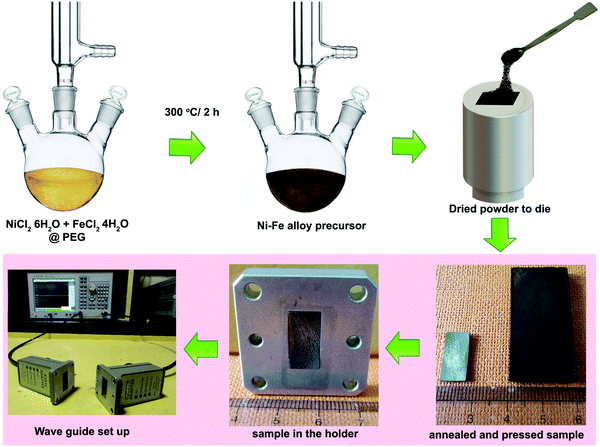
Fig. 1 briefly describes the main steps in preparing the EMI shielding nanopowders, starting from precursors to the development of machined compacts suitable for transmission waveguide shielding measurement. No inert atmosphere was employed during powder synthesis except annealing of the powder later after compaction, which was carried out at 600 °C in hydrogen.3.1 Structural and morphological analysis
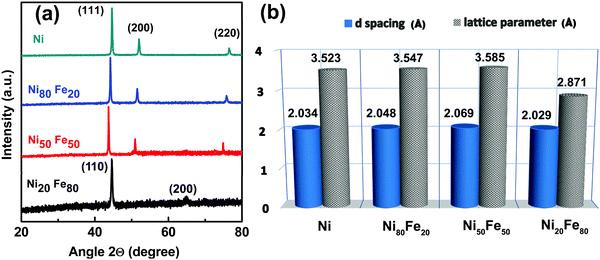
 for an fcc structure and
  for a bcc structure.26 The average lattice parameter increases from a = 3.523 Å for Ni to a = 3.547 Å for permalloy as the atomic radius for Fe is greater than that for Ni. The same trend continues as there is an increase in lattice parameter to 3.585 for Ni50Fe50. For Ni20Fe80, there is a visible transition from fcc to bcc structure corresponding to a Fe rich phase as observed from the XRD pattern. Clearly, the diffraction line (111) has shifted to higher 2θ angles as a consequence of decreased d-spacing since the unit cell lattice accommodated a higher percentage of iron. Furthermore, the diffraction line (200) at 2θ ∼ 51.9° disappeared when x = 50 changes to x = 80 in Ni100−xFex, while another peak corresponding to the bcc structure of Fe arose at 65°. The peaks at 2θ ∼ 44.5° and 65° respectively correspond to (110) and (200) planes of the bcc structured Fe. The lattice parameter showed a rapid decrease with fcc to bcc transition. The variation of the lattice parameter and d-spacing for different percentages of iron addition is plotted in Fig. 2(b).
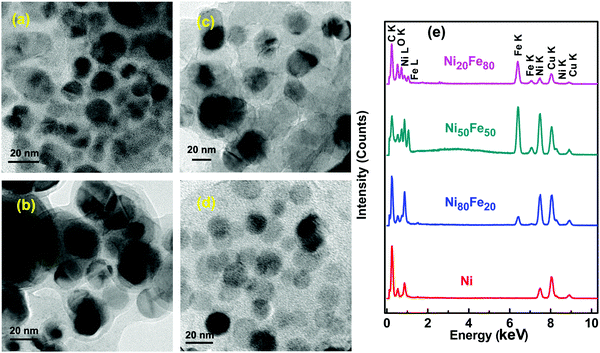
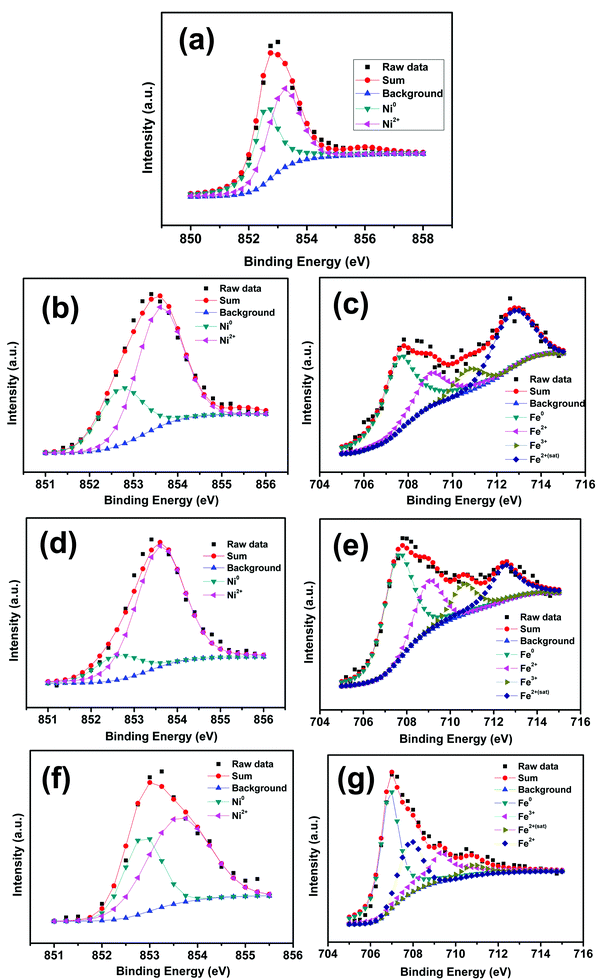
Fig. 4(a) depicts the binding energy spectrum of the pure nickel sample. The peak at 852.7 eV corresponds to the pure Ni (Ni0) which is in agreement with literature data.30 The oxide peak at 853.6 eV can be attributed to the Ni2+ oxidation state.31 The same peaks are observed in the case of Ni 2p3/2, of the rest of the nickel–iron alloys series (Ni80Fe20, Ni50Fe50 and Ni20Fe50). In the case of Fe 2p3/2, the apparent peak position (707.6 eV) is believed to be shifted marginally from that of the pure Fe, which was reported to have a peak at 706.9 eV.32 The energy shift can be attributed to the electron charge transfer between nickel and iron in the alloy combination.33 The rest of the fitted peaks at 709, 710.6 and 712.5 eV, which corresponds to Fe2+, Fe3+ and Fe2+ satellite peaks, are concurrent with observed values in the literature.34 The existence of Ni0 and Fe0 peaks in all the nickel–iron alloy combinations reiterates the fact that the oxide layer is marginally lighter. On a closer examination of the XPS results, it can be concluded that, in the polyol synthesis of ferromagnetic metals and alloys, a thin oxide layer formation is inevitable under ordinary synthesis conditions. This oxide layer is vaguely visible in TEM images (see Fig. 3), which further confirms the above observation.
3.2 Magnetic properties
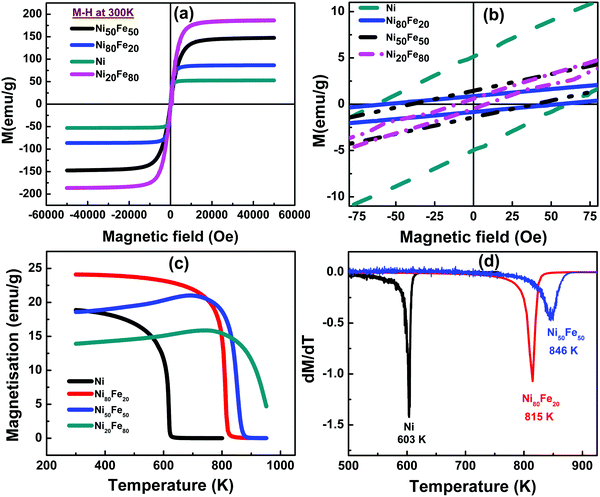
The magnetic properties of the nanostructured nickel alloys suffer dramatic changes compared to the bulk, which is mainly due to the variations in the domain structure. Obviously, at the nanometre scale, the magnetic anisotropy energy, dipolar interactions, and packing density play crucial roles consequent to the transition to a single domain regime.35 High saturation magnetization (Ms) and low coercivity (Hc) are characteristic features that promote the deployment of NiFe alloys in various soft magnetic applications.36 EMI shielding also demands the same properties and hence magnetic characteristics are studied for different NiFe compositions. Fig. 6(a) illustrates the dependence of magnetization of Ni and NiFe alloys, on the applied magnetic field at 300 K. Magnetic measurements were performed for a magnetic field sweep between −5 T and 5 T for all the samples. Application of a magnetic field causes spins to align parallel to the field. When the field is reduced, there occurs a remnant magnetization even when the applied magnetic field reaches zero and the field required to bring the magnetization to zero is called the coercive field (Hc). As reported in the earlier literature, spherical ferromagnetic particles exhibit the same amount of magnetization in all directions and there is no shape anisotropy.37 As shown in Fig. 6(c), the magnetization (Ms) is highest for Ni20Fe80 and lowest for Ni. Also one can notice from Table 1 that the Ms value of 52 emu g−1 for Ni monotonically increased to 185 emu g−1 for the Fe rich alloy combination i.e., Ni20Fe80. The increase of Ms with an increase in the molar concentration of Fe is due to the high inherent magnetization possessed by Fe.21 The increased magnetization could be established by the Slater–Pauling curve.26| Material | Magnetic saturation Ms (emu g−1) | Coercivity Hc (Oe) | Curie temperature (K) |
|---|---|---|---|
| Ni | 52.90 | 62 | 603 |
| Ni80Fe20 | 86.52 | 54 | 815 |
| Ni50Fe50 | 147.50 | 38 | 846 |
| Ni20Fe80 | 186.60 | 10 | Beyond measurable range |
Fig. 6(c) depicts the M–T curve of nickel and nickel–iron alloy nanoparticles. The low-temperature behaviour of ferromagnetic materials could be specified by Bloch's equation,38
| M(T) = M(0)(1 − BTλ) | (1) |
The Curie temperature (Tc) of the spherical nickel particles is found to be 603 K which is actually less than the reported Tc for bulk Ni (627 K). The reduction in Curie temperature can be attributed to increase in the disorder of magnetic moments as well as the increase in the number of interfaces with the size reduction. Hence the thermal energy may overcome the magnetic ordering at a still lower temperature than for the bulk nickel (627 K). A Tc of 871 K was reported for the bulk Ni80Fe20 while in the present study, Tc obtained is 815 K.39 For higher iron substituted alloys, Curie temperature could not be estimated, since the ferro to paramagnetic transition is expected to occur above 1000 K, which is beyond the measurable temperature range of the PPMS set-up used.
In general, two factors that are found to influence the coercivity of ferromagnetic nanoparticles are (i) diameter of the particles and (ii) inter-particle interaction.37 Furthermore, coercivity also depends on the shape anisotropy constant of the nanostructure. The dependence of the coercivity of the nanoparticles on the diameter of the particle and the critical radius,38Rc is defined by
| Rc = (kA/μ0Ms2)1/2 | (2) |
3.3 Electrical properties
For developing high-performance EMI shielding materials, excellent electrical conductivity is a desirable factor. The electrical conductivity of the synthesized samples at room temperature was studied using a four probe method. As shown in Fig. 7(a), the I–V plots are linear, which is characteristic of conductors and alloys. From the slope of the I–V plot, the resistance (R) was estimated and the dc electrical conductivity (σ) could be derived from the relation, | (3) |
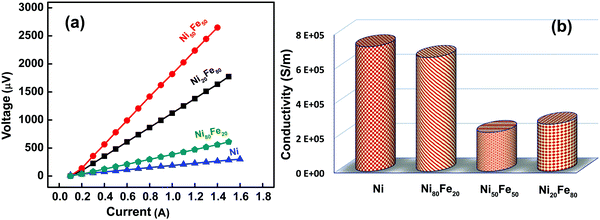 | ||
| Fig. 7 (a) I–V plot of Ni and NiFe alloy compositions and (b) DC electrical conductivity data of Ni, Ni80Fe20, Ni50Fe50 and Ni20Fe80. | ||
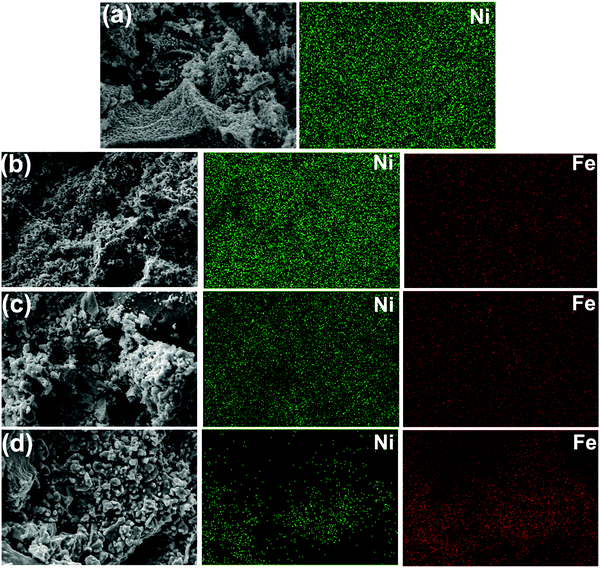
The electrical conductivities of Ni and its alloys are given in Table 2. All the observed conductivities were on the order of 105 S m−1, but this is two orders less than their bulk counterparts.42 This fall in conductivity could be explained based on finite size effects. As is well known, the small particle size and the resultant increased number of interfaces give rise to higher surface scattering rates. This in turn increases the mean free path for conduction electrons in the system and reduces the conductivity. Another contributing factor is the chances of surface oxidation in nickel and nickel–iron alloy nanoparticles, whose oxides are largely semiconducting. Oxide formation in polyol synthesis is inevitable since, during post-reaction processing, large amounts of the free surface are available to interact with oxygen under ambient conditions. As shown, there is a decrease in the conductivity value with Fe addition to pure Ni, which reached a minimum for the Ni50Fe50 composition (2.26 × 10⁵ S m−1) and again showed a slight improvement for Ni20Fe80. Here we have to consider the fact that Fe is more prone to oxidation and corrosion than Ni, which can be reflected in the dc conductivity of the NiFe alloys. As shown in Fig. 3, there are slight variations in the particle size distribution for different compositions synthesized in the present study. So far as conducting composites are concerned, the connectivity of conducting fillers plays a critical role in EMI attenuation. In such cases, a well-connected microstructure is preferred for high conductivity which will eventually create a micro current under the influence of an electromagnetic field. In the case of conducting composites of CNT and graphene, hopping and migrating electrons make the way for conduction,43,44 whereas the present system consists of pure metals and alloys. Here, the abundance of free electrons paves the way for migration of charge carriers since the conductivity is dictated by the density and mobility of charge carriers. On the other hand, poor densification may adversely affect the conductivity and EMI shielding efficiency of the system, since more porosity means less connectivity. Evidently, the SEM morphological analysis of heat treated Ni and its Fe alloys as depicted in Fig. 5, present well-connected structures with few pores, which may contribute to an enhancement in the electron flow and generation of micro-current under the EM field. It should also be noted that a visible enhancement in the imaginary part of the permittivity can also indirectly point to an enhancement in the EMI shielding effectiveness.45,46
| Composition | Resistivity (Ω m) | Conductivity (S m−1) |
|---|---|---|
| Ni | 1.39 × 10⁻⁶ | 7.22 × 10⁵ |
| Ni80Fe20 | 1.52 × 10⁻⁶ | 6.60 × 10⁵ |
| Ni50Fe50 | 4.42 × 10⁻⁶ | 2.26 × 10⁵ |
| Ni20Fe80 | 3.65 × 10⁻⁶ | 2.74 × 10⁵ |
3.4 EMI shielding effectiveness
The measure of electromagnetic (EM) wave shielding performance of a material is always expressed in terms of its EMI shielding effectiveness (EMI SE). When an EM wave passes through a material, some part of it gets reflected, a part gets absorbed while a portion undergoes multiple internal reflections.47,48 For effective EMI shielding, the shield should ideally possess either mobile charge carriers, or either electric or magnetic (or both) dipoles that interact with the E and H vectors of the incident EM radiation. In conductive materials, the principal mechanism is reflection where the shield has an abundance of mobile charge carriers that interact with the electromagnetic fields in the radiation. For effective absorption shielding to take place, the target material should possess an electric and magnetic field associated with it. In that sense, ferromagnetic metals and alloys are of great importance.The S parameters (S11 and S21) of the composites were determined using a vector network analyzer. From the reflection and absorption scattering parameters, the reflectance and transmittance can be derived from the relations, R = |S11|2 and T = |S21|2. The absorption coefficient (A) was obtained from the relation, A + R + T = 1. Here A, R and T are the absorption, reflection and transmission coefficients, respectively, which represent the response of the materials towards the incident wave, i.e. the percentage of absorption, reflection, and transmission.
In the present case, Ni metal nanoparticles showed a fluctuating nature in the transmission, reflection and absorption coefficients throughout the Ku band (see Fig. 8). The high absorption coefficient and lower reflection coefficient values can be attributed to the high conducting nature as well as the slight oxide layer on the surface of Ni. A visibly high reflection coefficient and very low transmission coefficient were observed for the permalloy composition. Obviously, its high dc electrical conductivity (see Table 2) and permeability were favorable for achieving good reflection and absorption parameters. Interestingly, the rest of the NiFe alloys also showed consistently high reflection and absorption coefficients with the lowest transmission coefficient, throughout the Ku band. It is believed that the free electrons in the ferromagnetic metal will facilitate the reflection possible at the surface and the high value of R is proof of its promising reflection shielding parameters. The lower T and better A values showed the capability of the alloy samples for the absorption of EM waves inside the material.
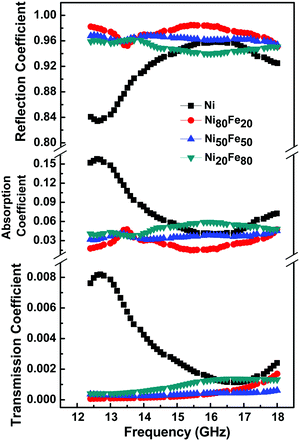 | ||
| Fig. 8 Transmission, absorption and reflection coefficients of Ni and Ni100−xFex [x = 20, 50 and 80] alloys. | ||
The total shielding effectiveness is the sum of reflection and absorption shielding effectiveness.49,50 The reflection shielding efficiency (SER) and transmission shielding efficiency (SEA) are calculated from the reflection and transmission coefficients as given below;51
 | (4) |
 | (5) |
Since SEM is negligible in the present case where the shielding test specimen is a densified alloy block with sufficient thickness (∼1 mm), the final equation will be SET = SER + SEA.
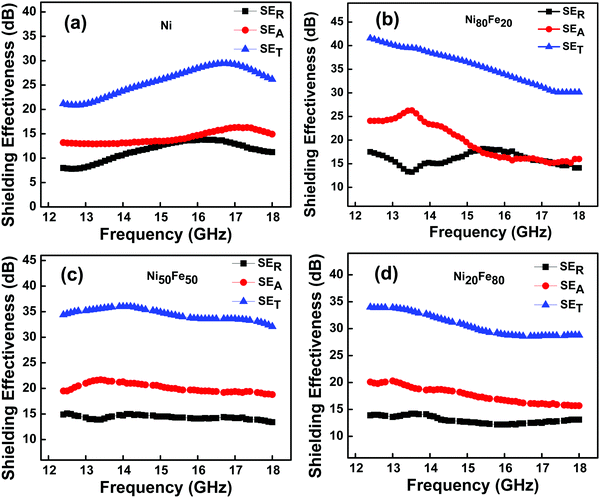
The frequency variation of the SER, SEA, and SET of nano Ni and NiFe alloy in the Ku band frequency range (12.4–18 GHz) is given in Fig. 9. Nickel, the parent material in this study, showed an overall shielding in the range of −21 to −29 dB, at a sample thickness of 1 mm. It is understood that both reflection and absorption components have contributed to shielding effectiveness. Here, the contribution from absorption is −13 to −16 dB while that of reflection is −8 to −13 dB. Interestingly, alloys between Ni and Fe were observed to be better candidates for shielding EM waves than intrinsic Ni. For example, the permalloy composition Ni80Fe20 showed the highest shielding value of ∼−41 dB at the beginning of the Ku band (see Fig. 9(b)) and the total shielding effectiveness falls to −30 dB when the frequency is increased from 12.4 to 18 GHz. Here the shielding mechanism is primarily contributed by absorption shielding. As given, the value for absorption shielding is in the range −16 to −26 dB while reflection shielding is in the range −14 to −18 dB, during the entire frequency band. The reason for high shielding effectiveness originates from the inherent nature of permalloy nano particles having higher permeability, in addition to good electrical conductivity.
In all the studied samples of Ni and its Fe alloys, the microwave attenuation is contributed by absorption and reflection, though with varying extents. Since the studied materials are conducting as well as magnetic, both dielectric loss and magnetic loss factors are active contributors towards net shielding. Reflection being the primary mechanism in metal-based shielding can be explained on the basis of abundance of free electrons for electrical conduction. The appreciably good electrical conductivity results in the lowering of the skin depth, which in turn makes the EM waves reflect at the surface between the materials and air. Also it creates a micro-current inside the conductor while interacting with the EM wave, which may help to increase the loss factor and imaginary part of the permittivity determined by the orientational relaxation loss of intrinsic dipoles and electrical conductivity.52 Considering absorption shielding, the impedance matching conditions are vital at the interfaces between the material and air.53 Here in the present case, since the surface of the nanoparticles possess a thin oxide layer, it will provide the required impedance matching conditions at the interface for the incoming EM waves. It was reported in the literature that NiO can improve the dielectric properties of microwave absorbing materials due to its high permittivity and electronic properties.45 For a perfect magnetic shielding material, the perfect synergy of dielectric loss and magnetic loss is an essential strategy for maximum attenuation.54 Since the synthesized alloys possess high electrical conductivity, it may help to enhance the dielectric loss factor, according to Debye theory.55 So, it is likely that ideal synergy conditions like a combination of high conductivity, better permeability and impedance matching conditions might have contributed to the enhanced microwave absorption in the present batch of nickel and its alloys.
A relation connecting SEA, SER, dc electrical conductivity (σ), frequency (f), permeability (μ) and thickness (t) is shown;56,57
 | (6) |
 | (7) |
Here in Table 3, a literature study of EMI shielding using Ni or NiFe alloys, from the year 2008 onwards, is given. Those studies which include a combination of ferromagnetic Ni/NiFe alloys with a conducting material, are excluded from the current survey, as the latter will have an effect on their total EMI shielding values. The EMI shielding effectiveness of the highest shielding materials is summarized in Fig. S5 (ESI†). Here it should be noted that the EMI shielding of composites is excluded from this plot as well. As shown in Table 3, all the NiFe alloys developed in the present study are found to be ideal for shielding purposes with SE values above −30 dB. Furthermore, a still better shielding of over −30 to −41 dB was achieved for the permalloy composition even at a smaller thickness of 1 mm, throughout the Ku band.
| Sl no. | Material | Method | Frequency range/method of EMI measurement | SE (dB) | Thickness (mm) | Ref. |
|---|---|---|---|---|---|---|
| 1 | Core/shell-type iron and nickel nanoparticles | DC arc discharge method | 2–18 GHz/coaxial | >−30 dB (9 to 10 GHz) | 1.7 | 58 |
| 2 | Ni films deposited on cenosphere particles | Ultrasonic-assisted magnetron sputtering | 80–110 GHz/coaxial | 4–27 dB (80 to 100 GHz) | 60 | 59 |
| 3 | Fe50Ni50 powder | Mechanical milling | 0.1–18 GHz/coaxial | >−10 dB (@0.8–1.8 GHz) | 2.5–1.2 | 60 |
| 4 | Hexagonal Ni/Ni(OH)2 heterogeneous structure plates | Hydrazine reduction | 2–18 GHz/coaxial | >−20 dB (@9–10 GHz) | 2 | 61 |
| 5 | Ni–Fe alloy on the helical microorganism cells | Electroplating | 2–18 GHz/coaxial | −10 to −10.6 dB | 1 to 1.5 | 62 |
| 6 | Fe–40 wt% Ni alloys with granular and flake shape | Mechanical alloying and annealing method | 0.5–4 GHz/coaxial | >−20 dB (0.5–1 GHz) | 4–5 | 63 |
| 7 | Fe–50 wt% Ni alloy | High frequency induction melting followed by gas atomization | 1–18 GHz/coaxial | −6 dB (1–2 Hz) | 3 | 8 |
| 8 | Ni@Ni2O3 core–shell particles | Hydrogen peroxide oxidation method | 0.1–18 GHz/coaxial | >−20 dB (4 GHz & 12.6 GHz) | 1.8–4.3 | 64 |
| 9 | Ni nanoparticles | Polyol route | 12.4–18 GHz/wave guide | −21 to −29 dB (12.4–18 GHz) | 1 | Present work |
| 10 | Ni80Fe20 alloy nanoparticles | Polyol route | 12.4–18 GHz/wave guide | −30 to −41 dB | 1 | Present work |
| 11 | Ni50Fe50 alloy nanoparticles | Polyol route | 12.4–18 GHz/wave guide | −32 to −36 dB | 1 | Present work |
| 12 | Ni20Fe80 alloy nanoparticles | Polyol route | 12.4–18 GHz/wave guide | −28 to −34 dB | 1 | Present work |
4. Conclusions
Nickel NPs and their alloys with different molar ratios of iron were synthesized using a simple, surfactant-free polyol method, using a high boiling point solvent, PEG. The concentration of the reactants was kept constant throughout the whole composition range of NiFe. From the TEM analysis, the uniform spherical nature of nickel and its alloys were confirmed with an average size range of 10–30 nm. A thin oxide layer is vaguely visible in the TEM and the EDAX spectrum showed the presence of oxygen in the spectra. The XPS analysis further confirmed the formation of an oxide layer associated with the nickel and its alloys that ensures prevention of further oxidation and good impedance matching conditions. A saturation magnetization (Ms) of 52 emu g−1 is observed for Ni NPs with a coercivity (Hc) range of 62 Oe. Furthermore, increasing Fe concentration in the alloys results in an increasing trend in Ms while Hc decreases proportionally. The decrease in coercivity as a function of Fe content may be due to magnetostatic interparticle interactions wherein the magnetic particles exert a field around their neighbouring particles, which assists them to be magnetized using a lesser field than what is actually required. Since the packing density increases with Fe addition in the present study, the interparticle interaction increases, hence lowering the coercivity results. The dc electrical resistivity was shown to be lowest for the Ni80Fe20 (permalloy) combination, and further increment in the Fe content helps the resistivity to increase. This trend is believed to be due to the oxidative corrosion of the Fe rich alloys where electrons have to hop at larger scales to enable conduction. The pressed precursor powder in a rectangular die was annealed at 600 °C in a H2 atmosphere to fabricate thin sheets of the metal alloy samples of suitable dimensions for EMI shielding studies in the Ku band (12.4–18 GHz). The densified and hydrogen annealed samples displayed excellent microwave shielding properties ranging from −21 to −41 dB in the entire Ku bands. The lowest EMI shielding range of −21 to −29 dB was observed in the case of Ni NPs whereas the highest range was attained in permalloy (−30 to −41 dB). The rest of the NiFe combinations showed intermediate shielding effectiveness between that of Ni and permalloy. Of the total shielding of −30 to −41 dB for permalloy, a major portion was contributed by the absorption shielding (−16 to −26 dB) and the reflection shielding value is in the range of −14 to −18 dB. Unlike the parent Ni, all other NiFe alloy combinations showed EMI shielding above 30 dB, with significant enhancements in the absorption shielding efficiency. To the best of our knowledge, no other previous studies on nanostructured NiFe alloys have indicated a consistent EMI shielding performance (>−30 dB) throughout the Ku band (12.4–18 GHz). This high value of shielding efficiency above 99.9% suggests the possible commercial applicability of nano permalloy based coatings and composite structures, for magnetic shielding applications in systems like aviation radars, video displays, magnetic proximity sensors, audio-visual recorders etc.Conflicts of interest
There are no conflicts to declare.Acknowledgements
One of the authors, K. S. Dijith, is thankful to University Grants Commission, New Delhi for the financial support (No. 18-12/2011(ii)EU-V). The author, K. P. Surendran, would like to acknowledge the Indo-Portuguese bilateral project (INT/Portugal/P-09/2013). The authors are also thankful to Ajeesh Paulose for magnetic measurements and P. Prabhakar Rao for extending XRD, SEM and XPS facilities.References
- X. C. Tong, Advanced Materials and Design for Electromagnetic Interference Shielding, 2009 Search PubMed.
- M. Cao, C. Han, X. Wang, M. Zhang, Y. Zhang, J. Shu, H. Yang, X. Fang and J. Yuan, J. Mater. Chem. C, 2018, 6, 4586–4602 RSC.
- M. Cao, X. Wang, W. Cao, X. Fang, B. Wen and J. Yuan, Small, 2018, 1800987 CrossRef PubMed.
- W. Q. Cao, X. Wang, J. Yuan, W. Z. Wang and M. S. Cao, J. Mater. Chem. C, 2015, 3, 10017–10022 RSC.
- F. Shahzad, M. Alhabeb, C. B. Hatter, B. Anasori, S. Man Hong, C. M. Koo and Y. Gogotsi, Science, 2016, 353, 1137–1140 CrossRef PubMed.
- R. Kumaran, M. Alagar, S. Dinesh Kumar, V. Subramanian and K. Dinakaran, Appl. Phys. Lett., 2015, 107, 113107 CrossRef.
- G. W. Qin, W. L. Pei, Y. P. Ren, Y. Shimada, Y. Endo, M. Yamaguchi, S. Okamoto and O. Kitakami, J. Magn. Magn. Mater., 2009, 321, 4057–4062 CrossRef.
- Y. Feng and T. Qiu, J. Magn. Magn. Mater., 2012, 324, 2528–2533 CrossRef.
- C. N. R. Rao, H. S. S. Ramakrishna Matte, R. Voggu and A. Govindaraj, Dalton Trans., 2012, 41, 5089–5120 RSC.
- K. Gheisari, S. Shahriari and S. Javadpour, J. Alloys Compd., 2013, 574, 71–82 CrossRef.
- Z. Liu, S. Li, Y. Yang, S. Peng, Z. Hu and Y. Qian, Adv. Mater., 2003, 15, 1946–1948 CrossRef.
- Z. Zhong, Y. Mastai, Y. Koltypin, Y. Zhao and A. Gedanken, Chem. Mater., 1999, 11, 2350–2359 CrossRef.
- I. Ban, M. Drofenik and D. Makovec, J. Magn. Magn. Mater., 2006, 307, 250–256 CrossRef.
- Y. J. Suh, H. D. Jang, H. Chang, W. B. Kim and H. C. Kim, Powder Technol., 2006, 161, 196–201 CrossRef.
- H. Dong, Y. C. Chen and C. Feldmann, Green Chem., 2015, 17, 4107–4132 RSC.
- G. Viau, F. Fiévet-Vincent and F. Fiévet, Solid State Ionics, 1996, 84, 259–270 CrossRef.
- C. Liu, X. Wu, T. Klemmer, N. Shukla, X. Yang, D. Weller, A. G. Roy, M. Tanase and D. Laughlin, J. Phys. Chem. B, 2004, 108, 6121–6123 CrossRef PubMed.
- R. J. Joseyphus, K. Shinoda, D. Kodama and B. Jeyadevan, Mater. Chem. Phys., 2010, 123, 487–493 CrossRef.
- K. J. Carroll, J. U. Reveles, M. D. Shultz, S. N. Khanna and E. E. Carpenter, J. Phys. Chem. C, 2011, 115, 2656–2664 CrossRef.
- G. G. Couto, J. J. Klein, W. H. Schreiner, D. H. Mosca, A. J. A. de Oliveira and A. J. G. Zarbin, J. Colloid Interface Sci., 2007, 311, 461–468 CrossRef PubMed.
- M. N. Islam, M. Abbas and C. Kim, Curr. Appl. Phys., 2013, 13, 2010–2013 CrossRef.
- N. V. Long, Y. Yang, C. M. Thi, L. H. Phuc and M. Nogami, J. Electron. Mater., 2017, 46, 3615–3621 CrossRef.
- N. V. Long, Y. Yang, M. Yuasa, C. M. Thi, Y. Cao, T. Nann and M. Nogami, RSC Adv., 2014, 4, 8250–8255 RSC.
- C. K. Mohamed Abbas, B. Parvatheeswara Rao, S. M. Naga and M. Takahashi, Ceram. Int., 2013, 39, 7605–7611 CrossRef.
- B. Zhang, Z. Tu, F. Zhao and J. Wang, Appl. Surf. Sci., 2013, 266, 375–379 CrossRef.
- N. Guechi, A. Bourzami, A. Guittoum, A. Kharmouche, S. Colis and N. Meni, Phys. B, 2014, 441, 47–53 CrossRef.
- P. R. Sajanlal and T. Pradeep, Nanoscale, 2012, 4, 3427–3437 RSC.
- A. Lamberto Duo, M. Finazzi and F. Ciccacc, Magnetic Properties of Antiferromagnetic Oxide Materials – Surfaces, Interfaces, and Thin Films, John Wiley & Sons, 2010 Search PubMed.
- W. Cheng, J. He, T. Yao, Z. Sun, Y. Jiang, Q. Liu, S. Jiang, F. Hu, Z. Xie, B. He, W. Yan and S. Wei, J. Am. Chem. Soc., 2014, 136, 10393–10398 CrossRef PubMed.
- J. C. Fuggle, F. U. Hillebrecht, R. Zeller, Z. Zo and P. A. Bennett, Phys. Rev. B: Condens. Matter Mater. Phys., 1983, 27, 2145–2178 CrossRef.
- D. T. Nguyen, A. Ferrec, J. Keraudy, A. Goullet, L. Cattin, L. Brohan and P. Jouan, Surf. Coat. Technol., 2014, 250, 21–25 CrossRef.
- Xi Li, H. Zhang, X. Liu, S. Li and M. Zhao, Mater. Chem. Phys., 1994, 38, 355–362 CrossRef.
- M. Salou, B. Lescop, S. Rioual, A. Lebon, J. Ben Youssef and B. Rouvellou, Surf. Sci., 2008, 602, 2901–2906 CrossRef.
- T. Yamashita and P. Hayes, Appl. Surf. Sci., 2008, 254, 2441–2449 CrossRef.
- B. D. Cullity and C. D. Graham, Introduction to Magnetic Materials, John Wiley & Sons, Hoboken, New Jersey, 2009 Search PubMed.
- F. Pfeifer and C. Radeloff, J. Magn. Magn. Mater., 1980, 19, 190–207 CrossRef.
- N. A. Spaldin, Magnetic Materials Fundamentals and Applications, Cambridge University Press, New York, 2010 Search PubMed.
- M. Zheng, L. Menon, H. Zeng, Y. Liu, S. Bandyopadhyay, R. D. Kirby and D. J. Sellmyer, Phys. Rev. B: Condens. Matter Mater. Phys., 2000, 62, 12282–12286 CrossRef.
- R. J. Wakelin and E. L. Yates, Proc. Phys. Soc., London, Sect. B, 1953, 66, 221–240 CrossRef.
- X. He, W. Zhong, C. T. Au and Y. Du, Nanoscale Res. Lett., 2013, 8, 446 CrossRef PubMed.
- R. H. Yu, S. Basu, Y. Zhang, A. Parvizi Majidi and J. Q. Xiao, J. Appl. Phys., 1999, 85, 6655–6659 CrossRef.
- A. Fert and I. A. Campbell, J. Phys. F: Met. Phys., 1976, 6, 849–871 CrossRef.
- M. Cao, J. Yang, W. Song, D. Zhang, B. Wen, H. Jin, Z. Hou and J. Yuan, ACS Appl. Mater. Interfaces, 2012, 4, 6949–6956 CrossRef PubMed.
- M. M. Lu, M. S. Cao, Y. H. Chen, W. Q. Cao, J. Liu, H. L. Shi, D. Q. Zhang, W. Z. Wang and J. Yuan, ACS Appl. Mater. Interfaces, 2015, 7, 19408–19415 CrossRef PubMed.
- H. Yang, M. Cao, Y. Li, H. Shi, Z. Hou, X. Fang, H. Jin, W. Wang and J. Yuan, Adv. Opt. Mater., 2014, 2, 214–219 CrossRef.
- B. Wen, M. Cao, M. Lu, W. Cao, H. Shi, J. Liu, X. Wang, H. Jin, X. Fang, W. Wang and J. Yuan, Adv. Mater., 2014, 26, 3484–3489 CrossRef PubMed.
- K. S. Dijith, S. Pillai and K. P. Surendran, J. Electron. Mater., 2017, 46, 5158–5167 CrossRef.
- B. W. Li, Y. Shen, Z. X. Yue and C. W. Nan, Appl. Phys. Lett., 2006, 89, 132504 CrossRef.
- P. Saini, V. Choudhary, B. P. Singh, R. B. Mathur and S. K. Dhawan, Mater. Chem. Phys., 2009, 113, 919–926 CrossRef.
- N. Joseph, J. Varghese and M. T. Sebastian, J. Mater. Chem. C, 2016, 4, 999–1008 RSC.
- K. S. Dijith, S. Pillai and K. P. Surendran, Surf. Coat. Technol., 2017, 330, 34–41 CrossRef.
- J. Liu, M. S. Cao, Q. Luo, H. L. Shi, W. Z. Wang and J. Yuan, ACS Appl. Mater. Interfaces, 2016, 8, 22615–22622 CrossRef PubMed.
- C. Zhao, Y. Yu, Z. Chen, G. Wen, F. Wei, Q. Zheng, C. Wang and X. Xiao, Carbon, 2013, 65, 124–139 CrossRef.
- X. L. Shi, M. S. Cao, J. Yuan and X. Y. Fang, Appl. Phys. Lett., 2009, 95, 10–13 Search PubMed.
- M. S. Cao, W. L. Song, Z. L. Hou, B. Wen and J. Yuan, Carbon, 2010, 48, 788–796 CrossRef.
- G. S. Kumar, D. Vishnupriya, A. Joshi, S. Datar and T. U. Patro, Phys. Chem. Chem. Phys., 2015, 17, 20347–20360 RSC.
- Y. Xu, Y. Li, W. Hua, A. Zhang and J. Bao, ACS Appl. Mater. Interfaces, 2016, 8, 24131–24142 CrossRef PubMed.
- B. Lu, X. L. Dong, H. Huang, X. F. Zhang, X. G. Zhu, J. P. Lei and J. P. Sun, J. Magn. Magn. Mater., 2008, 320, 1106–1111 CrossRef.
- X. Yu and Z. Shen, J. Magn. Magn. Mater., 2009, 321, 2890–2895 CrossRef.
- J. Wei, Z. Zhang, B. Wang, T. Wang and F. Li, J. Appl. Phys., 2010, 108, 123908 CrossRef.
- C. Wang, X. Han, P. Xu, J. Wang, Y. Du, X. Wang, W. Qin and T. Zhang, J. Phys. Chem. C, 2010, 114, 3196–3203 CrossRef.
- M. Lan, D. Zhang, J. Cai, W. Zhang and L. Yuan, J. Magn. Magn. Mater., 2011, 323, 3223–3228 CrossRef.
- J. Liu, Y. Feng and T. Qiu, J. Magn. Magn. Mater., 2011, 323, 3071–3076 CrossRef.
- B. Wang, J. Zhang, T. Wang, L. Qiao and F. Li, J. Alloys Compd., 2013, 567, 21–25 CrossRef.
Footnote |
| † Electronic supplementary information (ESI) available: Low resolution TEM micrographs, low and high magnification SEM micrographs of fractured surface and XPS survey spectrum of Ni, Ni80Fe20, Ni50Fe50 and Ni20Fe80. A plot of high performance shielding materials. See DOI: 10.1039/c8qm00264a |
| This journal is © the Partner Organisations 2018 |

