Ultrasensitive detection of seventeen chemicals simultaneously using paper-based sensors†
Zhongxing
Wang
ab,
Li
Sun
c,
Liqiang
Liu
 ab,
Hua
Kuang
 *ab,
Liguang
Xu
*ab and
Chuanlai
Xu
 ab
ab
aState Key Laboratory of Food Science and Technology, Jiangnan University, Wuxi, People's Republic of China. E-mail: kuangh@jiangnan.edu.cn; xuliguang2006@126.com
bInternational Joint Research Laboratory for Biointerface and Biodetection, and School of Food Science and Technology, Jiangnan University, Wuxi, People's Republic of China
cChinese Academy of Inspection and Quarantine, No. 11, Ronghua South Road, Yizhuang Economic and Technological Development Zone, Beijing, 100176, China
First published on 30th July 2018
Abstract
We developed an ultrasensitive gold nanoparticle-based multicomponent lateral-flow strip assay for the simultaneous detection of seventeen hormone drugs from three classes: nandrolone (NR) and its analogues, dexamethasone (DEX) and its analogues, and hexestrol (HES) and its analogues. The antibodies and coating antigens were selected for the assay and the multi-immunochromatographic strip (multi-ICS) exhibited a very low limit of detection (LOD). Quantitative results were obtained using a strip scan reader, giving LOD values of 0.06–4.85 ng mL−1 for NR and its analogues, 0.005–2.85 ng mL−1 for DEX and its analogues, and 0.03–2.14 ng mL−1 for HES and its analogues. The recovery rates from milk samples were 85.8–93.3% for NR, 78.8–87.5% for DEX, and 89.4–99.4% for HES. This multi-ICS assay therefore provides a useful tool for on-site detection and rapid initial screening of hormone drugs in biological samples.
Introduction
Recently, there has been significant interest in point of care (POC) testing, especially in food safety and environmental monitoring.1–3 Among various detection means, paper-based analytical devices are an attractive diagnostic tool for POC testing due to their portability, easy fabrication and operation, low-cost and environmentally friendliness.4–6 Moreover, the excellent physical and chemical properities7–9 of paper provide a convenient access to modify cellulose paper with chemical reagents and biomolecules, which is the main reason why paper sheets are a desired substrate for POC analytical devices. The porous permeability and hydrophilicity generate a capillary action for fluids to flow along the paper sheet and the total process does not require an external pumping source.6,10 Additionally, multi-compound analysis is an important direction in the detection field. The integration of multi-compound analysis and paper-based sensors would drive down the detection costs yet further, and make the analysis easier. Thus, a paper-based sensor that can simultaneously diagnose multiple chemical molecules is the ideal platform to carry out portable and low-cost POC testing in developing countries and resource-limited and remote regions.In this work, we aim to develop a paper-based sensor for the simultaneous detection of multiple chemicals. Hormones were chosen as the analysis targets because of their overuse as veterinary drugs and threat to human health. Steroid hormones are four-ring fatty hydrocarbons containing a cyclopentane polyhydric nucleus and can be grouped into five classes, including glucocorticoids, mineralocorticoids, androgens, estrogens, and progestogens.11,12 In mammals, the steroid hormones are secreted by the adrenal cortex and play an important role in regulating physiological processes and behaviors such as metabolism and reproduction.13,14 Some steroid hormones have roles in inflammation and immune function.15–17 Diethylstilbestrol, hexestrol and dienestrol are synthetic nonsteroidal estrogens that are beneficial for promoting animal growth, preventing premature delivery and treating pregnancy complications.18 Thus, many steroid hormones and non-steroid hormones are widely used in animal feed.19,20 The advantages of the hormones for accelerating growth, increasing yield, and preventing or treating disease, however, are accompanied by an increasing risk from veterinary drug and animal feed residues.19,21,22 Hormones assimilated into the human body from the food chain can produce a range of health problems such as developmental disorders and birth defects. Moreover, most of them are potential human carcinogens. A previous study has reported that multiple hormones represent various effects on many cancers.23 Therefore, to eliminate the illicit use of hormones and resist the diseases caused by hormones, simultaneous detection of these multiple hormones is necessary.
The current analysis of hormones is mainly conducted using instrumental methods.24–29 Although highly accurate and sensitive, these methods are unsuitable for POC testing since the detection speed is slow, the instruments are expensive and professional operators are required. There are also numerous reports on other methods, including enzyme-linked immunosorbent assay (ELISA),30–32 Raman spectroscopy33 and electrochemical sensors,34–37 for detecting hormones. However, a significant disadvantage of these methods is that most of them only target a single hormone or a specific hormone class.
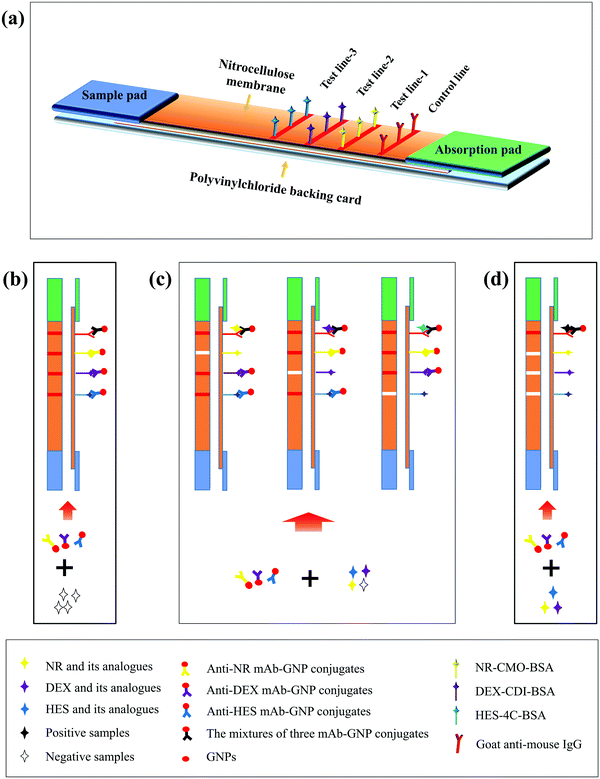
Here, we demonstrate a multi-immunochromatographic strip (multi-ICS) sensor that utilizes a paper platform and an immunoassay, which is suitable for the detection of seventeen hormones in biological samples (Fig. 1). As in the paper platform, we have established a colorimetric signal readout system based on gold nanoparticles. After completing the detection of the biological samples, the colorimetric signals can be preliminarily estimated with the naked eye or quantitatively analyzed with the aid of a portable scan reader. These advantages suggest that the multi-testing method performed on a paper substrate is convenient for the POC testing of multiple chemicals in biological samples.
Results and discussion
Characterization of coating antigens and monoclonal antibodies (mAbs)
As we know, the coating antigens and antibodies play a vital role in the performance of the ICS assay. In our work, the antigens and mAbs not only influenced the sensitivity and color density of the multi-ICS, but also were related to the number of identified drugs. Thus, three coating antigens (NR–CMO–BSA, DEX–CDI–BSA, and HES-4C–BSA, the full names are shown in Table S1, ESI†) were synthesized under the optimum conditions and then characterized by UV spectroscopy. The results are shown in the supporting information. As shown in Fig. S1 (ESI†), there was a clear peak at ∼250 nm in the UV spectrum of NR–CMO, while the spectrum of BSA had an absorption peak at 280 nm. The spectrum of the NR–CMO–BSA conjugate contained the BSA peak and a shifted peak corresponding to NR–CMO. This phenomenon indicated that NR–CMO was successfully conjugated to the protein. Similarly, the syntheses of DEX–CDI–BSA and HES-4C–BSA were also successful.In this study, all hormone drugs were divided into three classes according to the property of each antibody (as shown in Table 1, IC50 and cross-reactivity (CR) values of each mAb were determined using IC-ELISA). The first class was named “NR and its analogues” which included seven chemicals, and all chemicals in this class could be recognized by the anti-NR mAb. The IC50 value of anti-NR mAb to NR was 0.33 ng mL−1 and the CR to our drugs was from 5.3 to 48.5%. The second class “DEX and its analogues” also included seven chemicals, and the IC50 value of anti-DEX mAb to DEX was 0.13 ng mL−1 and the CR to our drugs was from 2.1 to 54.2%. The third class was “HES and its analogues” which included three chemicals, and the IC50 value of anti-HES mAb to HES was 0.21 ng mL−1 and the CR to our drugs was from 15.4 to 50%. The high sensitivity and broad affinity of the mAbs are crucial factors for the simultaneous detection of seventeen targets using one strip. Moreover, each antibody did not cross-react with different classes of hormone. Thus, these available features enabled the simultaneous detection of seventeen hormone drugs with the multi-ICS assay.
| Chemical compound | Abbreviation | Structure | IC50 (ng mL−1) | CR (%) | ||||
|---|---|---|---|---|---|---|---|---|
| NRa | DEX | HES | NR | DEX | HES | |||
| a NR, DEX and HES in this row represent anti-NR mAb, anti-DEX mAb, and anti-HES mAb, respectively. b No cross-reactivity. | ||||||||
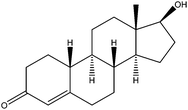
| Nandrolone | NR |
|
0.33 | —b | — | 100 | — | — |
| Testosterone | T |
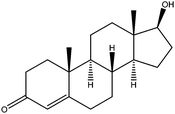
|
0.68 | — | — | 48.5 | — | — |
| Methyl testosterone | MT |
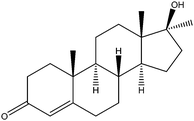
|
2.05 | — | — | 16 | — | — |
| Estradiol | E2 |
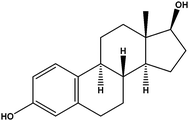
|
1.13 | — | — | 29.2 | — | — |
| Ethynyl estradiol | EE2 |
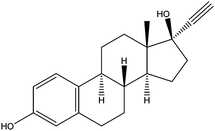
|
6.25 | — | — | 5.3 | — | — |
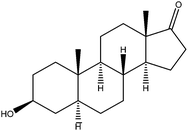
| Epiandrosterone | ET |
|
2.92 | — | — | 6.7 | — | — |
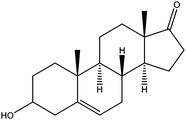
| Dehydroepiandrosterone | DET |
|
4.82 | — | — | 5.7 | — | — |
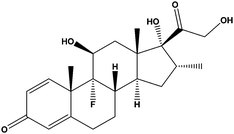
| Dexamethasone | DEX |
|
— | 0.13 | — | — | 100 | — |
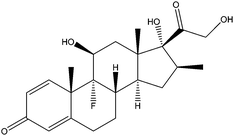
| Betamethasone | BET |
|
— | 0.24 | — | — | 54.2 | — |
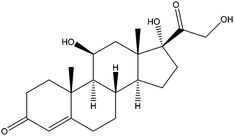
| Hydrocortisone | HDS |
|
— | 2.61 | — | — | 5.0 | — |
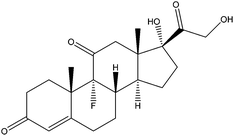
| Fludrocortisone | FDS |
|
— | 4.24 | — | — | 4.0 | — |
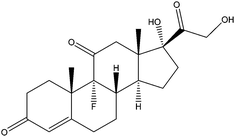
| Cortisone | CTS |
|
— | 2.19 | — | — | 5.9 | — |
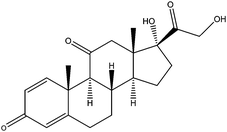
| Prednisone | PDS |
|
— | 2.81 | — | — | 4.6 | — |
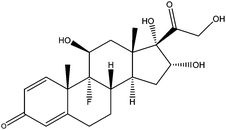
| Triamcinolone | TCL |
|
— | 6.19 | — | — | 2.1 | — |
| Hexestrol | HES |

|
— | — | 0.21 | — | — | 100 |
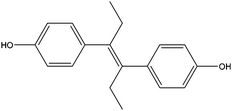
| Diethylstilbestrol | DES |
|
— | — | 0.42 | — | — | 50 |
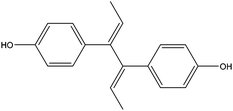
| Dienestrol | DIEN |
|
— | — | 1.36 | — | — | 15.4 |
Optimization of the multi-ICS
Many previous studies38–40 have reported different signal labels in immunoassays such as quantum dots, carbon nanoparticles, and magnetic beads and so on. Due to the advantages of colloidal gold nanoparticles (GNPs) including easy conjugation to antibodies and good stability of the conjugates, GNPs have been widely used in the ICS assay. The visibility of the ICS is related to the sizes of the GNPs, and in our experiments, 20 nm GNPs presented a wine red color, and stable and sensitive signals. Hence, 20 nm GNPs were chosen as the signal molecules. The characterization of the GNPs is shown in Fig. S2 (ESI†). The UV-visible spectrum showed that the maximum absorbance of the GNPs was at 523 nm, and the transmission electron microscopy (TEM) image revealed that the GNP diameter was 20 nm. These results indicated that the GNPs met the requirements for preparation of mAb–GNP conjugates and signal generation in the multi-ICS.Another important condition for the preparation of the multi-ICS was the synthesis of the mAb–GNP conjugates. Based on previous work, the pH, concentration of each mAb, and re-suspension buffer have important effects on the preparation of mAb–GNP conjugates. Thus, we have optimized the pH, the final concentration of each mAb, and the composition of the re-suspension buffer in this study. The pH of the solution influences the protein binding capacity of the GNPs and the stability of the mAb–GNP conjugates during synthesis. The range of 2–8 μL mL−1 of 0.1 M K2CO3 was chosen to optimize the pH of the reaction system. Optimal doses of 0.1 M K2CO3 in the GNP solution were confirmed as 4, 4, and 3.5 μL mL−1 for anti-NR, anti-DEX, and anti-HES mAb, respectively. The antibody concentration affects the visibility and sensitivity of the mAb–GNP conjugates. To obtain the best results, different mAb concentrations (2, 4, 8, 12, 16, and 20 μg mL−1 for each mAb) were used in the synthesis of the mAb–GNP conjugates. The optimal antibody concentrations for these three mAb–GNP conjugates were 8, 8, and 16 μg mL−1 for anti-NR, anti-DEX, and anti-HES mAb, respectively. The re-suspension buffer affects the recovery of the mAb–GNP conjugates. Tween would influence the flow rate of the sample solution on paper substrates, saccharides would improve the stability of the ICS, and proteins as a protective reagent would influence the color development and flow speed. So the buffer compositions including Tween 20, Tween 80, trehalose, sucrose, and BSA were optimized in this study. The final results indicated that 0.5 M Tris buffer including 0.5% Tween 20, 5% trehalose, and 0.2% BSA obtained the best performance.
The doses of coating antigens and GNP-labeled mAbs also play a key role in the performance of the multi-ICS. The multi-ICS would have a high sensitivity at high concentration of coating antigens and mAbs, and the color of the test (T) lines in the strip would be light at low concentration of coating antigens and mAbs. Thus, we studied the influence of the doses of coating antigens and GNP-labeled mAbs on the multi-ICS development in the next experiments. The results showed that the optimized doses of the mAb–GNP conjugate solution and the re-suspension buffer were 2, 4, 4 and 45 μL for anti-NR, anti-DEX, anti-HES, and re-suspension buffer, respectively. For T lines, the optimal concentrations were 0.5 mg mL−1 NR–CMO–BSA, 1 mg mL−1 DEX–CDI–BSA, and 1 mg mL−1 HES-4C–BSA. In order to ensure a similar color between the T lines and the control (C) line of the multi-ICS for qualitative evaluation, the concentration of goat anti-mouse IgG antibody was 0.5 mg mL−1 for the C line.
Analytical characteristics of the multi-ICS
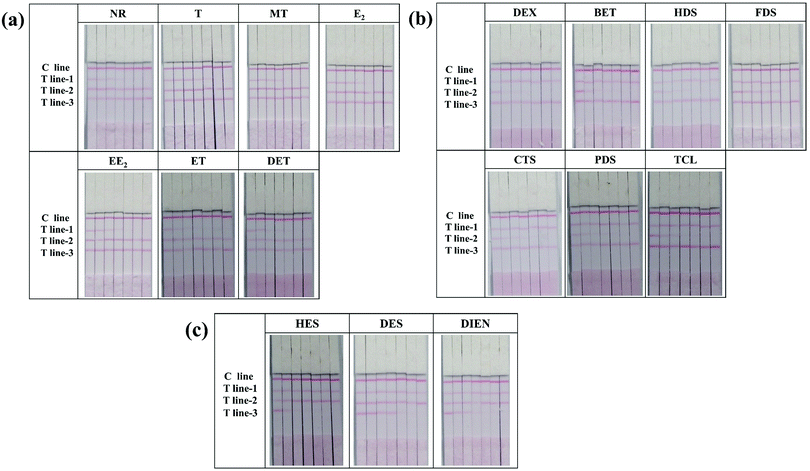
The major difference between the multi-ICS and a single test strip is the number of T lines. To ensure the validity of the test results, specificity experiments were conducted for each T line. In each test, only one mAb-conjugate was added to the sample pad of the strip. The results are shown in Fig. S3 (ESI†): only T line-1 which detected NR and its became red when only anti-NR mAb–GNP conjugates were flowed on the strip, and a similar phenomenon occurred when only anti-DEX mAb–GNP conjugates or anti-HES mAb–GNP conjugates were tested. These results indicated that none of the T lines cross-reacted with the mAb-conjugates corresponding to other classes of drugs. In addition, to ensure that the mAb-conjugate did not cross-react with hormones from the other two classes, the specificity of each antibody was determined. The results, shown in Fig. 2, indicated that all three antibodies were specific for their respective compounds and that there was no interference with the other two classes of analytes, even at a high concentration.In order to eliminate matrix interference, spiked milk samples were tested using the multi-ICS. Different concentrations of all seventeen hormones were analyzed. The cut-off value is defined as the concentration of target object producing no color on the T lines, which could be used as visible evidence for semi-quantitative analysis. As shown in Fig. 2(a), the cut-off values for the hormone drugs detected by T line-1 were 2 ng mL−1 for NR, 5 ng mL−1 for T, 20 ng mL−1 for MT, 10 ng mL−1 for E2, 50 ng mL−1 for EE2, 50 ng mL−1 for ET, and 50 ng mL−1 for DET. As shown in Fig. 2(b), the cut-off values for the hormone drugs detected by T line-2 were 1 ng mL−1 for DEX, 2 ng mL−1 for BET, 20 ng mL−1 for HDS, 20 ng mL−1 for FDS, 20 ng mL−1 for CTS, 20 ng mL−1 for PDS, and 50 ng mL−1 for TCL. As shown in Fig. 2(c), the cut-off values for the hormone drugs detected by T line-3 were 2 ng mL−1 for HES, 5 ng mL−1 for DES, and 10 ng mL−1 for DIEN.
For the quantitative evaluation, calibration curves were established for each hormone (Fig. 3). The limit of detection (LOD), defined as the concentration of each hormone with 10% inhibition of the signal of the blank, was calculated from the calibration curve. From the curves shown in Fig. 3, the LOD values were 0.06 ng mL−1 for NR, 0.42 ng mL−1 for T, 2.7 ng mL−1 for MT, 1.1 ng mL−1 for E2, 4.85 ng mL−1 for EE2, 0.84 ng mL−1 for ET, 2.14 ng mL−1 for DET, 0.005 ng mL−1 for DEX, 0.03 ng mL−1 for BET, 0.39 ng mL−1 for HDS, 2.85 ng mL−1 for FDS, 0.38 ng mL−1 for CTS, 0.72 ng mL−1 for PDS, 0.88 ng mL−1 for TCL, 0.03 ng mL−1 for HES, 2.14 ng mL−1 for DES, and 0.18 ng mL−1 for DIEN.
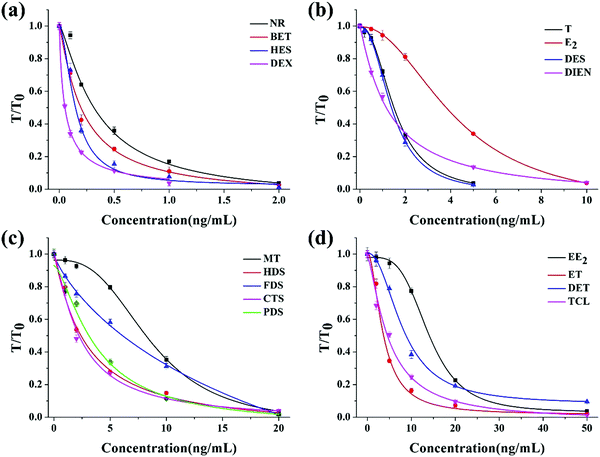 | ||
| Fig. 3 The calibration curves for each hormone detection with the multi-ICS. (a) NR, BET, HES and DEX; (b) T, E2, DES and DIEN; (c) MT, HDS, FDS, CTS and PDS; (d) EE2, ET, DET and TCL. | ||
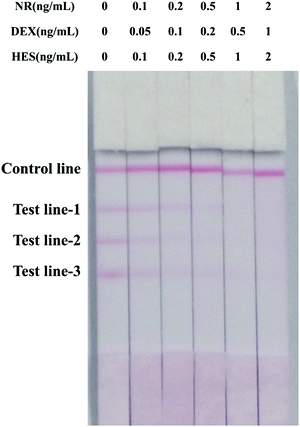
The aim of developing the multi-ICS was simultaneous detection of multiple hormones. To ensure that there was no interference during the analysis of multiple analytes, negative milk samples were spiked with different concentrations of NR, DEX and HES, and analyzed using the strip. The results are shown in Fig. 4. The cut-off values for the multi-ICS assay were 2 ng mL−1 for NR, 1 ng mL−1 for DEX and 2 ng mL−1 for HES, which were in agreement with the results obtained from the individual tests. It is clear that the multi-ICS can be applied in simultaneous detection for multiple drugs. Furthermore, comparing to previous approaches for simultaneous detection of hormone drugs, the multi-ICS assay has some advantages, especially in terms of the speed of detection, and the detection number of analytes. As shown in Table 2, different detection methods were compared to the multi-ICS assay. It is clear that the multi-ICS assay exhibits the advantages of multi-detection, high sensitivity, and short time for detection.
| Assays | Limit of detection | The detection number of chemicals | Time | Ref. |
|---|---|---|---|---|
| The multi-ICS | 0.005–4.85 ng mL−1 | Seventeen | Short | |
| Gas chromatography mass spectrometry | 0.2–1.3 μg kg−1 | Eight | Long | 52 |
| High performance liquid chromatography-tandem mass spectrometry | 0.5–3.4 ng L−1 | Fifteen | Medium | 53 |
| High performance liquid chromatography | 0.02–0.07 μg L−1 | Six | Long | 54 |
| Yeast-based biosensor | 1–25 ng L−1 | Three | Medium | 55 |
| Luminescence detection-based biosensor | 0.1 nM | Two | Short | 56 |
Recovery of hormones from milk samples
For quantitative analysis of NR, DEX and HES, the color intensity of the three T lines was scanned using a strip reader, and the results were obtained based on each hormone calibration curve as described above. The recovery rates were 85.8–93.3% for NR, 78.8–87.5% for DEX, and 89.4–99.4% for HES in milk samples (Table 2). To improve the speed of detection, semi-quantitative analysis could also be performed by visualization. When the T line was clearly observed, the samples were negative; when a pale T line was observed, the samples were weakly positive; and when the T line was invisible, the sample was positive. As shown in Table 3, the semi-quantitative results obtained by naked eye visualization were consistent with the quantitative results. The satisfactory performances have once again proven the possibility of the approach for rapid and sensitive detection of multiple chemicals.| Spiked (ng mL−1) | Detection level (ng mL−1) | Recovery rate (%) | ||||
|---|---|---|---|---|---|---|
| Mean ± SD | ||||||
| NR/DEX/HES | T line-1 | T line-2 | T line-3 | T line-1 | T line-2 | T line-3 |
| a Not detectable. b Negative, the T line is obviously observed. c Not calculated. d Weakly positive, a light T line is observed. e Positive, the T line is invisible. | ||||||
| 0/0/0 | NDa(−)b | ND(−) | ND(−) | NCc | NC | NC |
| 0.4/0.08/0.16 | 0.343 ± 0.015(±)d | 0.063 ± 0.004(±) | 0.143 ± 0.007(±) | 85.8 | 78.8 | 89.4 |
| 0.8/0.16/0.32 | 0.746 ± 0.047(±) | 0.141 ± 0.018(±) | 0.318 ± 0.021(±) | 93.3 | 87.5 | 99.4 |
| 2/1/2 | ND(+)e | ND(+) | ND(+) | NC | NC | NC |
Conclusion
In this study, we developed a multi-ICS assay for simultaneous detection of seventeen hormones in milk samples. The whole test procedure only required 20 min, and the results could be obtained semi-quantitatively and quantitatively. The advantages of the multi-ICS include a low LOD, rapid speed, and simultaneous detection of multiple hormones. Thus, this multi-strip sensor provides a powerful tool for monitoring hormones in biological samples.Experimental
Reagents and apparatus
Nandrolone (NR), testosterone (T), methyl testosterone (MT), estradiol (E2), ethynyl estradiol (EE2), epiandrosterone (ET), dehydroepiandrosterone (DET), dexamethasone (DEX), betamethasone (BET), hydrocortisone (HDS), fludrocortisone (FDS), cortisone (CTS), prednisone (PDS), triamcinolone (TCL), hexestrol (HES), diethylstilbestrol (DES), and dienestrol (DIEN) were obtained from J&K Scientific Ltd (Shanghai, China). Goat anti-mouse HRP-labeled immunoglobulin (IgG) was obtained from Kangcheng Bioengineering Co. (Shanghai, China). Carboxymethoxylamine hemihydrochloride, ethyl 4-bromobutyrate, 1-ethyl-3-(3-dimethylaminopropyl) carbodiimide (EDC), N-hydroxysuccinimide (NHS), N,N′-carbonyldiimidazole (CDI), bovine serum albumin (BSA), and chloroauric acid (HAuCl4·H2O) were all purchased from Sigma-Aldrich (St. Louis, MO, USA). Other reagents and chemicals were obtained from the National Pharmaceutical Group Chemical Reagent Co., Ltd (Shanghai, China). Milk samples were purchased from a local supermarket. All reagents and solvents were of analytical grade or higher.The anti-NR–mAb, anti-DEX–mAb, and anti-HES–mAb were synthesised in our laboratory and the corresponding synthetic procedures are shown in the ESI.†
The sample pad (glass fiber membrane, CB-SB08), polyvinylchloride (PVC) sheets, and the absorbance pad (SX18) were purchased from Goldbio Tech Co., Ltd (Shanghai, China). The nitrocellulose (NC) membrane (Pura-bind RP) was from Whatman-Xinhua Filter Paper Co., Ltd (Hangzhou, China).
Ultrapure water was obtained using a Milli-Q synthesis system (Millipore Co., Bedford, MA, USA). A CM4000 guillotine cutting module (Shanghai Kinbio Tech Co., Ltd, China) and dispensing platform (Shanghai Kinbio Tech Co., Ltd, China) were used to manufacture the test strips. A BioDot TSR 3000 membrane strip reader (Gene Company Limited, Shanghai Branch, Shanghai, China) was used to determine the color intensities of colloidal gold on the test zone.
Preparation of hapten–protein conjugates
The conjugates, NR–CMO–BSA, DEX–CDI–BSA, and HES-4C–BSA, were synthesized using the following methods.The NR hapten was synthesized by the oximation method.41 Briefly, NR (2 mmol) and carboxymethoxylamine hemihydrochloride (3 mmol, CMO) were dissolved in anhydrous pyridine and stirred at 60 °C for 6 h. The mixture was subjected to rotary evaporation and the residue dissolved in 8 mL of methanol solution (3 mL methanol + 5 mL ultrapure water). The mixture was extracted with ethyl acetate and then the extracted solution was evaporated to provide the NR–CMO. The coating antigen, NR–CMO–BSA, was prepared by the active ester method42 with some modifications. Firstly, NR–CMO (0.2 mmol), EDC (0.6 mmol) and NHS (0.6 mmol) were dissolved in 3 mL of DMF and stirred for 5 h at room temperature. The mixture was added dropwise to a BSA solution (10 mg of BSA dissolved in 3 mL of carbonate–bicarbonate buffer, pH 9.6) and stirred overnight. The final product was dialyzed against phosphate-buffered saline (PBS, pH 7.4) for 3 days and stored at −20 °C.
DEX was conjugated to BSA with CDI to prepare the coating antigen.43 Briefly, DEX (0.1 mmol) and CDI (0.2 mmol) were dissolved in 0.3 mL of anhydrous DMF and the mixture was continuously stirred for 1 h at 37 °C. The reaction solution was then added to a BSA solution and stirred overnight. The solution was finally dialyzed against PBS for 3 days and stored at −20 °C.
The HES-4C hapten was synthesized by the reported method with some modifications.44 Briefly, a mixture of HES (0.2 mmol), ethyl 4-bromobutyrate (0.3 mmol) and K2CO3 (0.3 mmol) was dissolved in 2 mL of DMF and stirred at room temperature overnight. The reaction solution was evaporated and the solid material was dissolved in 5 mL of methanol. Lithium hydroxide solution (500 mg lithium hydroxide dissolved in 5 mL of distilled water) was added and the solution was refluxed overnight. The solution was then acidified with 1 M HCl to pH 1. After filtration, the orange product was recrystallized from petroleum ether and ether and then dried. The final product, HES-4C, was obtained as a white solid. The hapten, HES-4C, was coupled to BSA using the active ester method.
Preparation of gold nanoparticle-labeled mAbs
All of the mAbs were purified from mouse ascitic fluid by the caprylic acid–ammonium sulfate method45,46 and dialyzed against PBS at 4 °C for 3 days. An indirect competitive enzyme-linked immunosorbent assay (IC-ELISA) was developed for measuring the sensitivity and cross-reactivity (CR) of all mAbs. The 50% inhibition concentration (IC50, the concentration of competing molecules that produced 50% inhibition of antibody binding to the coating antigen) value was used to evaluate the sensitivity of each mAb, and the CR values were calculated using the following formula:| CR (%) = (IC50 of analyte/IC50 of related analogue) × 100% |
GNPs were prepared by the sodium citrate reduction method as described previously.47–49 Briefly, freshly prepared 0.01% (w/w) chloroauric acid was boiled under vigorous stirring and mixed with 1% (w/v) trisodium citrate. The mixture was boiled until the color of the solution changed from pale yellow to wine-red. After continued boiling for 10 min, the solution was cooled to room temperature and stored at 4 °C. The colloidal gold was characterized via transmission electron microscopy.
Labeling the antibodies with GNPs was a critical step in this study. The mechanism of antibody adsorption onto the GNP surface may be electrostatic interaction between the negatively charged GNP surface and the positively charged IgG, combined with van der Waals attraction. The adsorption of protein by colloidal gold is dependent on pH, where strong bonding is favored at the isoelectric point of the antibody. The antibody–GNP conjugates were prepared by the previously reported methods with some modifications.50,51 Briefly, the pH of the GNP solution was adjusted to 8.2 with 40 μL of 0.1 M K2CO3. Then the anti-NR mAb (80 μg) was added dropwise to the GNP solution (10 mL) with gentle stirring. After stirring for 45 min, 1 mL of 10% (w/v) BSA was added and stirring continued for 1 h at room temperature. The solution was centrifuged at 8000g for 30 min at 4 °C to collect the antibody–GNP conjugate. The precipitate was washed three times with re-suspension buffer (0.5 M Tris, 0.5% Tween 20, 5% trehalose, 0.2% BSA and 0.02% NaN3) and then re-suspended in 2 mL of the same buffer.
The anti-DEX and anti-HES mAb–GNP conjugates were prepared similarly under their individually optimized conditions.
Preparation of the multi-ICS
The ICS is composed of four parts: sample pad, nitrocellulose (NC) membrane on which the test line (T line) and control line (C line) are immobilized, absorption pad, and polyvinylchloride (PVC) backing card. The obvious difference between a single test ICS and multiple test ICS is the number of T lines. As shown in Fig. 1(a), the multi-ICS contains three T lines, allowing seventeen hormones to be detected. Three different coating antigens and a goat anti-mouse IgG were immobilized on the NC membrane as T lines (T lines-1, 2, 3) and the C line by dispenser. The NC membrane was dried and stored in a desiccator. The sample pad was immersed in borate buffer (containing 1% BSA, 0.5% Tween 20, and 5% sucrose, pH 7.4) to prevent absorption of the target analytes. The pad was then dried at 37 °C for 2 h. The absorbent pads were not treated. The NC membrane, sample pad, and absorbent pad were sequentially attached to the PVC backing pad. The strips were stored in a desiccator for further use.Principle of the multi-ICS assay
The multi-ICS assay was based on the competitive reaction theory as shown in Fig. 1(b). A mixture of milk sample (100 μL) and antibody–GNP conjugate (55 μL) was incubated at room temperature. After 5 min, the mixture was added to the sample pad and transferred towards the absorbent pad. The results were obtained after 10 min. In a negative-sample test, the three antibody–GNP conjugates migrate freely to the absorbent pad and are trapped by the coating antigens immobilized on the three T lines and goat anti-mouse IgG immobilized on the C line, which all turn red. When one or more classes of hormones are present in the samples, the hormones compete with the immobilized coating antigens on the corresponding T lines to bind the limited amount of corresponding antibody–GNP conjugate. The color of the corresponding T line becomes weaker as the concentration of hormone increases. The intensity of the T line is inversely proportional to the amount of hormone present in the samples. If the C line does not become red, the multi-ICS is considered invalid or the test procedure was improperly performed.Pretreatment of milk samples for the multi-ICS
The milk samples, purchased from a local market, were confirmed as negative for exogenous hormones by using liquid chromatography-mass spectrometry (LC-MS). However, because endogenous hormones such as T and E2 may be present in milk, the necessary pretreatment to extract endogenous hormones from milk should be carried out before recovery experiments. The process is briefly described as follows. 10 mL of milk was mixed with 10 mL of acetic acid–sodium acetate buffer solution (v/w, 1![[thin space (1/6-em)]](https://www.rsc.org/images/entities/char_2009.gif) :
:![[thin space (1/6-em)]](https://www.rsc.org/images/entities/char_2009.gif) 2, pH 5.2) in a volumetric flask. Then 100 μL of β-glucuronidase solution was added and the mixture was stored at 37 °C for 12 h. After the enzymolysis was complete, 5 g of NaCl and 20 mL of ethyl acetate were added to the flask. The mixture was subjected to ultrasonic extraction for 30 min, and the solid residue and supernatant were then separated by centrifugation. The supernatant was transferred to another flask and the solid residue was dissolved in 10 mL of PBS. Then, the mixture solution was confirmed as negative for endogenous hormones by using LC-MS. This solution was stored at 4 °C for further experiments.
2, pH 5.2) in a volumetric flask. Then 100 μL of β-glucuronidase solution was added and the mixture was stored at 37 °C for 12 h. After the enzymolysis was complete, 5 g of NaCl and 20 mL of ethyl acetate were added to the flask. The mixture was subjected to ultrasonic extraction for 30 min, and the solid residue and supernatant were then separated by centrifugation. The supernatant was transferred to another flask and the solid residue was dissolved in 10 mL of PBS. Then, the mixture solution was confirmed as negative for endogenous hormones by using LC-MS. This solution was stored at 4 °C for further experiments.
Characterization of the multi-ICS
A series of concentrations of each hormone were spiked into blank milk to prepare the calibration curves. The color intensity of each T line for each hormone was quantified using a strip scan reader, and the quantitative values were expressed as T/T0 (the ratio of optical density of the T line in the standard or positive sample to that in the negative sample). The calibration curves were constructed by plotting the T/T0 values obtained from each standard sample against the corresponding concentration of the target analyte. The concentrations in the samples were obtained from the calibration curves using the T/T0 values.Quantitative analytical sensitivity with the multi-ICS was determined using the strip scan reader and semi-quantitative analysis was conducted with the naked eye. The specificity was evaluated by individual testing of all types of hormones at high concentrations. In order to evaluate the quality and efficiency of the multi-ICS for simultaneous detection of various hormones, NR, DEX and HES were selected for testing. Each sample was assayed eight times using the procedures described.
Funding
This work was funded by the Key Programs from MOST [2017YFC1601102], and grants from the Natural Science Foundation of Jiangsu Province [BE2016307, BK20140003, BX20151038, BE2013613, BE2013611].Conflicts of interest
No potential conflict of interest is reported by the authors.References
- M. L. Scala-Benuzzi, J. Raba, G. Soler-Illia, R. J. Schneider and G. A. Messina, Anal. Chem., 2018, 90, 4104–4111 CrossRef PubMed.
- C. W. Quinn, D. M. Cate, D. D. Miller-Lionberg, T. Reilly, 3rd, J. Volckens and C. S. Henry, Environ. Sci. Technol., 2018, 52, 3567–3573 CrossRef PubMed.
- D. Kong, L. Liu, S. Song, S. Suryoprabowo, A. Li, H. Kuang, L. Wang and C. Xu, Nanoscale, 2016, 8, 5245–5253 RSC.
- M. Yang, W. Zhang, J. Yang, B. Hu, F. Cao, W. Zheng, Y. Chen and X. Jiang, Sci. Adv., 2017, 3, eaao4862 CrossRef PubMed.
- S. T. Han, H. Peng, Q. Sun, S. Venkatesh, K. S. Chung, S. C. Lau, Y. Zhou and V. A. L. Roy, Adv. Mater., 2017, 29, 1700375 CrossRef.
- M. M. Gong and D. Sinton, Chem. Rev., 2017, 117, 8447–8480 CrossRef PubMed.
- A. K. Yetisen, M. S. Akram and C. R. Lowe, Lab Chip, 2013, 13, 2210–2251 RSC.
- B. Simončič, L. Černe, B. Tomšič and B. Orel, Cellulose, 2007, 15, 47–58 CrossRef.
- C.-M. Cheng, J. Gong, C. R. Mace, S. T. Phillips, E. Carrilho, K. A. Mirica and G. M. Whitesides, Angew. Chem., 2010, 122, 4881–4884 CrossRef.
- A. M. López-Marzo and A. Merkoçi, Lab Chip, 2016, 16, 3150–3176 RSC.
- K. T. Barnhart, Fertil. Steril., 2016, 106, 1551 CrossRef PubMed.
- R. Yadav, N. Yadav and M. D. Kharya, Asian J. Res. Chem., 2014, 7, 964–969 Search PubMed.
- N. Schwartz, A. Verma, C. B. Bivens, Z. Schwartz and B. D. Boyan, Biochim. Biophys. Acta, Mol. Cell Res., 2016, 1863, 2289–2298 CrossRef PubMed.
- R. Louw-duToit, K.-H. Storbeck, M. Cartwright, A. Cabral and D. Africander, Mol. Cell. Endocrinol., 2017, 441, 31–45 CrossRef PubMed.
- H. J. Shiau, M. E. Aichelmann-Reidy and M. A. Reynolds, Periodontology 2000, 2014, 64, 81–94 CrossRef PubMed.
- S. D. Bilbo and R. J. Nelson, Am. J. Physiol.: Regul., Integr. Comp. Physiol., 2001, 49, R207 CrossRef PubMed.
- J. Lamy, P. Liere, A. Pianos, F. Aprahamian, P. Mermillod and M. Saint-Dizier, Theriogenology, 2016, 86, 1409–1420 CrossRef PubMed.
- W. J. Hendry, H. Y. Hariri, I. D. Alwis, S. S. Gunewardena and I. R. Hendry, Reprod. Toxicol., 2014, 50, 68–86 CrossRef PubMed.
- I. J. M. M. Boumans, I. J. M. D. Boer, G. J. Hofstede, S. E. L. Fleur and E. A. M. Bokkers, Horm. Behav., 2017, 93, 82–93 CrossRef PubMed.
- C. A. Lalone, D. L. Villeneuve, A. W. Olmstead, E. K. Medlock, M. D. Kahl, K. M. Jensen, E. J. Durhan, E. A. Makynen, C. A. Blanksma and J. E. Cavallin, Environ. Toxicol. Chem., 2012, 31, 611 CrossRef PubMed.
- G. Cacciatore, S. W. Eisenberg, C. Situ, M. H. Mooney, P. Delahaut, S. Klarenbeek, A. C. Huet, A. A. Bergwerff and C. T. Elliott, Anal. Chim. Acta, 2009, 637, 351–359 CrossRef PubMed.
- M. Pambianchi, C. Biagetti, M. Biagioni, C. Carini, S. Gatti, I. D’Alba, V. Romagnoli and C. Catassi, Dig. Liver Dis., 2008, 40, A83–A84 CrossRef.
- S. Y. Jeon, K. A. Hwang and K. C. Choi, J. Steroid Biochem. Mol. Biol., 2016, 158, 1–8 CrossRef PubMed.
- X. Xu, F. Liang, J. Shi, X. Zhao, Z. Liu, L. Wu, Y. Song, H. Zhang and Z. Wang, Anal. Chim. Acta, 2013, 790, 39–46 CrossRef PubMed.
- I. Matraszek-Zuchowska, B. Wozniak and A. Posyniak, Food Analytical Methods, 2017, 10, 727–739 CrossRef.
- N. Migowska, M. Caban, P. Stepnowski and J. Kumirska, Sci. Total Environ, 2012, 441, 77–88 CrossRef PubMed.
- M. De Angelis, F. Giesert, B. Finan, C. Clemmensen, T. D. Müller, D. Vogt-Weisenhorn, M. H. Tschöp and K.-W. Schramm, J. Chromatogr. B: Anal. Technol. Biomed. Life Sci., 2016, 1033, 413–420 CrossRef PubMed.
- R. Guedes-Alonso, Z. Sosa-Ferrera and J. J. Santana-Rodríguez, Food Chem., 2017, 237, 1012–1020 CrossRef PubMed.
- L. Lei, M. Q. Kang, N. Li, X. Yang, Z. L. Liu, Z. B. Wang, L. Y. Zhang, H. Q. Zhang and Y. Yu, Anal. Methods, 2014, 6, 3674–3681 RSC.
- Z. Wang, S. Zou, C. Xing, S. Song, L. Liu and C. Xu, Food Agric. Immunol., 2016, 27, 547–558 CrossRef.
- E. Caron, C. Sheedy and A. Farenhorst, J. Environ. Sci. Health, Part B, 2010, 45, 145–151 CrossRef PubMed.
- W. Matapatara and M. Likitthanaset, J. Biotechnol., 2010, 150, 426–427 CrossRef.
- H. Sui, Y. Wang, X. Zhang, X. Wang, W. Cheng, H. Su, X. Wang, X. Sun, X. X. Han and B. Zhao, Analyst, 2016, 141, 5181–5188 RSC.
- V. Serafín, L. Agüí, P. Yáñez-Sedeño and J. M. Pingarrón, Sens. Actuators, B, 2014, 195, 494–499 CrossRef.
- J. P. D. Silveira, J. V. Piovesan and A. Spinelli, Microchem. J., 2017, 133, 22–30 CrossRef.
- A. Smaniotto, D. Z. Mezalira, E. Zapp, H. Gallardo and I. C. Vieira, Microchem. J., 2017, 133, 510–517 CrossRef.
- Y. Cui, H. Chen, L. Hou, B. Zhang, B. Liu, G. Chen and D. Tang, Anal. Chim. Acta, 2012, 738, 76–84 CrossRef PubMed.
- Q. Yang, X. Gong, T. Song, J. Yang, S. Zhu, Y. Li, Y. Cui, Y. Li, B. Zhang and J. Chang, Biosens. Bioelectron., 2011, 30, 145–150 CrossRef PubMed.
- J. B. Sun, X. Y. Lei, H. Bao, Q. Wang, Y. L. Liu, Y. H. Guo, Z. Yan and J. H. Yang, Prog. Mod. Biomed., 2011, 11, 5001–5004 Search PubMed.
- J. Wang, L. Zhang, Y. Huang, A. Dandapat, L. Dai, G. Zhang, X. Lu, J. Zhang, W. Lai and T. Chen, Sci. Rep., 2017, 7, 41419 CrossRef PubMed.
- N. Kong, L. Guo, D. Guan, L. Liu, H. Kuang and C. Xu, Food Analytical Methods, 2015, 8, 1382–1389 CrossRef.
- Y. Chen, L. Guo, L. Liu, S. Song, H. Kuang and C. Xu, J. Agric. Food Chem., 2017, 65, 8248–8255 CrossRef PubMed.
- Z. Wang, Z. Xie, G. Cui, L. Liu, S. Song, H. Kuang and C. Xu, Food Agric. Immunol., 2017, 28, 476–488 CrossRef.
- D. Mukunzi, B. N. Tochi, J. Isanga, L. Liu, H. Kuang and C. Xu, Food Agric. Immunol., 2016, 27, 855–869 CrossRef.
- S. Peng, S. Song, L. Liu, H. Kuang and C. Xu, Food Agric. Immunol., 2015, 27, 449–459 CrossRef.
- H. Kuang, C. Xing, C. Hao, L. Liu, L. Wang and C. Xu, Sensors, 2013, 13, 4214 CrossRef PubMed.
- Y. Chen, L. Liu, L. Xu, S. Song, H. Kuang, G. Cui and C. Xu, Nano Res., 2017, 10, 2833–2844 CrossRef.
- C. Xing, L. Liu, S. Song, M. Feng, H. Kuang and C. Xu, Biosens. Bioelectron., 2015, 66, 445 CrossRef PubMed.
- P. Maguire, D. Rutherford, M. Macias-Montero, C. Mahony, C. Kelsey, M. Tweedie, F. Pérez-Martin, H. Mcquaid, D. Diver and D. Mariotti, Nano Lett., 2017, 17, 1336–1343 CrossRef PubMed.
- J. Peng, L. Liu, L. Xu, S. Song, H. Kuang, G. Cui and C. Xu, Nano Res., 2017, 10, 108–120 CrossRef.
- W. Wang, L. Liu, S. Song, L. Xu, H. Kuang, J. Zhu and C. Xu, Microchim. Acta, 2017, 184, 715–724 CrossRef.
- R. Su, X. Wang, X. Xu, Z. Wang, D. Li, X. Zhao, X. Li, H. Zhang and A. Yu, J. Chromatogr. A, 2011, 1218, 5047–5054 CrossRef PubMed.
- L. Sun, W. Yong, X. Chu and J. M. Lin, J. Chromatogr. A, 2009, 1216, 5416–5423 CrossRef PubMed.
- H. Wu, G. Li, S. Liu, N. Hu, D. Geng, G. Chen, Z. Sun, X. Zhao, L. Xia and J. You, Food Chem., 2016, 192, 98–106 CrossRef PubMed.
- Y. Tan, X. Hu, M. Liu, X. Liu, X. Lv, Z. Li, J. Wang and Q. Yuan, Chemistry, 2017, 23, 10683 CrossRef PubMed.
- Y. Tan, X. Hu, M. Liu, X. Liu, X. Lv, Z. Li, J. Wang and Q. Yuan, Chemistry, 2017, 23, 10683–10689 CrossRef PubMed.
Footnote |
| † Electronic supplementary information (ESI) available. See DOI: 10.1039/c8qm00336j |
| This journal is © the Partner Organisations 2018 |

