 Open Access Article
Creative Commons Attribution 3.0 Unported Licence
Preferential occupancy of Eu3+ and energy transfer in Eu3+ doped Sr2V2O7, Sr9Gd(VO4)7 and Sr2V2O7/Sr9Gd(VO4)7 phosphors†
Ling Li*ab,
Wenjun Wanga,
Yu Pana,
Yuhan Zhua,
Xiaoguang Liu*a,
Hyeon Mi Nohb,
Byung Kee Moonb,
Byung Chun Choib and
Jung Hyun Jeong *b
*b
aHubei Collaborative Innovation Center for Advanced Organochemical Materials, Ministry of Education Key Laboratory for the Synthesis and Applications of Organic Functional Molecules, Hubei University, Wuhan 430062, China
bDepartment of Physics, Pukyong National University, Busan 608-737, Korea
First published on 3rd January 2018
Abstract
The vanadate-based phosphors Sr2V2O7:Eu3+ (SV:Eu3+), Sr9Gd(VO4)7:Eu3+ (SGV:Eu3+) and Sr9Gd(VO4)7/Sr2V2O7:Eu3+ (SGV/SV:Eu3+) were obtained by solid-state reaction. The bond-energy method was used to investigate the site occupancy preference of Eu3+ based on the bond valence model. By comparing the change of bond energy when the Eu3+ ions are incorporated into the different Sr, V or Gd sites, we observed that Eu3+ doped in SV, SGV or SV/SGV would preferentially occupy the smaller energy variation sites, i.e., Sr4, Gd and Gd sites, respectively. The crystal structures of SGV and SV, the photoluminescence properties of SGV:Eu3+, SV, SGV/SV and SGV/SV:Eu, as well as their possible energy transfer mechanisms are proposed. Interesting tunable colours (including warm-white emission) of SGV/SV:Eu3+ can be obtained through changing the concentration of Eu3+ or changing the relative quantities of SGV to SV by increasing the calcination temperature. Its excitation bands consist of two types of O2− → V5+ charge transfer (CT) bands with the peaks at about 325 and 350 nm respectively, as well as f–f transitions of Eu3+. The obtained warm-white emission consists of a broad photoluminescence band centred at about 530 nm, which originates from the O2− → V5+ CT of SV, and a sharp characteristic spectrum (5D0–7F2) at about 615 and 621 nm.
1. Introduction
Recently, vanadate-based phosphors have drawn increasing attention due to the self-activated emitting properties of [VO4]3− group, the sensitization from [VO4]3− to rare earth ions as well as their long wavelength excitation and the excellent chemical stabilities.1–8 The vanadate group, namely, [VO4]3−, in which the central metal ion V is coordinated by four oxygen ligands in a tetragonal symmetry, exhibits broad and intense charge transfer (CT) absorption bands in the UV region and some of them can produce intense broadband CT emission spectra from 400 to more than 700 nm related to the local structure.9–11 When excited by UV light, these vanadates or rare earth ions-doped materials have the capability to convert the ultraviolet emission into white light.4,12,13In general, the first essential factor that determines the luminescence quantum efficiency of vanadate-based phosphors originating from O2− → V5+ CT transition is the distortion of the VO4 tetrahedron. The excitation process of O2− → V5+ CT is always allowed; thus, most of the vanadates show self-activated properties, while the intersystem crossing (1T1, 1T2 → 3T1, 3T2) and luminescence process (3T1, 3T2 → 1A1) are forbidden in the ideal Td symmetry due to the spin selection rule.1 For example, in the crystal YVO4, O2− → V5+ CT luminescence process is forbidden and thus, the luminescence of O–V CT cannot be observed at room temperature because in this crystal, V atom is coordinated with four equal oxygens and shows ideal Td symmetry (all four Y–O bond lengths are 1.7 Å).14 However, in Eu3+-doped YVO4, the O2− → V5+ CT energy can effectively be transferred to Eu3+ and shows intense red photoluminescence corresponding to the electric dipole transition, 5D0 → 7F2, of Eu3+ ions.15 However, the structure of the VO4 tetrahedron has, to some extent, a distorted Td symmetry as compared to that of an ideal tetrahedron; thus, these forbidden processes are partially allowed due to the spin–orbit interaction.1,10 The vanadates with this type of structure can show intense O2− → V5+ CT emission. For example, AVO3 (A: Rb and Cs) exhibits intense broadband emission from 400 nm to more than 700 nm under UV excitation.5,9,16 M2V2O7 (M = Ca, Sr, Ba) with distorted Td symmetry around V atoms can emit strong O2− → V5+ CT luminescence.17 Although only a few Eu3+ doped with this type of vanadates, such as Ba3LiMgV3O12:Eu3+,18 showed white light, while most rare earth ions-doped with this type of vanadates only produced red, yellow or green or blue-green light; other examples include M2V2O7 (M = Ca, Sr, Ba):Eu3+,19 Li2Ca2ScV3O12:Eu3+,6 and Ba2Y2/3V2O8:Eu3+.13
The vanadate phosphors exhibit two types of important advantages according to the symmetrical characteristic of VO4: first, self-activated emission arising from O2− → V5+ CT with distorted Td symmetry and second, the efficient energy transfer from self-activated O2− → V5+ CT to Eu3+ with Td symmetry.1 It is very interesting and important to investigate the preferential occupancy of Eu3+ and PL properties in the mixed phosphor. This is because the Sr9Gd(VO4)7 and Sr2V2O7 vanadates show two different types of important advantages according to the symmetrical characteristic of VO4. Sr2V2O7 shows self-activated emission arising from O2− → V5+ CT with distorted Td symmetry, but the energy transfer from O2− → V5+ CT to the Eu ions is not effective. However, Eu3+ doped Sr9Gd(VO4)7 shows efficient energy transfer from self-activated O2− → V5+ CT to Eu3+, but Sr9Gd(VO4)7 could not produce self-activated emission due to the symmetrical characteristic of VO4 with Td symmetry. Eu3+ doped Sr2V2O7/Sr2Gd(VO4)7 possesses the two advantages of self-activated emission and efficient energy transfer from the host lattice to Eu3+. In order to investigate the structure and the photoluminescence of vanadate phosphors, we synthesized Sr2V2O7 (SV), Sr9Gd(VO4)7:Eu3+ (SGV:Eu3+) and Sr9Gd(VO4)7/Sr2V2O7:Eu3+ (SGV/SV:Eu3+); in particular, Sr9Gd(VO4)7/Sr2V2O7:Eu3+ can possess both the above advantages of vanadates. The occupying sites of Eu3+, photoluminescence properties and the relationship between O2− → V5+ CT energy and crystal structure are discussed. The photoluminescence and excitation mechanism as well as energy transfer phenomenon between the host lattice and Eu3+ are investigated.
2. Experimental section
2.1. Materials and synthesis
The phosphor with nominal composition Sr9Gd(VO4)7:5% Eu3+ was synthesized using a high-temperature solid-state reaction method from a stoichiometric mixture of SrCO3 (99.9%), V2O5 (99.9%), Gd2O3 (99.99%), and Eu2O3 (99.99%). The mixture was ground in alumina crucibles, homogeneously mixed; finally the mixtures were heated at 1023 K for 12 h and at 1223 K for 12 h and then cooled down to room temperature to obtain a white powder. Sr2V2O7/Sr9Gd(VO4)7:5% Eu3+ can be obtained when heated at 1123 K for 12 h.Pure Sr2V2O7:Eu3+ was prepared using traditional solid-state method from a stoichiometric mixture of SrCO3 (99.9%), V2O5 (99.9%) and Eu2O3 (99.99%). After grinding in an alumina crucible and mixing homogeneously, the mixture was heated at 1323 K for 24 h and then cooled down to room temperature to obtain a white powder.
2.2. Characterizations
Powder X-ray diffraction (XRD) measurements were recorded on a D/MAX 2500 instrument (Rigaku) with a Rint 2000 wide angle goniometer and Cu Kα1 radiation (λ = 1.54056 Å) at 40 kV and 100 mA. The diffraction patterns were scanned over an angular (2θ) range of 20−80° at intervals of 0.02° with a counting time of 0.6 s per step. Photoluminescence (PL) studies were conducted on a fluorescence spectrophotometer (Photon Technology International) equipped with a 60 W Xe-arc lamp as the excitation light source. All the measurements were recorded at room temperature.2.3. Theoretical method
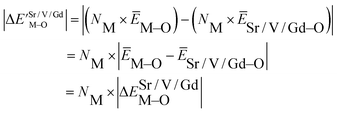
Based on the chemical bond viewpoint, the dopants preferentially occupy the sites with smaller alterations of bond energy.20 The variation of bond energy can be measured by the following expression
 | (1) |
 value. ĒM–O and ĒSr/V/Gd–O are the mean bond energies of M–O bond and Sr–O or V–O or Gd–O, which can be expressed as
 | (2) |
 | (3) |
The total bond energy, ∑ESr/V/Gd–O, in kcal of the crystals can be regarded as a bond-energy sum of all constituent chemical bonds. For example, in Sr2V2O7, there are four different sites,21 that is, Sr1, Sr2, Sr3 and Sr4. Taking Sr1 site as an example, there are eight types of constituent Sr1–O, that is, Sr1–O1, Sr1–O2, Sr1–O6 (there are two Sr1–O6 bonds with different distance), Sr1–O8, Sr1–O9, Sr1–O11 and Sr1–O14. Thus, the bond energy, ∑ESr1–O, can be calculated using the following formula:
 | (4) |
The ∑EM–O is the sum of bond energies of different dopants in the crystallographic frame. When the dopant ion is Eu3+, EM–O can be estimated through the following equation20
 | (5) |
 | (6) |
 | (7) |
In eqn (5), d0 is an empirically determined parameter, which is measured by processing all available crystallographic data; it is constant for a given atom pair.23 The d0 of Sr2+–O2−, V5+–O2− and Eu3+–O2− are 2.118, 1.917, and 2.074 Å, respectively. Furthermore, the d0 value of Gd3+–O2− can be estimated by the formula below:
| d0 = rc + A × ra + P − D − F | (8) |
 | (9) |
For lanthanide ions, the calculated d0 values using (8) are larger 0.079 than those obtained in the ref. 23. Hence, we corrected the formula (8) to be as below:
 | (10) |
3. Results and discussion
3.1. Phase identification of Sr2V2O7:Eu3+, Sr9Gd(VO4)7/Sr2V2O7:Eu3+ and Sr9Gd(VO4)7:Eu3+
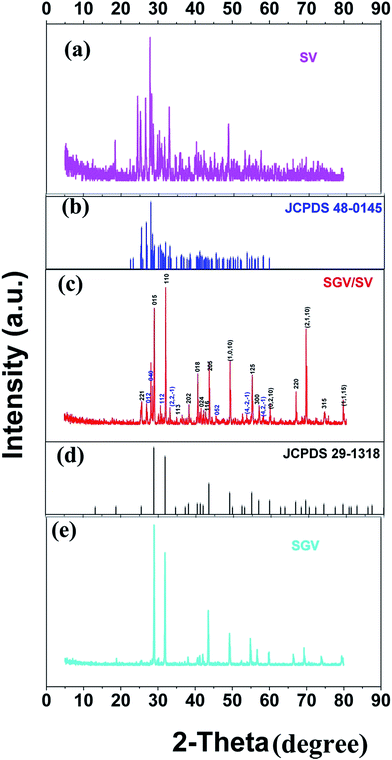
Fig. 1 shows the representative X-ray diffraction patterns for Sr2V2O7:Eu, Sr9Gd(VO4)7/Sr2V2O7:Eu and Sr9Gd(VO4)7:Eu samples. Fig. 1(a) shows the XRD patterns for Sr2V2O7:Eu. All the diffraction peaks of Sr2V2O7:Eu can be indexed to the reported JCPDS 48-0148 card (60° > 2θ > 20°). It can be demonstrated that the obtained Sr2V2O7:Eu sample is pure. Fig. 1(e) shows that the XRD patterns of Sr9Gd(VO4)7:Eu are similar to those of Sr3(VO4)2 (Fig. 1(d), JCPDS file number 29-1318);24 no peaks from other phases such as Gd2O3, SrO, or V2O5 appear. The structure of Sr9Gd(VO4)7:Eu is similar to that of Sr9Lu(VO4)7, which is found to be isotypic with Ca3(VO4)2 (ref. 25) or Sr3(VO4)2.24 The above results indicate the formation of a pure Sr9Gd(VO4)7:Eu. The XRD patterns of Sr9Gd(VO4)7/Sr2V2O7:Eu component is clearly shown in Fig. 1(c). The detailed crystal plane diffraction peaks ascribed to Sr2V2O7 and Sr9Gd(VO4)7:Eu are labeled and distinguished using blue and red colors, respectively. Except the diffraction peaks arising from Sr2V2O7 and Sr9Gd(VO4)7 crystals, no other peaks can be found, which indicates that we have obtained the component of “pure” Sr9Gd(VO4)7/Sr2V2O7. From Fig. 1(c) and (e), we can judge that the mechanism of producing Sr2V2O7, Sr9Gd(VO4)7/Sr2V2O7, and Sr9Gd(VO4)7 is as below:| 2SrCO3 + V2O5 ⇔ Sr2V2O7 + 2CO2↑ | (11) |
| 18SrCO3 + Gd2O3 + 7V2O5 ⇔ 3.5xSr2V2O7 + 0.5xGd2O3 + 2xSrO + (2 − x)Sr9Gd(VO4)7 + 18CO2 ⇔ 2Sr9Gd(VO4)7 + 18CO2↑ | (12) |
From mechanism (12), it can be shown that there are some Gd2O3 and SrO except for the main products of Sr9Gd(VO4)7/Sr2V2O7; however, it cannot be observed in Fig. 1(c) because the relative quantities of Gd2O3 and SrO are so small that XRD patterns cannot be indexed. In our investigation, we ignored the existence of the samples Gd2O3 and SrO because they do not influence the photoluminescence of Sr9Gd(VO4)7/Sr2V2O7:Eu.
3.2. Photoluminescence properties
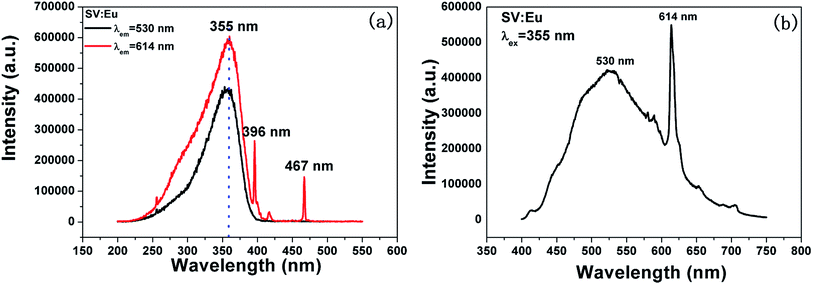
Fig. 3 shows the PL properties of Eu3+ in SV, which are different in the ref. 2 and 19. The emission spectrum (excited at 355 nm) is shown in Fig. 3(b). The emission spectrum contains a broadband emission in the 400–590 nm wavelength region with a maximum at about 530 nm and a sharp peak at 614 nm. The broad peak has a 30 nm redshift compared with the reported value of 500 nm, which is very large, but the breadth and peak of the broad band emission is similar to that of SV. This corresponds to the charge transfer from the O2− to V5+ localized within the tetrahedrally coordinated VO43− group. The sharp peak at 614 nm originates from the 5D0 → 7F2 transition in Eu3+ dopant.
In Fig. 3(a), the excitation spectrum monitored at 614 nm has a broadband in the 250–400 nm wavelength region with the peak at 355 nm, which is close to the excitation spectrum monitored at 530 nm. This indicates that the broad excitation band arises due to the charge transfer from oxygen 2p orbital of O2− to an empty d orbital of V5+, and not to the orbital of Eu3+.
Coordination atoms and their bond lengths of four sites of Sr and four sites of V are listed in columns 2 and 3 of Table 1, respectively. All calculated  ,
,  and ΔESr/VM–O values of various possible substituted ions including Sr2+ and V5+ on both Sr2+ and V5+ sites are listed in Table 1. These results indicate that the value of bond energy variation is in the order Sr4 < Sr2 < Sr3 < Sr1 < V1 < V2 < V3 < V4. According to the bond energy method, Eu3+ ions should preferentially occupy the sites with smaller alterations of bond energy values, ΔESr/VEu–O. Within this energy formation argument, the priority site for the Eu3+ incorporation of the luminescent centers is Sr4.
 and
and  ), single and sum bond energies of Eu–O bonds in Sr2V2O7:Eu (
 and
and  ) and variation of bond energy (ΔESr/VM–O) when the Eu3+ ion is located at different Sr2+ and V5+ sites. All units of bond energy are kcal mol−1
| Central atom | Coordination atom | d (Å) | ΔESr/VEu–O | ||||
|---|---|---|---|---|---|---|---|
| Sr1 | O14 | 2.4848 | 44.45 | 254.1 | 24.03 | 137.3 | 15.84 |
| O1 | 2.5205 | 40.37 | 21.82 | ||||
| O6 | 2.5283 | 39.52 | 21.36 | ||||
| O6 | 2.5613 | 36.15 | 19.54 | ||||
| O11 | 2.5807 | 34.30 | 18.54 | ||||
| O2 | 2.7065 | 24.42 | 13.20 | ||||
| O9 | 2.7374 | 22.46 | 12.14 | ||||
| O8 | 2.9578 | 12.38 | 6.692 | ||||
| Sr2 | O10 | 2.5407 | 38.22 | 229.8 | 20.66 | 124.2 | 11.7 |
| O4 | 2.5415 | 38.14 | 20.62 | ||||
| O5 | 2.6112 | 31.59 | 17.08 | ||||
| O2 | 2.6231 | 30.59 | 16.54 | ||||
| O12 | 2.6275 | 30.23 | 16.34 | ||||
| O9 | 2.6771 | 26.44 | 14.29 | ||||
| O13 | 2.8247 | 17.74 | 9.589 | ||||
| O11 | 2.9948 | 11.20 | 6.055 | ||||
| O7 | 3.2494 | 5.629 | 3.043 | ||||
| Sr3 | O4 | 2.5307 | 39.27 | 234.9 | 21.23 | 127.0 | 12.0 |
| O2 | 2.6431 | 28.98 | 15.67 | ||||
| O10 | 2.6439 | 28.92 | 15.63 | ||||
| O1 | 2.6481 | 28.59 | 15.45 | ||||
| O7 | 2.6617 | 27.56 | 14.90 | ||||
| O13 | 2.6949 | 25.19 | 13.62 | ||||
| O10 | 2.7036 | 24.61 | 13.30 | ||||
| O5 | 2.8155 | 18.19 | 9.831 | ||||
| O8 | 2.9238 | 13.57 | 7.336 | ||||
| Sr4 | O5 | 2.5484 | 37.43 | 238.5 | 20.23 | 128.9 | 10.96 |
| O9 | 2.5537 | 36.90 | 19.95 | ||||
| O6 | 2.5653 | 35.76 | 19.33 | ||||
| O14 | 2.6598 | 27.70 | 14.97 | ||||
| O3 | 2.662 | 27.54 | 14.89 | ||||
| O8 | 2.7251 | 23.22 | 12.55 | ||||
| O13 | 2.7647 | 20.86 | 11.28 | ||||
| O11 | 2.8376 | 17.13 | 9.261 | ||||
| O7 | 3.1886 | 6.635 | 3.586 | ||||
| O1 | 3.2685 | 5.346 | 2.890 | ||||
| V1 | O14 | 1.6626 | 133.2 | 465.4 | 554.3 | 1937 | 368 |
| O13 | 1.6828 | 126.1 | 524.9 | ||||
| O9 | 1.7047 | 118.9 | 494.7 | ||||
| O3 | 1.8192 | 87.23 | 363.0 | ||||
| V2 | O4 | 1.6677 | 131.4 | 467.1 | 546.7 | 1944 | 369 |
| O11 | 1.6693 | 130.8 | — | 544.4 | |||
| O2 | 1.7114 | 116.7 | — | 485.8 | |||
| O12 | 1.8151 | 88.20 | — | 367.1 | |||
| V3 | O7 | 1.6572 | 135.1 | 468.1 | 562.5 | 1948 | 370 |
| O10 | 1.6868 | 124.8 | 519.2 | ||||
| O5 | 1.6959 | 121.7 | 506.6 | ||||
| O12 | 1.8222 | 86.52 | 360.1 | ||||
| V4 | O8 | 1.6597 | 134.2 | 474.2 | 558.7 | 1974 | 375 |
| O1 | 1.6758 | 128.5 | 534.9 | ||||
| O6 | 1.695 | 122.0 | 507.8 | ||||
| O3 | 1.81 | 89.42 | 372.2 |
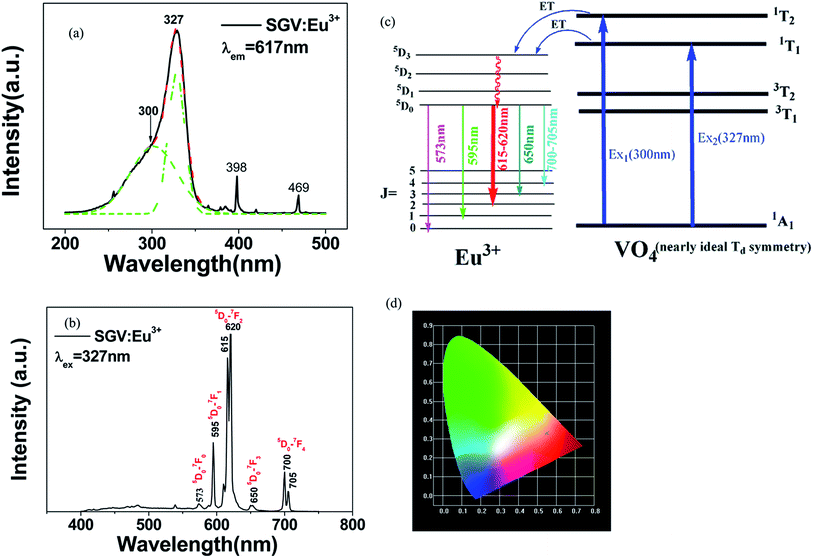
Comparing the O–V CT energy in pure sample SV (355 nm), the CT energy of [VO4]3− in pure SGV (327 nm) is much higher. This is because the crystal field or environmental factor (he) around V atoms in the two samples is different.28
Fig. 4(b) shows the emission spectra of SGV:Eu excited at 327 nm. The SGV:Eu phosphor shows bright red color. The (x, y) chromaticity coordinate of SGV is (0.547, 0.333) in the red region. Fig. 4(d) shows a graphic of the CIE 1931 chromaticity coordinate of pure SGV phosphors excited at 327 nm. As shown in Fig. 4(b), the dominant red emission bands of 615 and 620 nm are attributed to the electric dipole transition 5D0 → 7F2, indicating that Eu3+ ions are located at the sites of non-inversion symmetry. The emission peaks at about 573, 595, 650, and 700–705 nm are derived from the transition of 5D0 → 7F0, 5D0 → 7F1, 5D0 → 7F3, and 5D0 → 7F4, respectively, which are much weaker than the intensity of 5D0 → 7F2.
Consequently, 5D0 → 7F2 red emission (615 and 620 nm) presents the most prominent intensity in the emission spectrum. In SGV:Eu, the structure of SGV is isotypical with that of Sr9Lu(VO4)7, so Sr9Gd(VO4)7 can be analyzed according to the structure in the reference. In Sr9Gd(VO4)7, there are three different Sr or V sites and one Gd site; their coordination atoms are summarized in Table 3.
All calculated  ,
,  and ΔESr/VEu–O values of various possible substituted ions including Sr2+, Gd3+and V5+ on both Sr2+, Gd3+and V5+ sites are listed in Table 3. The result indicates that the value of bond energy variation is in the order Gd1 < Sr3 < Sr1 < Sr2 < V2 < V3 < V1. According to the bond energy method, Eu3+ ions should preferentially occupy the sites with smaller alterations of bond energy values ΔESr/Gd/VEu–O. Within this energy formation argument, the priority site for the Eu3+ incorporation of the luminescent centers is Gd.
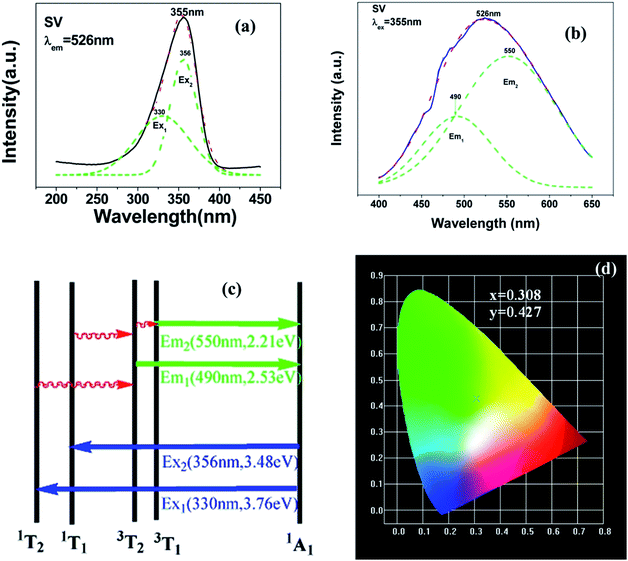
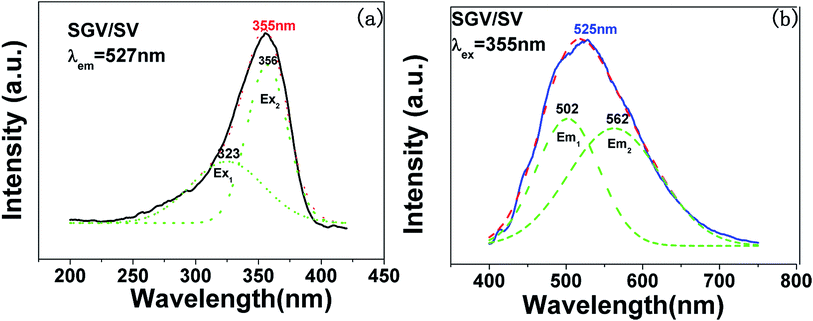
The excitation and emission spectra of “pure” SGV/SV are shown in Fig. 5. The peaks, full wave at half maximum (FWHM), Ex1 and Ex2 as well as Em1 and Em2 of excitation and emission spectra for “pure” SGV/SV are listed in Table 2.
| Compound | Excitation spectrum (nm) | Emission spectrum (nm) | ||||
|---|---|---|---|---|---|---|
| Peak position | FWHM | Peak position | FWHM | |||
| SV | 355 | 330, 356 | 50 | 526 | 550, 490 | 140 |
| SGV | 327 | 300, 327 | 50 | No | No | No |
| SGV/SV | 355 | 323, 356 | 52 | 525 | 562, 502 | 137 |
 and
and  ), single and sum bond energies of Eu–O bonds in Sr9Gd(VO4)7:Eu (
 and
and  ) and variation of bond energy (|ΔE|) when the Eu3+ ion is located at different Sr2+ and V5+ sites. All units of bond energy are kcal mol−1
| Central atom | Coordination atom | d (Å) | |ΔE| | ||||
|---|---|---|---|---|---|---|---|
| Sr1 | O8 | 2.4607 | 47.45 | 248.0 | 25.65 | 134.0 | 15.49 |
| O10 | 2.496 | 43.13 | 23.31 | ||||
| O7 | 2.5922 | 33.25 | 17.98 | ||||
| O2 | 2.6146 | 31.30 | 16.92 | ||||
| O5 | 2.6353 | 29.60 | 16.00 | ||||
| O6 | 2.6453 | 28.81 | 15.57 | ||||
| O6 | 2.7103 | 24.17 | 13.06 | ||||
| O4 | 3.0266 | 10.28 | 5.556 | ||||
| Sr2 | O5 | 2.5086 | 41.69 | 240.2 | 22.53 | 129.8 | 15.76 |
| O2 | 2.5139 | 41.09 | 22.21 | ||||
| O4 | 2.5867 | 33.75 | 18.24 | ||||
| O3 | 2.5871 | 33.72 | 18.22 | ||||
| O9 | 2.6318 | 29.88 | 16.15 | ||||
| O9 | 2.6856 | 25.84 | 13.97 | ||||
| O8 | 2.8354 | 17.23 | 9.316 | ||||
| O7 | 2.8411 | 16.97 | 9.173 | ||||
| Sr3 | O5 | 2.5899 | 33.46 | 216.5 | 18.09 | 117.0 | 11.05 |
| O4 | 2.5902 | 33.44 | 18.07 | ||||
| O7 | 2.6004 | 32.53 | 17.58 | ||||
| O1 | 2.7138 | 23.94 | 12.94 | ||||
| O10 | 2.7203 | 23.52 | 12.72 | ||||
| O10 | 2.7381 | 22.42 | 12.12 | ||||
| O8 | 2.7733 | 20.38 | 11.02 | ||||
| O3 | 2.8996 | 14.49 | 7.832 | ||||
| O2 | 2.9599 | 12.31 | 6.654 | ||||
| Lu1/Gd1 | O6 | 2.1762 | 72.32 | 401.3 | 83.00 | 460.5 | 9.89 |
| O6 | 2.1762 | 72.32 | 83.00 | ||||
| O6 | 2.1762 | 72.32 | 83.00 | ||||
| O9 | 2.2365 | 61.44 | 70.51 | ||||
| O9 | 2.2365 | 61.44 | 70.51 | ||||
| O9 | 2.2365 | 61.44 | 70.51 | ||||
| V1 | O1 | 1.6822 | 126.3 | 489.1 | 525.7 | 2036 | 386.8 |
| O2 | 1.6983 | 120.9 | 503.3 | ||||
| O2 | 1.6983 | 120.9 | 503.3 | ||||
| O2 | 1.6983 | 120.9 | 503.3 | ||||
| V2 | O3 | 1.6505 | 137.6 | 477.5 | 572.7 | 1988 | 377.5 |
| O5 | 1.7026 | 119.5 | 497.5 | ||||
| O4 | 1.7078 | 117.9 | 490.6 | ||||
| O6 | 1.7594 | 102.5 | 426.7 | ||||
| V3 | O7 | 1.6726 | 129.6 | 483.4 | 539.5 | 2012 | 382.3 |
| O10 | 1.687 | 124.7 | 518.9 | ||||
| O8 | 1.7157 | 115.4 | 480.2 | ||||
| O9 | 1.721 | 113.7 | 473.4 |
In contrast with the values of pure SV, all the parameters are almost the same, which demonstrate that the emission with the peak at 525 nm comes from the SV in SGV/SV.
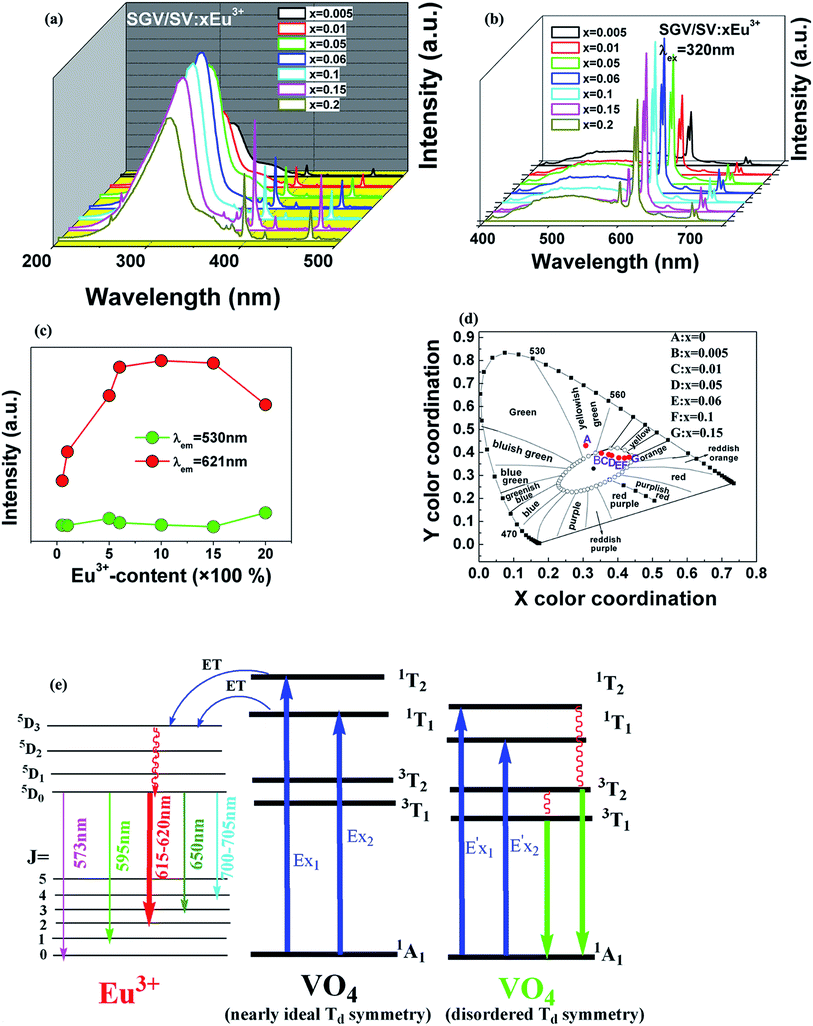
The typical excitation and emission of SGV/SV:5% Eu3+, represented by SGV/SV:5% Eu3+, monitored with different wavelengths and excited at different wavelengths are shown in Fig. 6(a) and (b). Similar excitation spectra with two strong broad bands (at about 320 and 350 nm) can be observed in SGV/SV:Ln3+ (Ln3+ = Sm3+, Dy3+, or Tm3+) as shown in Fig. S1.† It therefore can be demonstrated that the two broad excitation spectra of SGV/SV:Eu3+ arise from the O → V charge transfer of the host lattice, i.e., SGV/SV and not from the CT transition of O2− → Eu3+. Under 315 nm UV light irradiation, SGV/SV:5% Eu3+ shows warm white light emission, consisting of a strong broad band (400–650 nm) with a maximum at 530 nm and some sharp f–f transitions of Eu3+ ions with the peaks at 595, 615 and 621, 700 and 705 nm attributed to, 5D0 → 7F1, 5D0 → 7F2 and 5D0 → 7F4, respectively. The f–f transition peak position of Eu3+ in SGV/SV:5% Eu3+ are similar to those in SGV:5% Eu3+, which demonstrates that the Eu3+ ions enter the crystal of SGV. However, the relative strengths at 595, 621 and 700 nm of SGV/SV:5% Eu3+ are changed, which can be expressed using I(5D0 → 7F1)![[thin space (1/6-em)]](https://www.rsc.org/images/entities/char_2009.gif) :
:![[thin space (1/6-em)]](https://www.rsc.org/images/entities/char_2009.gif) I(5D0 → 7F2)
I(5D0 → 7F2)![[thin space (1/6-em)]](https://www.rsc.org/images/entities/char_2009.gif) :
:![[thin space (1/6-em)]](https://www.rsc.org/images/entities/char_2009.gif) I(5D0 → 7F4), that is, 2.1
I(5D0 → 7F4), that is, 2.1![[thin space (1/6-em)]](https://www.rsc.org/images/entities/char_2009.gif) :
:![[thin space (1/6-em)]](https://www.rsc.org/images/entities/char_2009.gif) 6.57
6.57![[thin space (1/6-em)]](https://www.rsc.org/images/entities/char_2009.gif) :
:![[thin space (1/6-em)]](https://www.rsc.org/images/entities/char_2009.gif) 1. Moreover, comparing with the f–f transition of Eu3+ in pure SGV (Fig. 4(b)), whose relative value is 1.74
1. Moreover, comparing with the f–f transition of Eu3+ in pure SGV (Fig. 4(b)), whose relative value is 1.74![[thin space (1/6-em)]](https://www.rsc.org/images/entities/char_2009.gif) :
:![[thin space (1/6-em)]](https://www.rsc.org/images/entities/char_2009.gif) 4.48
4.48![[thin space (1/6-em)]](https://www.rsc.org/images/entities/char_2009.gif) :
:![[thin space (1/6-em)]](https://www.rsc.org/images/entities/char_2009.gif) 1, the red light was demonstrated to be enhanced in SGV/SV:5% Eu3+ compared with the pure SGV:5% Eu3+.
1, the red light was demonstrated to be enhanced in SGV/SV:5% Eu3+ compared with the pure SGV:5% Eu3+.
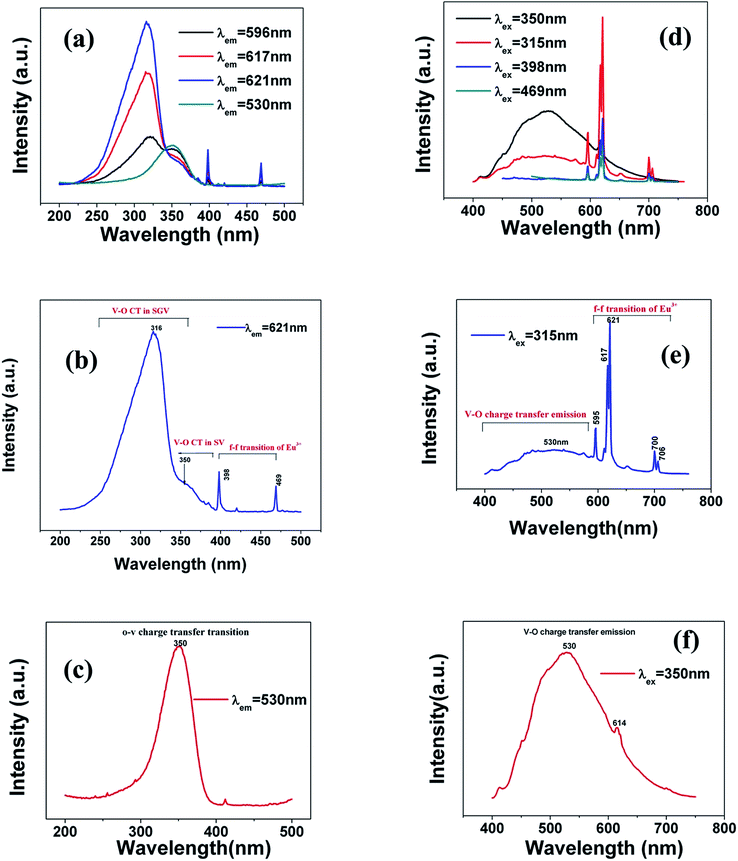 | ||
| Fig. 6 (a), (b) and (c) are excitation spectra of SGV/SV:Eu3+ and (d), (e) and (f) are emission spectra of SGV/SV:Eu3+ under different excitation spectra. | ||
The excitation spectrum (Fig. 6(b), blue line) recorded by monitoring the emission of 621 nm (the strongest emission line in the PL spectrum shown in Fig. 6(e)) contains two visible broad absorption bands at 315 and 350 nm as well as some dominated sharp lines in the wavelength region of 350 to 500 nm due to the characteristic f–f transition of Eu3+ at about 398 and 469 nm. Under 350 nm UV radiation excitation, the SGV/SV:Eu exhibits green emission, and the obtained emission spectrum consists of a broad band with the peak at 530 nm due to the CT transition of O2− → V5+ of SV and very weak f–f transition lines at 614 nm within the Eu3+ electron configuration. Thus, SV in SGV/SV can retain its excitation energy for strong green emission and its energy transfer efficiency to Eu3+ is lower. Monitored at 530 nm, the excitation spectrum of SGV/SV:Eu3+ sample displays a broad absorption band with the peak at 350 nm, as shown in Fig. 6(c), which is similar to the peak of pure SV. This asserts that the broad excitation band in SGV/SV:Eu3+ originates from the CT transition of O2− → V5+ of SV. Another broad band at 315 nm in SGV/SV:Eu3+ must arise from the CT transition of O2− → V5+, which has larger blue-shift compared with the O2− → V5+ CT transition of pure SGV at 327 nm (Fig. 4(a)). This is due to the change of crystal environment around V atoms and the existence of oxygen deficiency.29 The SGV:Eu3+ was obtained at 950 °C, and the SGV/SV:Eu was obtained at 750 °C. With increasing calcination temperature, the crystallization of SGV increases, which changes the lattice constant and the oxygen deficiency around V atoms. The change of the lattice constant is small, which generally makes a 1–5 nm shift in CT band, while 5–15 nm blue-shift primarily arises due to of oxygen deficiency.29
| Sample no | Sample composition (x) | CIE coordinates (x, y) |
|---|---|---|
| A | 0 | (0.303, 0.436) |
| B | 0.005 | (0.349, 0.401) |
| C | 0.01 | (0.370, 0.395) |
| D | 0.05 | (0.376, 0.391) |
| E | 0.06 | (0.406, 0.384) |
| F | 0.1 | (0.418, 0.379) |
| G | 0.15 | (0.431, 0.382) |
Except that the emission of “pure” SGV/SV is at green region, all other SGV/SV:xEu3+ phosphors (x = 0.005, 0.01, 0.05, 0.1, and 0.15) exhibit warm-white-light emissions. Therefore, we can realize white light in a single component. This component consists of two types of host lattices and one type of rare earth ion activator (Eu3+), which can achieve the perfect union between the red f–f transition emission of Eu3+ and the O2− → V5+ CT transition emission from the two different vanadate host lattices with different [VO4]3− symmetries under the UV light excitation. This is a very promising novel method with a wide range of adaptability to obtain white or other color lights.
4. Conclusions
1. The vanadate-based phosphors Sr2V2O7:Eu3+ (SV:Eu3+), and Sr9Gd(VO4)7:Eu3+ (SGV:Eu3+) and their products Sr9Gd(VO4)7/Sr2V2O7:xEu3+ (SGV/SV:xEu3+) were prepared by solid-state reaction at low temperature.2. The bond-energy method is used to investigate the site occupancy preference of Eu3+ based on the bond valence model. By comparing the change in bond energy when the Eu3+ ions are incorporated into different Sr or V or Gd sites, we observed that Eu3+ in SV, SGV or SV/SGV would preferentially occupy the smaller energy variation sites Sr4, Gd and Gd sites, respectively.
3. PL properties of Sr2V2O7:Eu3+ (SV:Eu3+) and Sr9Gd(VO4)7:Eu3+ (SGV:Eu3+) and their products Sr9Gd(VO4)7/Sr2V2O7:xEu3+ (SGV/SV:xEu3+) were investigated, which shows their excitation and emission characteristics. Their excitation wavelengths ranging from 220 to 400 nm fit well with the characteristic emission of UV light-emitting diode (LED) chips. Two broad charge transfer bands arising from O2− → V5+ of [VO4]3− with the peaks at about 325 and 350 nm coexist in SGV/SV:Eu3+, which indicates that the phosphors can be efficiently excited in the UV region.
4. Eu3+ ions primarily enter the sites of Gd3+ of SGV. The photoluminescence properties of SGV/SV:Eu3+ component shows two prominent properties: first is that V–O CT energy of SGV can be efficiently transferred to Eu3+ and strong red photoluminescence can occur coming from the 5D0 → 7F2 transition of Eu3+; second is that the intensity of V–O CT transition emission originating from SV is not influenced by the concentration of Eu3+ and retains green light emission.
5. With the increase in concentration of Eu3+ from 0.5 to 15 mol%, the intensity of red f–f transition of Eu3+ at 621 nm increases, and concentration quenching was observed 20 mol%. All the SGV/SV:xEu3+ (x = 0.005, 0.01, 0.05, 0.1, and 0.15) phosphors exhibit warm-white-light emission.
Conflicts of interest
There are no conflicts to declare.Acknowledgements
This research was supported by the Basic Science Research Program through the National Research Foundation of Korea (NRF) funded by the Ministry of Education, Science and Technology (no. 2013012655). “Preferential Occupancy of Eu3+ and energy transfer in Eu3+ doped Sr2V2O7, Sr9Gd(VO4)7 and Sr2V2O7/Sr9Gd(VO4)7 Phosphors” was supplied by the Display and Lighting Phosphor Bank at Pukyong National University. This work is also supported by the National Natural Science Foundations of China (Grant No. 21301053).References
- T. Nakajima, M. Isobe, T. Tsuchiya, Y. Ueda and T. Manabe, J. Phys. Chem. C, 2010, 114, 5160–5167 CAS.
- W.-Q. Yang, H.-G. Liu, M. Gao, Y. Bai, J.-T. Zhao, X.-D. Xu, B. Wu, W.-C. Zheng, G.-K. Liu and Y. Lin, Acta Mater., 2013, 61, 5096–5104 CrossRef CAS.
- C. Qin, Y. Huang and H. J. Seo, J. Am. Ceram. Soc., 2013, 96, 1181–1187 CrossRef CAS.
- X. Wu, Y. Huang, L. Shi and H. J. Seo, Mater. Chem. Phys., 2009, 116, 449–452 CrossRef CAS.
- T. Nakajima, M. Isobe, T. Tsuchiya, Y. Ueda and T. Kumagai, Nat. Mater., 2008, 7, 735–740 CrossRef CAS PubMed.
- X. Chen and Z. Xia, Opt. Mater., 2013, 35, 736–2739 Search PubMed.
- X. Chen, Z. Xia, M. Yi, X. Wu and H. Xin, J. Phys. Chem. Solids, 2013, 74, 1439–1443 CrossRef CAS.
- D. Wawrzynczyk, M. Nyk and M. Samoc, J. Mater. Chem. C, 2013, 1, 5837–5842 RSC.
- H. Gobrecht and G. Heinsohn, J. Phys., 1957, 147, 350–360 CAS.
- H. Ronde and G. Blasse, J. Inorg. Nucl. Chem., 1978, 40, 215–219 CrossRef CAS.
- S. Benmokhtar, A. El Jazouli, J. P. Chaminade, P. Gravereau, F. Guillen and D. De Waal, J. Solid State Chem., 2004, 177, 4175–4182 CrossRef CAS.
- L. Liu, R.-J. Xie, N. Hirosaki, Y. Li, T. Takeda, C.-N. Zhang, J. Li and X. Sun, J. Am. Ceram. Soc., 2010, 93, 4081–4086 CrossRef CAS.
- K.-C. Park and S.-i. Mho, J. Lumin., 2007, 122–123, 95–98 CrossRef CAS.
- B. C. Chakoumakos, M. M. Abraham and L. A. Boatner, J. Solid State Chem., 1994, 109, 197–202 CrossRef CAS.
- P. Yong, T. Ke, Z. Da-Chuan, H. Tao, Z. Cong and P. Ling-Ling, Nano-Micro Lett., 2013, 5, 117–123 CrossRef.
- M. Sayer, Phys. Status Solidi A, 1970, 1, 269–277 CrossRef CAS.
- T. Nakajima, M. Isobe, T. Tsuchiya, Y. Ueda and T. Manabe, Opt. Mater., 2010, 32, 1618–1621 CrossRef CAS.
- Z. Zhou, F. Wang, S. Liu, K. Huang, Z. Li, S. Zeng and K. Jiang, J. Electrochem. Soc., 2011, 158, H1238–H1241 CrossRef CAS.
- S. V. B. Taxak and S. P. Khatkar, J. Fluoresc., 2012, 22, 891–897 CrossRef PubMed.
- Y. He and D. Xue, J. Phys. Chem. C, 2007, 111, 13238–13243 CAS.
- J. Huang and A. W. Sleight, Mater. Res. Bull., 1992, 27, 581–590 CrossRef CAS.
- J. Ziólkowski and L. Dziembaj, J. Solid State Chem., 1985, 57, 291–299 CrossRef.
- I. D. Brown and D. Altermatt, Acta Crystallogr., Sect. B: Struct. Sci., 1985, 41, 244–247 CrossRef.
- A. A. Belik, M. Takano, M. V. Boguslavsky, S. Y. Stefanovich and B. I. Lazoryak, Chem. Mater., 2004, 17, 122–129 CrossRef.
- R. Gopal and C. Calvo, J. Crystallogr., 1973, 137, 67–89 CAS.
- Luminescence and Energy Transfer, ed. G. Blasse, Berlin, 2006 Search PubMed.
- A. Sanson, M. Giarola, B. Rossi, G. Mariotto, E. Cazzanelli and A. Speghini, Phys. Rev. B: Condens. Matter Mater. Phys., 2012, 86, 214305 CrossRef.
- L. Li and S. Y. Zhang, J. Phys. Chem. B, 2006, 110, 21438–21443 CrossRef CAS PubMed.
- M. Wang, H. Zhang, L. Li, X. Liu, F. Hong, R. Li, H. Song, M. Gui, J. Shen, W. Zhu, J. Wang, L. Zhou and J. H. Jeong, J. Alloys Compd., 2014, 585, 138–145 CrossRef CAS.
- M. Jiao, N. Guo, W. Lü, Y. Jia, W. Lv, Q. Zhao, B. Shao and H. You, Inorg. Chem., 2013, 52, 10340–10346 CrossRef CAS PubMed.
- M. Shang, G. Li, D. Geng, D. Yang, X. Kang, Y. Zhang, H. Lian and J. Lin, J. Phys. Chem. C, 2012, 116, 10222–10231 CAS.
- C. Zhang, Z. Hou, R. Chai, Z. Cheng, Z. Xu, C. Li, L. Huang and J. Lin, J. Phys. Chem. C, 2010, 114, 6928–6936 CAS.
Footnote |
| † Electronic supplementary information (ESI) available. See DOI: 10.1039/c7ra08089a |
| This journal is © The Royal Society of Chemistry 2018 |

