 Open Access Article
Aggregation of catalytically active Ru nanoparticles to inactive bulk, monitored in situ during an allylic isomerization reaction. Influence of solvent, surfactant and stirring†
M. Hitrik and
Y. Sasson*
Institute of Chemistry, The Hebrew University of Jerusalem, Edmond J. Safra Campus, Jerusalem, 9190401, Israel. E-mail: Maria.hitrik@mail.huji.ac.il
First published on 4th January 2018
Abstract
The exploration of catalytic isomerization reactions of an allylic alcohol to ketone, in the presence of μ-oxo-triruthenium acetate as a precatalyst in alcohol solvents, has established that the catalyst is heterogeneous in nature and proceeds by means of the in situ formed Ru0 nanoparticles (Ru0NPs). This reaction is used as an indicator for evaluating the kinetics and mechanism for metallic NP formation and self-assembly. In ethanol, complete conversion of the reactant is achieved under all experimental conditions tested. Conversely, in iso-propanol or n-pentanol the catalytic particles swiftly lose activity and the reaction arrests after partial conversion. We conclude that, in ethanol the process of NP self-assembly results in the formation of active and stable NPs of a specific size, named C-particles. Consequently, we propose an additional step for the established mechanism of NP self-assembly, namely the aggregation of C-NPs to inactive bulk-metal, labeled as D (C + C → D). D-particles differ from other NPs present in the catalytic cycle in size and in the catalytic activity. The effect of surfactant and mixing is also explored and the acquired observations strongly support the proposed mechanism of catalyst formation and decay. Addition of surfactants and/or mixing slowed down the reaction rate but dramatically improved the lifetime of the catalyst and the observed conversions. We attribute this phenomenon to the inhibition of the aggregation step of the active C-NPs to inactive D bulk-metal. The aggregation step of C-NPs to inactive D-bulk is assumed for the first time. This assumption prompts all the experimental data to be consistent. Introduction of the new kinetic step enables the use of the proposed mechanism with the reactions, where the catalyst loses its activity in the course of the reaction, and it converts the mechanism of the metal NP self-assembly into the more universal form.
Introduction
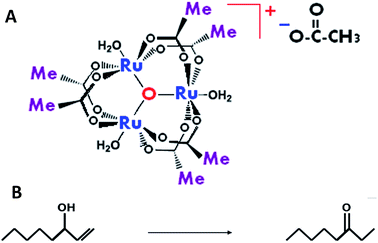
One of the noteworthy applications of metallic nanoparticles (NPs) is catalysis in various chemical processes.1–3 The usage of soluble nanocluster catalysts provides several advantages over traditional heterogeneous catalysis. For example, NPs are often more catalytically active under mild conditions and more selective in comparison with corresponding bulk metal.1,4,5 The solubility allows homogeneous contact, larger surface area, simpler analysis, and usage of analytical techniques (IR, NMR, etc.) similar to homogeneous reactions. In addition, the solubility of NPs enables homogeneous, solution-phase kinetic studies.6 Nonetheless, there are some drawbacks such as low catalyst stability and demanding separation and recycling methods. The detailed perception of the kinetic model of NP formation is critical for the design of effective, rapid and selective catalytic processes. In addition, a detailed study of NP self-assembly mechanisms is essential for the engineering of particles of a desired size and shape, thus determining their functionality in different applications.In our earlier report7 we scrutinized the behavior of μ-oxo-triruthenium acetate (the complex) (Scheme 1A)8 in the isomerization reaction of 1-octene-3-ol to 3-octanone (reaction (1)) (Scheme 1B) in ethanol. The Ru complexes are of the most active catalysts for the transformation isomerization of 3-octen-1-ol into 3-octanone in protic a media.9,10 A similar reaction was studied by Dikhtiarenko et al.,11 under different experimental conditions without any reflection on the reaction mechanism, and only fractional yields were obtained.
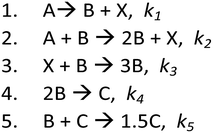
The main conclusion of our previous study was that the Ru3+-complex is catalytically inactive in the isomerization process, in its initial form, and in the course of reaction (1), it is reduced in situ to Ru0. The latter metallic atoms are self-assembled to form Ru0NPs that catalyzed reaction (1). The proposed mechanism of this reaction differs from the conventional type reported in the literature.6,12–18 We demonstrated that in the case of a composite complex structure, the order of the reduction of metallic centers influences the NPs self-assembly mechanism, and in its turn, affects the kinetic profile of isomerization reaction (1). Schematically speaking, the proposed kinetic model is as follows see Scheme 2 (mechanism 1).
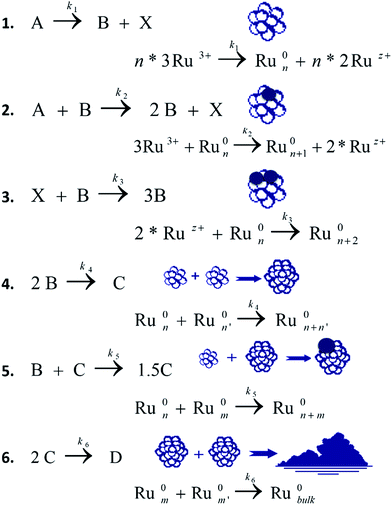
Briefly, based on previous studies,19,20 coupled with the best-fitted kinetic models, we suggest that in the first step, only one metallic center – Ru3+ (A) – of complex 1 is reduced, while the other two are left to act as ligands. The A turns to Ru0 and self-assemble to NPs from the nucleated size B. Ethanol serves as both solvent and reducing agent for Ru3+, and ethanol is oxidized in parallel. B-NPs autocatalyze the following reduction process of the same center, A, to give 2B. Only when almost the whole amount of A is reduced, the other two Ru+3 species (complex X) undergo reduction in presence of B-particle catalysis – step 3. In step 4, two B-particles agglomerate to generate the larger C-NPs. In the literature, it states that the C-NPs are often the true catalysts that are suitable for use in various systems.16,21,22 In the fifth step, the agglomeration of C and B particles results in the formation of a C-particle, in agreement with the general model proposed by Finke.23,24 The best fit theoretical profile shows good agreement between mechanism 1 and the data obtained experimentally, where C-NPs are the true isomerization reaction catalyst.
In the present study, we examined additional alcohol-solvents, namely n-pentanol and iso-propanol. The interesting results attained encouraged us to revise mechanism 1 to a more general form. The phenomenon of deactivation of the catalyst, before complete conversion is realized, indicates that one more step has to be included into the general mechanism of transition metal NPs self-assembly. This step is the aggregation of the reactive C-NPs to the less active (or nonreactive) form of bulk metal, which is termed D: C + C → D. We demonstrate that under specific reaction conditions the active C-catalyst loses its activity while being aggregated to the larger D-particles, resulting in only partial conversion of reaction (1). To the best of our knowledge, no prior report has been made regarding a procedure for the agglomeration of C particles to other kind of particles. In additional experiments we confirmed that the aggregation process is slowed down when surfactants and/or stirring are applied on the reaction mixture: both reduce the reaction rate but at the same time increase the final conversions of reaction (1). This is achieved by expanding the catalyst lifetime.
The addition of this step and the introduction of the new variable into the reaction kinetic mechanism turns the kinetic model to be more general and more universal, that can describe wider spectrum of the catalytic reactions. Using this mechanism, the process of transition metal NPs self-assembly is described in a more complete way. At the same time, the reactions, where the catalytic NPs, first, are assembled to the C NPs, and, second, aggregate to the inactive particles D can be described well using this general mechanism.
Experimental
Synthesis of the complex
Preparation of the complex was performed by the standard procedure25 (see Section ESI 1.1†).Reaction conditions
Experiment (a): the following protocol was used as a standard: 5 ml of reaction solvent (ethanol, n-pentanol or iso-propanol) was placed in a three-necked, round-bottom flask (25 ml), equipped with reflux condenser and thermometer, and heated to the desired temperature (ethanol – 80 °C, n-pentanol – 100 °C, iso-propanol – 80 °C). Then, 0.5 mg of pre-prepared catalyst, μ-oxo-triruthenium acetate, was dissolved in the reaction solvent. The ReactIR 4000 probe was inserted into the third neck to measure in situ IR spectra of the reaction mixture. The solvent with the dissolved catalyst was used as a background for the IR measurement. Next, 4.2 g (32.8 mmol) of reactant 1 (1-octene-3-ol) was added. The reaction took place under reflux conditions, until no more product formation was observed (less than 2 h). In ethanol, the reaction composition was with reactant 1 concentrations in the range of 0.91 (M) ≤ [reactant 1] ≤ 3.6 (M) and catalyst concentration in the range of 1.48 × 10⁻⁵ (M) ≤ [complex] ≤ 10−3 (M). In n-penthanol, the ranges of reactant 1 concentrations were from 0.91 M ≤ [reactant 1] ≤ 3.6 (M), and the catalyst concentrations were from the range of 1.3 × 10⁻⁵ (M) ≤ [complex] ≤ 2 × 10⁻³ (M). For iso-propanol solvent, the concentration ranges were: 0.91 (M) ≤ [reactant 1] ≤ 3.6 (M), 1.1 × 10⁻⁵ (M) ≤ [complex] ≤ 0.0003 (M).Experiments (b): with stirring.
Experiments (c): with Aliquat 336, and (d) with stirring and Aliquat 336, are described in Section ESI 1.2.†
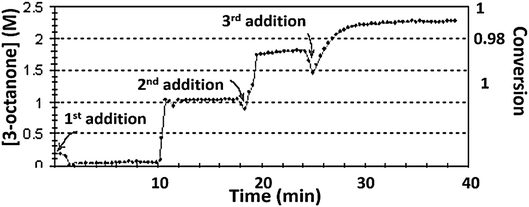
Experiments (d): recycling test – first cycle: the reaction (1) with iso-propanol as a solvent, containing reactant 1 and the complex, TON = 4.29 × 10³ ± 100, took place until the full conversion. Second cycle – following the first cycle completion, another portion of the reactant 1 was added. When the second cycle reaction was finished, another portion of the reactant 1 was injected. The TON of the reactant 1 stayed constant in all additions, regarding to the initial concentration of the complex. The catalyst 1 was not renewed. The profile of the reaction was measured continuously during three cycles, to obtain a step-wise curve.
Note: to simplify the demonstration, we report mainly on the turnover number (TON) rather than on the concentration of the catalyst. TON, considering batch reactor with constant volume, is defined as follows:
| TON = [1-octene-3-ol]0/[complex]0 | (1) |
Materials and methods
Methods for mechanism optimization. MacKinetics is an integrated package for modeling chemical reaction kinetics. Version 0.9b runs on any Macintosh computer with a 68020 CPU and math coprocessor. Version 0.9.1b runs on Power Macintosh computers.26
Results
Reaction profile
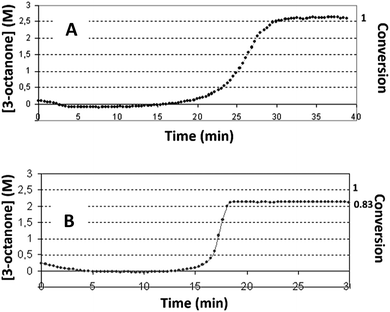
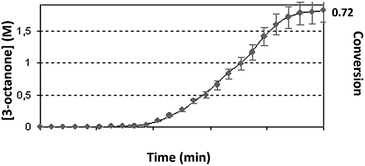
In this work, the kinetic profile of reaction (1) is monitored on-line by following the ATR-FTIR spectrum of the reaction mixture converted to concentration (see Fig. ESI 1†). Three different alcohols are examined as solvents: ethanol, n-pentanol and iso-propanol. In all solvents the profile of reaction (1) is of a sigmoidal shape with induction time followed by sharp acceleration, as was reported previously.7 In ethanol, the conversion of the reaction reaches 100%. However, with the other alcohols under identical conditions, the reaction does not always attain full conversion (see Fig. 1 with iso-propanol as solvent).With the same concentration as reactant 1, higher catalyst concentrations reveal full conversion (Fig. 1A), while at lower initial concentrations of the complex, only partial conversions are achieved. Here, the conversion is calculated using the concentration of product 1. The latter is performed based on the study which shows that product 1 is the major product (Section ESI 2†). The presence of induction time is attributed to the catalyst's transformations and not to the formation of intermediates. Intermediates can be detected with 3D ATR-FTIR spectrum of the reaction: the corresponding peaks should first rise, and then decline prior the formation of the main product. However, no such peaks were observed in the spectrum (Fig. ESI 1†).
Partial conversion in n-pentanol and in iso-propanol led us to modify the originally proposed mechanism 1 of the catalyst self-assembly. We still believe that the isomerization reaction (1) is catalyzed by Ru0NPs and not by the complex, but, obviously, the mechanism operative in n-pentanol and iso-propanol differs from that in ethanol. Thus, we aimed to develop a more general scheme that would be compatible with all three solvents.
The EDS results show the presence of Ru0 in the examined samples (Fig. ESI 6a†). The crystallographic structures of the lattices in the particles, in atomic scales, were determined by the SEAD pattern (Fig. ESI 6b†), taken from the aggregates. From this image, the fringe spacing of the agglomerate was found to be 2.06 (Å), in good agreement with the space between Ru(1 0 1) lattice planes. The spots obtained in the images are indexed as follows: (101), (110), (103) and (112) planes of the crystalline hexagonal closed-packed (hcp) structure (JCPDS-international center for diffraction data #01-089-4903) of Ru0 metal. This confirms that the NPs that form the aggregate are of single ruthenium crystal. HR-TEM was used to examine the NPs' crystal structure, and the following fringe spacings were observed: 2.33 (Å), 2.06 (Å), 1.6 (Å), 1.17 (Å), and 1.02 (Å). These values suite the spacing in a Ru lattice of a common crystal structure – hcp.27,28 Thus, we believe, that in all three solvents, Ru0NPs were formed in situ during the isomerization reaction.
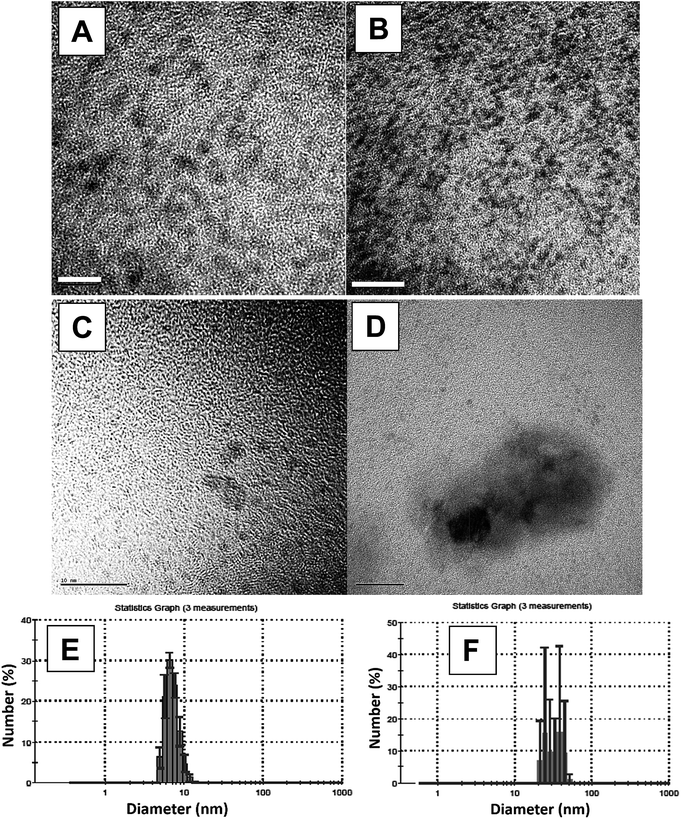
It was not possible to obtain good-resolution images of the particles because of sample-type difficulties (presence of organic phase). Thus, the sizes of these aggregates were estimated by DLS, and they were found to be larger than 20 nm (Fig. 2F). The size of the smaller particles ranged from 5.5–13 nm (Fig. 2E).
Conversions were measured at various reaction compositions to evaluate the activity of the catalyst in different solvents. Fig. 3 displays the final conversion plot vs. TON (eqn (1)) with iso-propanol as a solvent. The plots obtained with ethanol and n-pentanol are shown in Fig. ESI 7.†
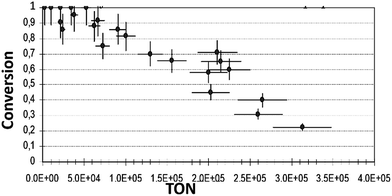 | ||
| Fig. 3 Final conversion vs. TON of reaction (1) in iso-propanol (reaction conditions as described in Exp. (a)). | ||
From the plots of conversion vs. TON, we may safely conclude that in ethanol, the final conversion is nearly complete in both, the low reactant-to-catalyst ratio (small TON values), and in a relatively high reactant-to-catalyst ratio (in the region of large TON values). However, in n-pentanol or iso-propanol, the conversions were 100%, or nearly 100%, only in the region of lower values of TON, i.e. where the concentrations of the complex was high in comparison with the concentration of the reactant. In n-pentanol, full conversions were detected up to ca. TON = 2 × 10⁴, and in iso-propanol up to ca. 5.24 × 10⁴. Significant decreases in conversions were observed in both solvents with increasing of TON: in n-pentanol, the declining is more substantial. In n-pentanol, at TON of ca. 2.78 × 10⁵, only 14% of substrate was consumed during the reaction, and in iso-propanol at the same TON, the maximum conversion was 22%. Therefore, we can deduce that some irreversible decline in the active catalyst concentration occurs during the reaction process in iso-propanol and in n-pentanol.
Another important parameter of catalyst activity is the maximum reaction rate (Vmax). The value is calculated from the reaction profile at it' inflection point – where the rate is maximal – in the units of M min−1, eqn (2):29
| Vmax = d[1-octene-3-ol]t/d[t], calculated in the point (t[1-octene-3-ol]), where d′′[1-octene-3-ol]t/d[t]′′ = 0 | (2) |
Fig. 4 presents the Vmax plot vs. TON for iso-propanol. Similar plots obtained with ethanol and iso-propanol are shown in Fig. ESI 8.†
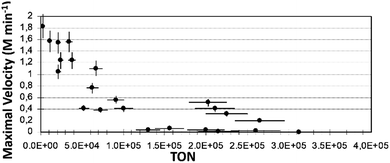 | ||
| Fig. 4 Plot of Vmax (M min−1) vs. TON obtained with iso-propanol as a solvent in reaction (1) (reaction conditions as described in Exp. (a)). | ||
The Vmax values show how fast the slope changes at the inflection point of the kinetic profile during the product formation process. This gives some indication of the duration of the reaction: the higher Vmax, the shorter the reaction time. However, this is not always the case, here we define the reaction time as the time that it takes the reaction to occur – from the end of induction period to the end of the product formation (reaching the asymptote). From the observed plots of all three solvents, it can be clearly seen that the lower the TON, the higher the value of Vmax. Maximal values of Vmax obtained were: in ethanol – Vmax ca. 3.7 (M min−1), in n-pentanol and in iso-propanol, the values were close to ca. 1.7 and 1.8 (M min−1), respectively.
In order to characterize the catalytic activity of the system, taking into consideration the time aspect we defined the turnover frequency parameter (TOF, min−1) as follows:
| TOF = [3-octanone]f/([complex]0 × time) | (3) |
TOF expresses the catalyst's activity in terms of the formation of the reaction product, 3-octanone per mole catalyst, with reference to the required time. TOF is an essential factor for comparing the relative activities of the catalyst in different solvents. The same trend was realized in all the solvents that have been studied. In Fig. 5 we show the TOF vs. TON plot for iso-propanol solvent. For ethanol and n-pentanol plots, see Fig. ESI 9.†
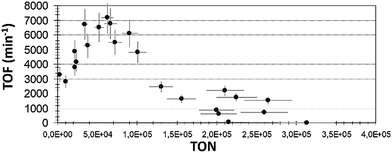 | ||
| Fig. 5 TOF plot with different TON reaction (1) values in iso-propanol solvent (reaction conditions as described in Exp. (a)). | ||
Interestingly, in the region of low TON, the TOF values were high, but not maximal. This indicates that here the catalyst did not show its highest potential activity. Probably, in this region, too large amount of catalyst was applied. The reaction occurred fast, i.e. a short time was needed to generate the product. Nevertheless, this does not mean that the applied amount (mol) of catalyst showed the highest activity. Moreover, this suggests that an excess quantity of the complex was used and that the ratio of [product]f/[catalyst]0 was relatively low, causing the values of TOF in this region to be somewhat smaller than the obtained maximum value (Table 1).
| Solvent | Range | Low TON | TOF min−1 | Mean TON | TOF min−1 | High TON | TOF min−1 |
|---|---|---|---|---|---|---|---|
| a Reaction conditions are as described in Exp. (a). | |||||||
| Ethanol | From: | 858 | 245 | 4.29 × 10⁴ | 3.2 × 10³ | 8.6 × 10⁴ | 2.6 × 10³ |
| To: | 2.14 × 10⁴ | 2.86 × 10³ | 5.8 × 10⁴ | 3.43 × 10³ | 2.2 × 10⁵ | 1.77 × 10³ | |
| n-Penatol | From: | 429 | 300 | 4.5 × 10³ | 2.6 × 10³ | 3.43 × 10³ | 2.1 × 10³ |
| To: | 4.3 × 10³ | 2.3 × 10³ | 3.7 × 10⁴ | 3.3 × 10³ | 2.8 × 10⁵ | 30 | |
| iso-Propanol | From: | 3 × 10³ | 2.8 × 10³ | 3.8 × 10⁴ | 6.1 × 10³ | 1 × 10⁵ | 4.8 × 10³ |
| To: | 3.43 × 10⁴ | 5.3 × 10³ | 9.1 × 10⁴ | 7.2 × 10³ | 3.13 × 10⁵ | 13 | |
The next region may be termed as an optimal balance, obtained at median TON ranges. Here, a smaller amount of catalyst was injected per one mol of the product (larger TON), and the maximum activity per one mol of catalyst was achieved in time. The time required for the reaction to propagate was longer, and the conversions might have been partial. However, the ratio of [product 1]f/[catalyst]0 was at any rate higher, and all this enabled the improved productivity of the system. This is an optimal region where a minimal amount of catalyst, used to maximize the manufacture of a product produced in time. The last area of interest is the decrease of TOF with the increase of TON – the range of high TON. This is the region of a very small concentration of catalyst used relatively to substrate concentration. Low conversions and long reaction times were obtained, and thus, the decline in TOF values was clearly seen. In the ethanol solvent, the decrease in TOF was less severe. From the obtained results, we assume that the concentration of the complex strongly influences the reaction propagation in n-pentanol and in iso-propanol, and at some point, the progress of the isomerization reaction either slows down or stops.
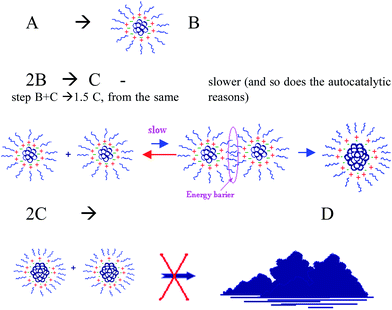
We assume that in both, n-pentanol and iso-propanol, the catalyst loses its activity during the course of the reaction. One of the conceivable reasons for this conduct is the aggregation of the active Ru0NPs to a large inactive bulk metal, as was identified with TEM and DLS (Fig. 2). Therefore, we attempted to modify mechanism 1 as follows: in previous studies, step B + C → 1.5C was titled autocatalytic agglomeration or, in the earlier studies, agglomeration to bulk, where C was assumed to be both the NPs (often, catalytically active) and a bulk non-active metal.15,21,23,24 In this work, we introduce a new term for step 5: the autocatalytic surface growth of C particle. This step was reserved in the mechanism, according to the best-fit model. However, our speculation is that B-particle is about twice smaller the C-NPs, thus the size change of C-particle is less dramatic if B-particle is attached, and the catalytic activity of C persists. However, if two C-NPs agglomerate into one, the size-change is more significant. During the agglomeration to bulk (Scheme 3, step 6) the average volume of the particles increases, hence, surface-to-volume ratio decreases sharply, and so does the catalytic activity of the particles. The computer simulation program used for mechanism optimization should ‘understand’ that C and the bulk particles are active in a very different way. Therefore, two different symbols are used to distinguish the bulk-colloidal metal – D, and the soluble nanocluster – C. The latter was found to be a true catalyst of reaction (1). By introducing this step it is possible to describe those catalytic systems where the metal particles first nucleate, then agglomerate to the larger particles that act as catalyst and, finally, agglomerate to inactive bulk.
Scheme 3 demonstrates mechanism 2 that was found to be the best-fit for reaction (1) in n-pentanol and iso-propanol (the optimization was performed with MacKinetics tool). The iteration and optimization process is described in Section ESI 10.†
In ethanol, it can be safely concluded that the last agglomeration step is negligible, or does not influence the overall reaction profile at the time of reaction propagation. This may be due to the fact that once the catalyst is formed it is stable and active until the reaction is completed. In n-pentanol and iso-propanol, the conversion depends on the TON, thus the aggregation step influences the total reaction rate. Moreover, the influence of this step in n-pentanol is greater than in iso-propanol (observation of the lower conversions for n-pentanol at the same TON range).
The allylic isomerization reaction was added to the above scheme via the two following steps (where, R – reactant is 1-octene-3-ol, and P is the product, 3-octanone):
(1) R + B → P + B, kobs7
(2) R + C → P + C, kobs8
The B particles may also be catalytically active; thus, we have added this step in order to verify their activity.
Fig. 6 presents the experimental kinetic curve of reaction (1) and the best fitted theoretical curve obtained with mechanism 2 in n-pentanol as solvent (iso-propanol results are shown in Fig. ESI 10†).
Table 2 summarizes the calculated rate constants of the different steps of mechanism 2 with the three solvents. It should be specified that MacKinetics program was used only as an indicator of the validity of the proposed mechanism and rough estimation of the rate constants. In order to procure the exact values, it would be worth to reiterate the mechanism with other kinetic tools and with different reaction pathways (concentrations, temperature, etc.). Therefore, the reported rate constants are the ones that have been observed, or are the fitted values.
| Mechanism 2 | Rate constant | |||
|---|---|---|---|---|
| Units | Ethanol | n-Pentanol | Iso-Propanol | |
| a Summary of the observed rate constants of mechanism 2, in different solvents, as have been obtained from the MacKinetics iterations. The iterations were performed on reaction (1) profiles, obtained under the following conditions: in ethanol – TON = 2.15 × 10⁴ ± 150, conversion = 1 ± 0.05, residual number = 0.02; in n-pentanol – TON = 5.1 × 10⁴ ± 300, residual number = 0.03, in iso-propanol – conversion = 0.72 ± 0.07, TON = 3.8 × 10⁴ ± 200, conversion = 0.95 ± 0.04, residual number = 0.02. | ||||
| k1 | min−1 | 5.4 × 10⁻⁵ | 9 × 10⁻⁵ | 1.2 × 10⁻⁴ |
| kobs2 | M−1 min−1 | 2.123 × 10³ | 5.6 × 10³ | 2.173 × 10³ |
| kobs3 | M−1 min−1 | 6.605 × 10³ | 4.3 × 10³ | 2.7 × 10³ |
| kobs4 | M−1 min−1 | 4.107 × 10³ | 16.7 × 10³ | 52 × 103 |
| kobs5 | M−1 min−1 | 17.1 × 10³ | 74 × 103 | 66 × 103 |
| kobs6 | M−1 min−1 | — | 874 × 103 | 150 × 103 |
| kobs7 | M−1 min−1 | 1.1 × 10³ | 1.1 × 10³ | 0.7 × 10³ |
| kobs8 | M−1 min−1 | 103 × 103 | 52 × 103 | 95 × 103 |
Based on the results summarized in Table 2, we assume that the rate of the isomerization reaction is higher with C-NPs (k8), as compared with B-NPs (k7). Thus, the C-NPs were declared as the ‘true reaction catalyst’ in all the three solvents.
It is important to note that DLS gives an estimated range of the particles sizes, especially in the cases of a mixture of multi-size population of particles and in the presence of organic materials in the tested sample.
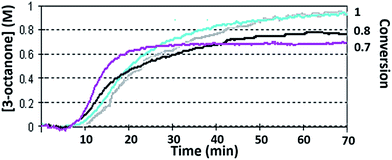
The kinetic profiles of reaction (1), obtained in n-pentanol, are shown in Fig. 8. Under the original conditions of reaction (1) the conversion was 0.7 ± 0.08 – purple line. After applying of stirring (see Fig. 8 deep-blue line), the reaction propagated longer with lower Vmax and lower TOF, yet nonetheless, the final conversion was improved. Depending on TON, enhanced conversions could be achieved by stirring. After the surfactant had been added, the conversion was improved even more, until full reactant consumption with all TONs occurred (see Fig. 8 blue line). The combination of stirring and surfactant gave full conversion with a small decrease in reaction rate, as compared with surfactant/stirring only. Fig. ESI 12† demonstrates the results obtained with iso-propanol. In the case of full conversions, stirring and Aliquat prolonged the reaction time, but lowered the Vmax values.
A series of experiments were performed and the obtained results are summarized in Table 3. Turning back to the proposed mechanism 2, the basic assumption is that the true reaction catalyst is C-NPs, which is formed in situ as a result of the assemblage of two B particles. Aliquat 336 has a specific surfactant structure, i.e., it is able to stabilize NPs, both steric, by organic chains, and electrostatic, by Cl− and N+ ions (Fig. ESI 13†). Consequently, the observed changes in the reaction profile in the presence of Aliquat may ensue directly from these stabilizing properties (Scheme 4).
| Serial numb. | Solvent | TON | [Aliquat] (M) | Stirr. +/− | TOF (min−1) | Vmax (M min−1) | Conversion |
|---|---|---|---|---|---|---|---|
| a Reaction conditions: [reactant 1]0 = 2.6 (M) in the constant volume. The values are shown without corresponding errors in order to emphasize the trend. | |||||||
| 1 | n-Pent | 4.29 × 10⁴ | — | − | 0.74 × 10³ | 0.01 | 0.8 |
| 2 | 4.29 × 10⁴ | 0.1 | − | 0.8 × 10³ | 0.006 | 1 | |
| 3 | 4.29 × 10⁴ | — | + | 0.72 × 10³ | 0.05 | 0.92 | |
| 4 | 7.81 × 10⁴ | — | − | 0.3 × 10³ | 0.008 | 0.67 | |
| 5 | 7.81 × 10⁴ | 0.12 | − | 0.13 × 10³ | 0.005 | 0.85 | |
| 6 | 7.81 × 10⁴ | — | + | 0.12 × 10³ | 0.004 | 0.82 | |
| 7 | 7.81 × 10⁴ | 0.12 | + | 0.12 × 10³ | 0.004 | 1 | |
| 8 | 7.81 × 10⁴ | 0.18 | + | 0.1 × 10³ | 0.035 | 1 | |
| 9 | i-Prop | 6.67 × 10⁴ | — | − | 6.7 × 10³ | 1.1 | 0.92 |
| 10 | 6.67 × 10⁴ | — | + | 3.5 × 10³ | 0.38 | 1 | |
| 11 | 6.67 × 10⁴ | 0.043 | + | 3.1 × 10³ | 0.41 | 1 | |
| 12 | 6.67 × 10⁴ | 0.086 | + | 2.7 × 10³ | 0.36 | 1 | |
| 13 | 6.67 × 10⁴ | 0.13 | + | 3.7 × 10³ | 0.5 | 1 | |
| 14 | 6.67 × 10⁴ | 0.2 | + | 1.7 × 10³ | 0.31 | 1 | |
| 15 | 2.15 × 10⁴ | — | − | 4.9 × 10³ | 1.54 | 1 | |
| 16 | 2.15 × 10⁴ | 0.043 | + | 1.8 × 10³ | 0.52 | 1 | |
| 17 | 2.15 × 10⁴ | 0.13 | + | 1.3 × 10³ | 0.06 | 1 | |
NPs of type B are formed in the first three steps of mechanism 2. In the presence of Aliquat, there is some energy gap, which stabilizes B-NPs, that the particles should overcome in order to approach one another – the stabilization of the intermediates slows the reaction rate. This inhibits the formation and the autocatalytic growth of C-NPs, the actual catalyst, and causes the formation of the 3-octanone to proceeds slower. This leads to the observed change in the slope of the kinetic profile curve and to lengthening of the reaction time. On the other hand, C-NPs are also stabilized. Once the true reaction catalyst is formed, it does not easily aggregate to larger colloid-bulk particles. The final agglomeration step 6 that generates D inactive particles is averted, or significantly decelerated in the presence of Aliquat. For this reason, a higher conversion was attained even in cases where a small concentration of Ru-salt precatalyst was used (1.6 × 10⁻⁵ M).
Another probable cause for the diminishing reaction rate in the presence of Aliquat may be the difficulty in approaching the catalyst surface by substrate 1-octene-3-ol. Aliquat coordinates (either by Cl− or by NR3+) to the active sites of the catalyst, the sites that are critical for the reaction to take place, otherwise they may simply obstruct the reactant movement toward the catalysts surface by its long organic chains.
Following stirring, similar effects were obtained. Mechanical stirring prevents or inhibits the agglomeration of metallic particles. Accordingly, it inhibits the formation of C, but then, once again, it slows down the final agglomeration to the inactive bulk-metal. All this brings to analogous alteration in the profile curve – smaller rate and higher conversion. Stirring by itself is not always sufficient to give full conversions. The mass transfer step usually has an influence on the overall reaction rate in the case of heterogeneous catalysis, and it is typically enhanced by mixing. However, in our case, the observed effect is inverted, yet still corresponds well to the proposed mechanism, where the catalyst is formed in situ. The combination of Aliquat and stirring gave the same kind of deviations from the original profile. Again, these observations are additional evidence of the aptness of the proposed mechanism.
DLS measurements were taken for the reaction mixtures in the presence of stirring and Aliquat in the course of the reaction (Fig. 9).
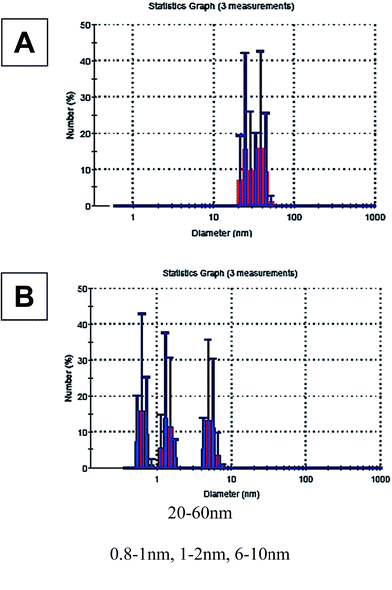
The DLS results show the distribution of large agglomerated particles, from D size range (that is supposed to be catalytically inactive) in the case of partial conversion (Fig. 9A). After adding Aliquat and stirring, the size ranges of the particles obtained were clearly smaller (Fig. 9B). Three populations were found: two of them suitable for B-size range (≤2 nm), the third one – from the bigger sizes – suitable for the C-NPs. These populations consist of approximately the same number of NPs. This observation supports the proposed hypotheses regarding the stabilization of B and C-NPs. At the original conditions with the full conversion cases, typically, only C-NPs were detected at the end of the reaction.
According to these observations, the role of the agglomeration in the deactivation of C-NPs is apparent.
Discussion
In ethanol as a medium, even with extremely small concentrations of catalyst (TON = 251![[thin space (1/6-em)]](https://www.rsc.org/images/entities/char_2009.gif) 000), full conversion was achieved. However, in n-pentanol and iso-propanol, conversions could also be partial, depending on the TON. The rational for this difference is as follows: Ru0NPs that are assumed to be the true reaction catalysts, have partial surface charge, i.e. they have a slightly ‘ionic’ character. Hence, in more polar solvent, the solubility of NPs should be greater, and the catalyst would show stronger resistance towards the aggregation step, i.e. more stable. The polarity order of the solvents is: ethanol > iso-propanol > n-pentanol. Therefore, in ethanol, once the active catalyst is formed, it works until the full conversion of reaction (1), without agglomeration and with no need for the aggregation step in the best-fitted model. For iso-propanol, the conversions were not complete, but they were still higher than those for n-pentanol at the same TON range (it is reflected in the kobs6 values of mechanism 2). For n-pentanol, the temperature might be another possible factor for lower conversions. Probably, in our system, agglomeration step 6 occurs faster at higher temperatures, causing only partial conversion and larger value of kobs6.
000), full conversion was achieved. However, in n-pentanol and iso-propanol, conversions could also be partial, depending on the TON. The rational for this difference is as follows: Ru0NPs that are assumed to be the true reaction catalysts, have partial surface charge, i.e. they have a slightly ‘ionic’ character. Hence, in more polar solvent, the solubility of NPs should be greater, and the catalyst would show stronger resistance towards the aggregation step, i.e. more stable. The polarity order of the solvents is: ethanol > iso-propanol > n-pentanol. Therefore, in ethanol, once the active catalyst is formed, it works until the full conversion of reaction (1), without agglomeration and with no need for the aggregation step in the best-fitted model. For iso-propanol, the conversions were not complete, but they were still higher than those for n-pentanol at the same TON range (it is reflected in the kobs6 values of mechanism 2). For n-pentanol, the temperature might be another possible factor for lower conversions. Probably, in our system, agglomeration step 6 occurs faster at higher temperatures, causing only partial conversion and larger value of kobs6.
The TOF results show that the best combination of reaction (1) parameters is achieved when iso-propanol is used as the reaction solvent. The maximum value of TOF in iso-propanol is 7.2 × 10³ ± 100 (min−1), in ethanol – 3.40 × 10³ ± 80 (min−1), and in n-pentanol – 3.71 × 10³ ± 80 (min−1). This may be explained by the redox potential of alcohols used to give the reduction of Ru3+. We advocate that in our system, alcohols reduce the Ru3+ to form Ru0 nanoclusters.30–33 The mechanism for the oxidation of alcohols by transition metal catalysis is not fully known. There are only model schemes for some specific cases.34–36 Nonetheless, most of the studies agree that the cleavage of α C–H bond in the oxidation process has a critical influence on the total reaction rate.30,37 Thus, the stronger the α C–H bond, the slower the reaction. The order of α C–H BDE's of the above solvents is as follows: ethanol > n-pentanol > iso-propanol.38 Ethanol and n-pentanol are primary alcohols, hence, their BDEs' values are similar, however, since iso-propanol is a secondary alcohol, ad its BDE is more significantly different. Hence, the oxidation reaction is more efficient with iso-propanol, i.e. the active catalyst is formed faster and in a larger quantity. This is very well reflected in the observed TOF values in the ‘optimal region’ (Fig. 5): in iso-propanol, a larger amount of the active C-type catalyst is formed, and so, the activity per mol of the complex is higher. This tendency can also be scrutinized by comparing the observed rate constants of the rate-determining steps for the C-NPs formation process (unfortunately, this step is less accurate in our system, based on the observed induction times). Roughly, in iso-propanol the best approximated value of k1 is the largest one, despite the higher temperatures in n-pentanol.
This explains the amount of bulk metal that precipitates with time on the bottom of the reaction flask after reaction (1) takes place. In iso-propanol, some dark precipitation was observed within about a week, in a sufficient amount for it to be visible by a naked eye. On the other hand, the formation of solids in ethanol and n-pentanol was not detected at all, even after 2 months. At the same time, we believe that the agglomeration step in n-pentanol is the fastest, compared with the other solvents used, i.e. the fastest formation of the D-bulk particles, thus one can expect a rapid precipitation in n-pentanol. This is probably the case (kobs6(n-pentanol) > kobs6(iso-propanol)), but the amount of NPs formed in n-pentanol is significantly smaller than in iso-propanol, due to lower k1 value, and that is why the precipitant is less intensive. In ethanol, the reason for such behavior is both, relative stability of NPs and a smaller number of the NPs present in the mixture.
From the conceivable kinetic mechanisms that were examined, a better fitting was observed with C as the true reaction catalyst: smaller values of residual numbers and better visual approximation were obtained, moreover so in mechanism 2, where the double-cycle catalysis (by B and C) fitted even better. However, this result may be achieved by addition of a degree of freedom to the optimization process. We believe that the step of agglomeration to the inactive bulk D might also be autocatalytic with C and B particles (C + D → 1.5D and B + D → 1.25D). However, good enough estimations were achieved without the addition of those steps. Comparing the optimized values of two-rate constants, kobs7 (B-catalyst) and kobs8 (C-catalyst) in all the solvents, the suggestion that C is the true reaction catalyst is most likely correct.
Comparison of the catalytic activity of B, C and D particles in this system can be made according to the geometry of the particles and the size-dependent metal-to-ligand BDE theory. From the shape point of view, each particle comprises of vertex, edge and face atoms,1 however, most probably, only a part of the latter is catalytically active in the present reaction.39 Thus, the size and the shape influence much of the surface structure40 and the catalytic activity41,42 of the particles and, probably, C-NPs have the larger number of surface-available atoms of the catalytic type.43–45 According to the metal-to-ligand binding theory,23,24,46–48 bulk metal D is a much weaker catalyst with the lowest D-ligand BDE in comparison with the B and C-NPs. This is due to its smaller surface-to-volume ratio, which is known to be critical in heterogeneous catalytic activity. Another reason for D's inactivity might be its electrophilic nature. The surface of transition metal NPs has an electrophilic character. Hence, if the area-to-volume of a particle becomes smaller, it should impair the catalytic activity of the particle, i.e. D-particles exhibit a low affinity to the substrate. Moreover, the probability of a film forming around the D-particle and annealing to a more stable (but not the most active) geometry, can impair the catalytic activity even more. Comparison of B and C-NPs was discussed previously.7 Shortly, the adsorption to D-particles is very weak. Since D hardly attracts the reactant, it can be safely said that it is catalytically not reactive. The adsorption of ligands to B-NPs is too strong to allow a sufficient reaction rate (lower catalytic activity). C-NPs, – in the middle way – have enough of the electrophilic nature of small NPs to give an adequate affinity of reaction substrate. However, this binding is not too strong and enables the release of the formed product.
The poisoning test, with addition of Hg0, showed that reaction (1) stalled in the presence of mercury, as was reported previously.7
Conclusions
In this study, a catalytic allylic isomerization reaction was scrutinized in order to confirm if it follows a mechanism of a homogeneous catalysis by a complex or a heterogeneous catalysis, through transition metal NPs that were formed in situ. This isomerization process, in the presence of numerous organometallic complexes, including the complex, was previously believed to undergo homogeneous catalysis by the regular mechanisms of catalytic organometallic chemistry. We already demonstrated that the reaction proceeds via heterogeneous catalysis of in situ formed Ru0NPs in ethanol. Interestingly, the reaction mechanism varied as the reaction solvent was changed to iso-propanol or n-pentanol. Ru0NPs catalysis was examined in a series of kinetic experiments. The main observations were as follows: (1) the reaction profiles are of sigmoidal form; (2) TEM and DLS measurements, coupled with the obtained visual changes of the reaction mixture, proved the formation of Ru0NPs of various sizes during the isomerization reaction; (3) the optimization of the kinetic mechanism provided the evidence for the triple-autocatalytic and multi-step reaction behavior, where an in situ formation of catalyst takes place; (4) the choice of the true reaction catalyst (C-NPs) kinetically consents with the reaction profiles, conversions, and agrees with all experimentally observed data; (5) the addition of the final aggregation step was kinetically justified; (6) addition of stirring/Aliquat 336 resulted in the interesting phenomenon that supported the proposed mechanism even more.The general conclusion of this research is: allylic alcohol isomerization of 1-octene-3-ol to 3-octanone, in the presence of μ-oxo-triruthenium acetate as a precatalyst, takes place via heterogeneous catalysis through Ru0 nanoclusters that are formed in situ. This hypothesis is true for all the three solvents tested. In iso-propanol and n-pentanol, the catalytic NPs aggregate and lose their catalytic functionality with reaction propagation. Therefore, a new aggregation-to-bulk step was added to the reaction mechanism. We speculate that this step is common for most studies where the metal NPs self-assembly involved at the absence of the stabilizing factors.
Conflicts of interest
There is no conflict of interest in this work.Notes and references
- D. Astruc, F. Lu and J. R. Aranzaes, Angew. Chem., Int. Ed., 2005, 44, 7852–7872 CrossRef CAS PubMed.
- M. Haruta, CATTECH, 2002, 6, 102–115 CrossRef CAS.
- N. T. S. Phan, M. Van Der Sluys and C. W. Jones, Adv. Synth. Catal., 2006, 348, 609–679 CrossRef CAS.
- P. Gamez, F. Fache and M. Lemaire, Tetrahedron: Asymmetry, 2005, 16, 747 CrossRef CAS.
- G. Schmid, V. Maihack, F. Lantermann and S. Peschel, J. Chem. Soc., Dalton Trans., 1996, 589–595 RSC.
- M. A. Watzky and R. G. Finke, J. Am. Chem. Soc., 1997, 119, 10382–10400 CrossRef CAS.
- M. Hitrik, A. Dandapat and Y. Sasson, RSC Adv., 2016, 6, 68041–68048 RSC.
- O. Almog, A. Bino and D. Garfinkelshweky, Inorg. Chim. Acta, 1993, 213, 99–102 CrossRef CAS.
- J. García-Álvarez, J. Gimeno and F. J. Suárez, Organometallics, 2010, 30, 2893–2896 CrossRef.
- C. Vidal, F. J. Suárez and J. García-Álvarez, Catal. Commun., 2014, 44, 76 CrossRef CAS.
- A. Dikhtiarenko, S. Khainakov, J. R. Garcia and J. Gimeno, Inorg. Chim. Acta, 2017, 454, 107–116 CrossRef CAS.
- J. D. Aiken and R. G. Finke, Chem. Mater., 1999, 11, 1035–1047 CrossRef CAS.
- B. J. Hornstein and R. G. Finke, Chem. Mater., 2003, 15, 899–909 CrossRef CAS.
- S. Ozkar and R. G. Finke, Langmuir, 2003, 19, 6247–6260 CrossRef.
- P. Kent, J. E. Mondloch and R. G. Finke, ACS Catal., 2016, 6, 5449–5461 CrossRef CAS.
- S. Ozkar and R. G. Finke, Langmuir, 2016, 32, 3699–3716 CrossRef CAS PubMed.
- Y. Lin and R. G. Finke, J. Am. Chem. Soc., 1994, 116, 8335–8353 CrossRef CAS.
- Y. Lin and R. G. Finke, Inorg. Chem., 1994, 33, 4891–4910 CrossRef CAS.
- S. A. Fouda, B. C. Y. Hui and G. L. Rempel, Inorg. Chem., 1978, 17, 3213–3220 CrossRef CAS.
- S. A. Fouda and G. L. Rempel, Inorg. Chem., 1979, 18, 1–8 CrossRef CAS.
- P. D. Kent, J. E. Mondloch and R. G. Finke, J. Am. Chem. Soc., 2014, 136, 1930–1941 CrossRef CAS PubMed.
- J. E. Mondloch, E. Bayram and R. G. Finke, J. Mol. Catal. A: Chem., 2012, 355, 1–38 CrossRef CAS.
- C. Besson, E. E. Finney and R. G. Finke, Chem. Mater., 2005, 17, 4925–4938 CrossRef CAS.
- C. Besson, E. E. Finney and R. G. Finke, J. Am. Chem. Soc., 2005, 127, 8179–8184 CrossRef CAS PubMed.
- P. Legzdins, R. W. Mitchell, G. L. Rempel, J. D. Ruddick and G. Wilkinso, J. Chem. Soc. A, 1970, 3322–3326 RSC.
- W. S. I. Leipold, USA, 1997, http://members.dca.net/leipold/mk/MKppc.hqx.
- Y. Urashima, T. Wakabayashi and T. Masaki, Mineral. J., 1974, 7, 439–444 Search PubMed.
- T. W. Hansen, J. B. Wagner, P. L. Hansen, S. Dahl, H. Topsoe and C. J. H. Jacobsen, Science, 2001, 294, 1508–1510 CrossRef CAS PubMed.
- L. Bentea, M. A. Watzky and R. G. Finke, J. Phys. Chem. C, 2017, 121, 5302–5312 CAS.
- B. A. Steinhoff and S. S. Stahl, J. Am. Chem. Soc., 2006, 128, 4348–4355 CrossRef CAS PubMed.
- Y. Sasson and J. Blum, J. Chem. Soc., Chem. Commun., 1974, 309–310 RSC.
- H. Hirai and N. Toshima, Tailored Metal Catalysts, D. Reidel, Dordrecht, vol. 1, 1986 Search PubMed.
- H. J. Hah, S. M. Koo and S. H. Lee, J. Sol-Gel Sci. Technol., 2003, 26, 467–471 CrossRef CAS.
- M. Baghmar and P. K. Sharma, Int. J. Chem. Kinet., 2001, 33, 390–395 CrossRef CAS.
- M. Baghmar and P. K. Sharma, J. Chem. Sci., 2001, 113, 139–146 CrossRef CAS.
- T. Ohta, T. Kamachi, Y. Shiota and K. Yoshizawa, J. Org. Chem., 2001, 66, 4122–4131 CrossRef CAS PubMed.
- E. Denisov and I. Afanas'ev, Oxidation and Antioxidants in Organic Chemistry and Biology, CRC Press, 2005 Search PubMed.
- Y. R. Luo, Comprehensive Handbook of Chemical Bond Energies, CRC Press, Boca Raton, FL, 2007 Search PubMed.
- C. O. Bennett and M. Che, J. Catal., 1989, 120, 293–302 CrossRef CAS.
- R. Vanharde and F. Hartog, Surf. Sci., 1969, 15, 189–230 CrossRef.
- R. L. Augustine and P. Techasauvapak, J. Mol. Catal., 1994, 87, 95–105 CrossRef CAS.
- G. C. Bond, J. Catal., 1992, 136, 631–632 CrossRef CAS.
- R. L. Augustine and S. T. Oleary, J. Mol. Catal. A: Chem., 1995, 95, 277–285 CrossRef CAS.
- A. Benedetti, G. Fagherazzi, F. Pinna, G. Rampazzo, M. Selva and G. Strukul, Catal. Lett., 1991, 10, 215–223 CrossRef CAS.
- L. Piccolo and C. R. Henry, J. Mol. Catal. A: Chem., 2001, 167, 181–190 CrossRef CAS.
- R. E. Benfield, J. A. Creighton, D. G. Eadon and G. Schmid, Z. Phys. D: At., Mol. Clusters, 1989, 12, 533–536 CrossRef CAS.
- E. K. Parks, G. C. Nieman, K. P. Kerns and S. J. Riley, J. Chem. Phys., 1998, 108, 3731–3739 CrossRef CAS.
- G. Schmid, Chem. Rev., 1992, 92, 1709–1727 CrossRef CAS.
Footnote |
| † Electronic supplementary information (ESI) available. See DOI: 10.1039/c7ra11133a |
| This journal is © The Royal Society of Chemistry 2018 |

